数据分析与预测(四)——相关性分析
0 前言
变量之间的相关性分析主要包括:
- 分析变量自身的规律
- 自相关分析
- 偏相关分析
- 分析任意两个等长数列之间的相关性
- 简单相关分析
- 允许在一定的间隔下进行简单的相关分析
- 互相关分析
- 分析两组变量的相关性
- 典型的相关分析
1 相关图的绘制
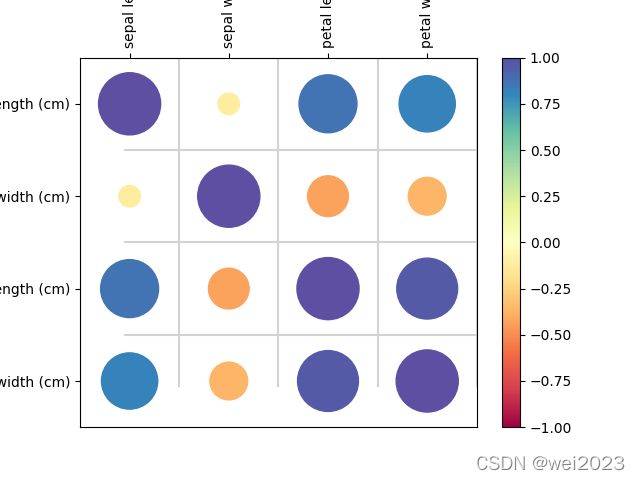
1.1 相关矩阵图
	import matplotlib.pyplot as plt
	import numpy as np
    import pandas as pd
    from sklearn import datasets
    import seaborn as sns

    iris = datasets.load_iris()
    iris_data = pd.DataFrame(iris.data, columns=iris.feature_names)
    iris_data['species'] = iris.target_names[iris.target]

    df = iris_data.drop(columns='species')

    corr = df.corr()
    corrplot(corr, cmap='Spectral', s=2000)

    pd.set_option('display.max_columns', None)
    pd.set_option('display.max_rows', None)
    print('corr: \n', corr)
corrplot函数
def corrplot(corr, cmap, s):
    import matplotlib.pyplot as plt
    x, y, z = [], [], []
    N = corr.shape[0]
    for row in range(N):
        for column in range(N):
            x.append(row)
            y.append(N - 1 - column)
            z.append(round(corr.iloc[row, column], 2))
    sc = plt.scatter(x, y, c=z, vmin=-1, vmax=1, s=s * np.absolute(z), cmap=plt.cm.get_cmap(cmap))
    plt.colorbar(sc)
    plt.xlim((-0.5, N - 0.5))
    plt.ylim((-0.5, N - 0.5))
    plt.xticks(range(N), corr.columns, rotation=90)
    plt.yticks(range(N)[::-1], corr.columns)
    plt.grid(False)
    ax = plt.gca()

    ax.xaxis.set_ticks_position('top')

    internal_space = [0.5 + k for k in range(4)]
    [plt.plot([m, m], [-.05, N - 0.5], c='lightgray') for m in internal_space]
    [plt.plot([-.05, N - 0.5], [m, m], c='lightgray') for m in internal_space]
    plt.show()
iris 数据集
     sepal length (cm)  sepal width (cm)  ...  petal width (cm)    species
0                  5.1               3.5  ...               0.2     setosa
1                  4.9               3.0  ...               0.2     setosa
2                  4.7               3.2  ...               0.2     setosa
3                  4.6               3.1  ...               0.2     setosa
4                  5.0               3.6  ...               0.2     setosa
..                 ...               ...  ...               ...        ...
145                6.7               3.0  ...               2.3  virginica
146                6.3               2.5  ...               1.9  virginica
147                6.5               3.0  ...               2.0  virginica
148                6.2               3.4  ...               2.3  virginica
149                5.9               3.0  ...               1.8  virginica
计算相关系数矩阵
                    sepal length (cm)  sepal width (cm)  petal length (cm)   petal width (cm)
sepal length (cm)           1.000000         -0.117570           0.871754           0.817941
sepal width (cm)           -0.117570          1.000000          -0.428440           -0.366126
petal length (cm)           0.871754         -0.428440           1.000000           0.962865
petal width (cm)            0.817941         -0.366126           0.962865           1.000000
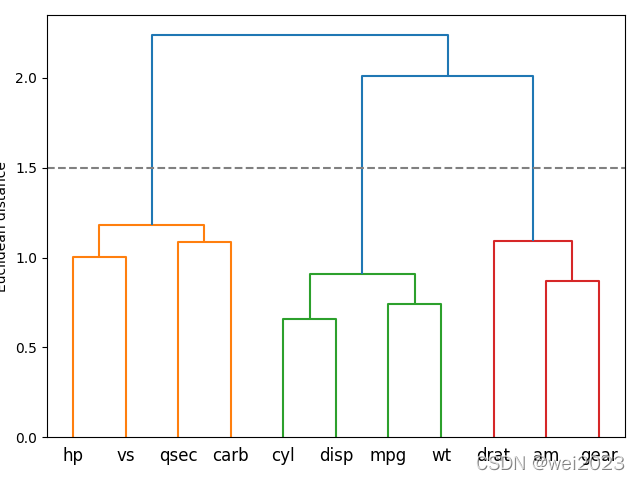
1.2 相关层次图
    import numpy as np
    import pandas as pd
    mtcars = pd.read_csv('data/mtcars.csv', index_col=0)
    print(mtcars)
    d = np.sqrt(1 - mtcars.corr() * mtcars.corr())
    d.fillna(0,inplace=True)
    print(d)

    d.dropna()
    from scipy.spatial.distance import pdist, squareform
    from scipy.cluster.hierarchy import linkage
    from scipy.cluster.hierarchy import dendrogram
    row_cluster = linkage(pdist(d, metric='euclidean'), method='ward')
    row_dendr = dendrogram(row_cluster, labels=d.index)
    plt.tight_layout()
    plt.ylabel('Euclidean distance')
    plt.plot([0, 2000], [1.5, 1.5], c='gray', linestyle='--')
    plt.show()
mtcars.csv
"","mpg","cyl","disp","hp","drat","wt","qsec","vs","am","gear","carb"
"Mazda RX4",21,6,160,110,3.9,2.62,16.46,0,1,4,4
"Mazda RX4 Wag",21,6,160,110,3.9,2.875,17.02,0,1,4,4
"Datsun 710",22.8,4,108,93,3.85,2.32,18.61,1,1,4,1
"Hornet 4 Drive",21.4,6,258,110,3.08,3.215,19.44,1,0,3,1
"Hornet Sportabout",18.7,8,360,175,3.15,3.44,17.02,0,0,3,2
"Valiant",18.1,6,225,105,2.76,3.46,20.22,1,0,3,1
"Duster 360",14.3,8,360,245,3.21,3.57,15.84,0,0,3,4
"Merc 240D",24.4,4,146.7,62,3.69,3.19,20,1,0,4,2
"Merc 230",22.8,4,140.8,95,3.92,3.15,22.9,1,0,4,2
"Merc 280",19.2,6,167.6,123,3.92,3.44,18.3,1,0,4,4
"Merc 280C",17.8,6,167.6,123,3.92,3.44,18.9,1,0,4,4
"Merc 450SE",16.4,8,275.8,180,3.07,4.07,17.4,0,0,3,3
"Merc 450SL",17.3,8,275.8,180,3.07,3.73,17.6,0,0,3,3
"Merc 450SLC",15.2,8,275.8,180,3.07,3.78,18,0,0,3,3
"Cadillac Fleetwood",10.4,8,472,205,2.93,5.25,17.98,0,0,3,4
"Lincoln Continental",10.4,8,460,215,3,5.424,17.82,0,0,3,4
"Chrysler Imperial",14.7,8,440,230,3.23,5.345,17.42,0,0,3,4
"Fiat 128",32.4,4,78.7,66,4.08,2.2,19.47,1,1,4,1
"Honda Civic",30.4,4,75.7,52,4.93,1.615,18.52,1,1,4,2
"Toyota Corolla",33.9,4,71.1,65,4.22,1.835,19.9,1,1,4,1
"Toyota Corona",21.5,4,120.1,97,3.7,2.465,20.01,1,0,3,1
"Dodge Challenger",15.5,8,318,150,2.76,3.52,16.87,0,0,3,2
"AMC Javelin",15.2,8,304,150,3.15,3.435,17.3,0,0,3,2
"Camaro Z28",13.3,8,350,245,3.73,3.84,15.41,0,0,3,4
"Pontiac Firebird",19.2,8,400,175,3.08,3.845,17.05,0,0,3,2
"Fiat X1-9",27.3,4,79,66,4.08,1.935,18.9,1,1,4,1
"Porsche 914-2",26,4,120.3,91,4.43,2.14,16.7,0,1,5,2
"Lotus Europa",30.4,4,95.1,113,3.77,1.513,16.9,1,1,5,2
"Ford Pantera L",15.8,8,351,264,4.22,3.17,14.5,0,1,5,4
"Ferrari Dino",19.7,6,145,175,3.62,2.77,15.5,0,1,5,6
"Maserati Bora",15,8,301,335,3.54,3.57,14.6,0,1,5,8
"Volvo 142E",21.4,4,121,109,4.11,2.78,18.6,1,1,4,2
mtcars数据集读取结果:
                    mpg  cyl   disp   hp  drat  ...   qsec  vs  am  gear  carb
Mazda RX4            21.0    6  160.0  110  3.90  ...  16.46   0   1     4     4
Mazda RX4 Wag        21.0    6  160.0  110  3.90  ...  17.02   0   1     4     4
Datsun 710           22.8    4  108.0   93  3.85  ...  18.61   1   1     4     1
Hornet 4 Drive       21.4    6  258.0  110  3.08  ...  19.44   1   0     3     1
Hornet Sportabout    18.7    8  360.0  175  3.15  ...  17.02   0   0     3     2
Valiant              18.1    6  225.0  105  2.76  ...  20.22   1   0     3     1
Duster 360           14.3    8  360.0  245  3.21  ...  15.84   0   0     3     4
Merc 240D            24.4    4  146.7   62  3.69  ...  20.00   1   0     4     2
Merc 230             22.8    4  140.8   95  3.92  ...  22.90   1   0     4     2
Merc 280             19.2    6  167.6  123  3.92  ...  18.30   1   0     4     4
Merc 280C            17.8    6  167.6  123  3.92  ...  18.90   1   0     4     4
Merc 450SE           16.4    8  275.8  180  3.07  ...  17.40   0   0     3     3
Merc 450SL           17.3    8  275.8  180  3.07  ...  17.60   0   0     3     3
Merc 450SLC          15.2    8  275.8  180  3.07  ...  18.00   0   0     3     3
Cadillac Fleetwood   10.4    8  472.0  205  2.93  ...  17.98   0   0     3     4
Lincoln Continental  10.4    8  460.0  215  3.00  ...  17.82   0   0     3     4
Chrysler Imperial    14.7    8  440.0  230  3.23  ...  17.42   0   0     3     4
Fiat 128             32.4    4   78.7   66  4.08  ...  19.47   1   1     4     1
Honda Civic          30.4    4   75.7   52  4.93  ...  18.52   1   1     4     2
Toyota Corolla       33.9    4   71.1   65  4.22  ...  19.90   1   1     4     1
Toyota Corona        21.5    4  120.1   97  3.70  ...  20.01   1   0     3     1
Dodge Challenger     15.5    8  318.0  150  2.76  ...  16.87   0   0     3     2
AMC Javelin          15.2    8  304.0  150  3.15  ...  17.30   0   0     3     2
Camaro Z28           13.3    8  350.0  245  3.73  ...  15.41   0   0     3     4
Pontiac Firebird     19.2    8  400.0  175  3.08  ...  17.05   0   0     3     2
Fiat X1-9            27.3    4   79.0   66  4.08  ...  18.90   1   1     4     1
Porsche 914-2        26.0    4  120.3   91  4.43  ...  16.70   0   1     5     2
Lotus Europa         30.4    4   95.1  113  3.77  ...  16.90   1   1     5     2
Ford Pantera L       15.8    8  351.0  264  4.22  ...  14.50   0   1     5     4
Ferrari Dino         19.7    6  145.0  175  3.62  ...  15.50   0   1     5     6
Maserati Bora        15.0    8  301.0  335  3.54  ...  14.60   0   1     5     8
Volvo 142E           21.4    4  121.0  109  4.11  ...  18.60   1   1     4     2
计算获得相关系数矩阵
           mpg       cyl          disp  ...        am      gear      carb
mpg   0.000000  0.523278  5.307133e-01  ...  0.800126  0.877113  0.834555
cyl   0.523278  0.000000  4.316673e-01  ...  0.852574  0.870207  0.849873
disp  0.530713  0.431667  2.107342e-08  ...  0.806505  0.831470  0.918691
hp    0.630526  0.554104  6.118826e-01  ...  0.969975  0.992068  0.661650
drat  0.732124  0.714203  7.039859e-01  ...  0.701458  0.714525  0.995870
wt    0.497159  0.622656  4.598822e-01  ...  0.721422  0.812266  0.903965
qsec  0.908132  0.806494  9.010583e-01  ...  0.973224  0.977121  0.754544
vs    0.747698  0.585307  7.037821e-01  ...  0.985728  0.978547  0.821917
am    0.800126  0.852574  8.065052e-01  ...  0.000000  0.607841  0.998344
gear  0.877113  0.870207  8.314703e-01  ...  0.607841  0.000000  0.961709
carb  0.834555  0.849873  9.186911e-01  ...  0.998344  0.961709  0.000000
2 互相关分析
Airline.csv 数据集:
"","airline","year","cost","output","pf","lf"
"1",1,1,1140640,0.952757,106650,0.534487
"2",1,2,1215690,0.986757,110307,0.532328
"3",1,3,1309570,1.09198,110574,0.547736
"4",1,4,1511530,1.17578,121974,0.540846
"5",1,5,1676730,1.16017,196606,0.591167
"6",1,6,1823740,1.17376,265609,0.575417
"7",1,7,2022890,1.29051,263451,0.594495
"8",1,8,2314760,1.39067,316411,0.597409
"9",1,9,2639160,1.61273,384110,0.638522
"10",1,10,3247620,1.82544,569251,0.676287
"11",1,11,3787750,1.54604,871636,0.605735
"12",1,12,3867750,1.5279,997239,0.61436
"13",1,13,3996020,1.6602,938002,0.633366
"14",1,14,4282880,1.82231,859572,0.650117
"15",1,15,4748320,1.93646,823411,0.625603
"16",2,1,569292,0.520635,103795,0.490851
"17",2,2,640614,0.534627,111477,0.473449
"18",2,3,777655,0.655192,118664,0.503013
"19",2,4,999294,0.791575,114797,0.512501
"20",2,5,1203970,0.842945,215322,0.566782
"21",2,6,1358100,0.852892,281704,0.558133
"22",2,7,1501350,0.922843,304818,0.558799
"23",2,8,1709270,1,348609,0.57207
"24",2,9,2025400,1.19845,374579,0.624763
"25",2,10,2548370,1.34067,544109,0.628706
"26",2,11,3137740,1.32624,853356,0.58915
"27",2,12,3557700,1.24852,1003200,0.532612
"28",2,13,3717740,1.25432,941977,0.526652
"29",2,14,3962370,1.37177,856533,0.540163
"30",2,15,4209390,1.38974,821361,0.528775
"31",3,1,286298,0.262424,118788,0.524334
"32",3,2,309290,0.266433,123798,0.537185
"33",3,3,342056,0.306043,122882,0.582119
"34",3,4,374595,0.325586,131274,0.579489
"35",3,5,450037,0.345706,222037,0.606592
"36",3,6,510412,0.367517,278721,0.60727
"37",3,7,575347,0.409937,306564,0.582425
"38",3,8,669331,0.448023,356073,0.573972
"39",3,9,783799,0.539595,378311,0.654256
"40",3,10,913883,0.539382,555267,0.631055
"41",3,11,1041520,0.467967,850322,0.56924
"42",3,12,1125800,0.450544,1015610,0.589682
"43",3,13,1096070,0.468793,954508,0.587953
"44",3,14,1198930,0.494397,886999,0.565388
"45",3,15,1170470,0.493317,844079,0.577078
"46",4,1,145167,0.086393,114987,0.432066
"47",4,2,170192,0.09674,120501,0.439669
"48",4,3,247506,0.1415,121908,0.488932
"49",4,4,309391,0.169715,127220,0.484181
"50",4,5,354338,0.173805,209405,0.529925
"51",4,6,373941,0.164272,263148,0.532723
"52",4,7,420915,0.170906,316724,0.549067
"53",4,8,474017,0.17784,363598,0.55714
"54",4,9,532590,0.192248,389436,0.611377
"55",4,10,676771,0.242469,547376,0.645319
"56",4,11,880438,0.256505,850418,0.611734
"57",4,12,1052020,0.249657,1011170,0.580884
"58",4,13,1193680,0.273923,951934,0.572047
"59",4,14,1303390,0.371131,881323,0.59457
"60",4,15,1436970,0.421411,831374,0.585525
"61",5,1,91361,0.051028,118222,0.442875
"62",5,2,95428,0.052646,116223,0.462473
"63",5,3,98187,0.056348,115853,0.519118
"64",5,4,115967,0.066953,129372,0.529331
"65",5,5,138382,0.070308,243266,0.557797
"66",5,6,156228,0.073961,277930,0.556181
"67",5,7,183169,0.084946,317273,0.569327
"68",5,8,210212,0.095474,358794,0.583465
"69",5,9,274024,0.119814,397667,0.631818
"70",5,10,356915,0.150046,566672,0.604723
"71",5,11,432344,0.144014,848393,0.587921
"72",5,12,524294,0.1693,1005740,0.616159
"73",5,13,530924,0.172761,958231,0.605868
"74",5,14,581447,0.18667,872924,0.594688
"75",5,15,610257,0.213279,844622,0.635545
"76",6,1,68978,0.037682,117112,0.448539
"77",6,2,74904,0.039784,119420,0.475889
"78",6,3,83829,0.044331,116087,0.500562
"79",6,4,98148,0.050245,122997,0.500344
"80",6,5,118449,0.055046,194309,0.528897
"81",6,6,133161,0.052462,307923,0.495361
"82",6,7,145062,0.056977,323595,0.510342
"83",6,8,170711,0.06149,363081,0.518296
"84",6,9,199775,0.069027,386422,0.546723
"85",6,10,276797,0.092749,564867,0.554276
"86",6,11,381478,0.11264,874818,0.517766
"87",6,12,506969,0.154154,1013170,0.580049
"88",6,13,633388,0.186461,930477,0.556024
"89",6,14,804388,0.246847,851676,0.537791
"90",6,15,1009500,0.304013,819476,0.525775
LakeHuron.csv 数据集
"","time","value"
"1",1875,580.38
"2",1876,581.86
"3",1877,580.97
"4",1878,580.8
"5",1879,579.79
"6",1880,580.39
"7",1881,580.42
"8",1882,580.82
"9",1883,581.4
"10",1884,581.32
"11",1885,581.44
"12",1886,581.68
"13",1887,581.17
"14",1888,580.53
"15",1889,580.01
"16",1890,579.91
"17",1891,579.14
"18",1892,579.16
"19",1893,579.55
"20",1894,579.67
"21",1895,578.44
"22",1896,578.24
"23",1897,579.1
"24",1898,579.09
"25",1899,579.35
"26",1900,578.82
"27",1901,579.32
"28",1902,579.01
"29",1903,579
"30",1904,579.8
"31",1905,579.83
"32",1906,579.72
"33",1907,579.89
"34",1908,580.01
"35",1909,579.37
"36",1910,578.69
"37",1911,578.19
"38",1912,578.67
"39",1913,579.55
"40",1914,578.92
"41",1915,578.09
"42",1916,579.37
"43",1917,580.13
"44",1918,580.14
"45",1919,579.51
"46",1920,579.24
"47",1921,578.66
"48",1922,578.86
"49",1923,578.05
"50",1924,577.79
"51",1925,576.75
"52",1926,576.75
"53",1927,577.82
"54",1928,578.64
"55",1929,580.58
"56",1930,579.48
"57",1931,577.38
"58",1932,576.9
"59",1933,576.94
"60",1934,576.24
"61",1935,576.84
"62",1936,576.85
"63",1937,576.9
"64",1938,577.79
"65",1939,578.18
"66",1940,577.51
"67",1941,577.23
"68",1942,578.42
"69",1943,579.61
"70",1944,579.05
"71",1945,579.26
"72",1946,579.22
"73",1947,579.38
"74",1948,579.1
"75",1949,577.95
"76",1950,578.12
"77",1951,579.75
"78",1952,580.85
"79",1953,580.41
"80",1954,579.96
"81",1955,579.61
"82",1956,578.76
"83",1957,578.18
"84",1958,577.21
"85",1959,577.13
"86",1960,579.1
"87",1961,578.25
"88",1962,577.91
"89",1963,576.89
"90",1964,575.96
"91",1965,576.8
"92",1966,577.68
"93",1967,578.38
"94",1968,578.52
"95",1969,579.74
"96",1970,579.31
"97",1971,579.89
"98",1972,579.96
定义cff函数
def ccf(x, y, lag_max=100):
    import scipy.signal as sg
    result = sg.correlate(y - np.mean(y), x - np.mean(x), method='direct') / (np.std(y) * np.std(x) * len(x))
    print(result)
    length = int((len(result) - 1) / 2)
    low = length - lag_max
    high = length + (lag_max + 1)
    return result[low:high]
主程序
  import pandas as pd
  airmiles = pd.read_csv('data/Airline.csv', index_col=0)
  lakehuron = pd.read_csv('data/LakeHuron.csv', index_col=0)
  print(airmiles, lakehuron)
  lhdata = lakehuron.query("1937<=time<=1960")
  print('lhdata: \n', lhdata)

  x, y = airmiles.cost, lhdata.value

  out = ccf(x, y)
  for i in range(len(out)):
      plt.plot([i, i], [0, out[i]], 'k-')
      plt.plot(i, out[i], 'ko')
  plt.xlabel('lag', fontsize=14)
  plt.xticks(range(41), range(-10, 31, 1))
  plt.ylabel('cff', fontsize=14)
  plt.show()
相关系数:
[ 1.78514145e-03  5.92478798e-03  1.07711431e-02  1.62375213e-02
  2.35968067e-02  3.15228859e-02  3.72504754e-02  4.01446767e-02
  4.15659730e-02  4.14522639e-02  3.95607208e-02  3.65886233e-02
  3.43924642e-02  3.40786661e-02  3.34771847e-02  2.13545194e-02
  1.08781073e-02  1.37924353e-03 -1.23951224e-02 -2.60706526e-02
 -3.15678025e-02 -2.76053541e-02 -2.22309106e-02 -1.42409766e-02
 -6.88516151e-03 -8.77237939e-05  4.41299368e-03  1.61837117e-03
 -1.44623257e-03  2.93227138e-03 -9.09069824e-03 -1.07912110e-02
 -9.17867659e-03 -1.65786592e-02 -3.06394910e-02 -3.21292275e-02
 -2.46986825e-02 -2.58258455e-02 -1.39540595e-02 -5.12455438e-03
  3.61885614e-03  8.18961198e-03 -1.36093966e-03 -7.34720817e-03
  5.40984674e-03  1.37862342e-02  2.36918259e-02  3.23408573e-02
  2.67739290e-02  5.80319092e-03 -1.04151900e-02 -2.46682806e-02
 -4.15288769e-02 -2.92077906e-02 -1.88467386e-02 -5.74407471e-03
  4.22121761e-03  8.05875056e-05 -6.07171743e-03  2.21379437e-03
 -4.15210624e-02 -5.52956772e-02 -5.70528738e-02 -8.40669073e-02
 -1.24176191e-01 -1.23609410e-01 -9.15715344e-02 -8.36522415e-02
 -4.85569423e-02 -1.80509939e-02  1.16717406e-02  2.84501489e-02
  2.75126738e-03 -1.69804285e-02  1.95958583e-02  2.46379553e-02
  5.13412159e-02  7.74494465e-02  6.13194003e-02 -1.95774331e-03
 -3.82584311e-02 -6.36872665e-02 -1.15718388e-01 -8.11512076e-02
 -5.29467432e-02 -1.55029292e-02  8.13337443e-03 -1.47351742e-02
 -3.35766058e-02  4.80996133e-03  7.72490808e-02  1.26265288e-01
  1.62023469e-01  1.90127394e-01  1.82039714e-01  1.43368414e-01
  6.60608938e-02 -9.82960999e-03 -7.53935963e-03 -2.02840960e-02
 -2.83214760e-02 -2.89375092e-02 -2.24663341e-02 -1.90200474e-02
 -1.86750669e-02 -1.67850052e-02 -1.43932769e-02 -1.08643424e-02
 -6.23774854e-03 -2.48892458e-03 -8.53106509e-04  8.25399081e-05
  6.45593989e-05]
3 典型相关性分析
import pandas as pd
    import numpy as np
    from sklearn import datasets

    iris = datasets.load_iris()
    iris_data = pd.DataFrame(iris.data, columns=iris.feature_names)
    print(iris_data)

    # 计算相关系数
    iris_corr = iris_data.corr()
    print(iris_corr)

    # 将系数矩阵进行分组
    iris_corr_11 = iris_corr.iloc[0:2, 0:2]
    iris_corr_12 = iris_corr.iloc[0:2, 2:4]
    iris_corr_21 = iris_corr.iloc[2:4, 0:2]
    iris_corr_22 = iris_corr.iloc[2:4, 2:4]

    # 按照公式求解矩阵A B
    A = np.matmul(np.matmul(np.matmul(np.linalg.inv(iris_corr_11), iris_corr_12), np.linalg.inv(iris_corr_22)),
                  iris_corr_21)
    B = np.matmul(np.matmul(np.matmul(np.linalg.inv(iris_corr_22), iris_corr_21), np.linalg.inv(iris_corr_11)),
                  iris_corr_12)

    A_eig_values, A_eig_vectors = np.linalg.eig(A)
    B_eig_values, B_eig_vectors = np.linalg.eig(B)

    result = np.sqrt(A_eig_values)
    print("result: \t", result)

    # 验证
    a = round(A - np.matmul(np.matmul(A_eig_vectors, np.diag(A_eig_values)), np.linalg.inv(A_eig_vectors)), 5)
    b = round(B - np.matmul(np.matmul(B_eig_vectors, np.diag(B_eig_values)), np.linalg.inv(B_eig_vectors)), 5)
    print(a)
    print(b)

    # 验证典型变量的标准差是否为1

    iris_g1 = iris_data.iloc[:, 0:2]
    iris_g1 = iris_g1.apply(lambda x: (x - np.mean(x)) / np.std(x))
    iris_g2 = iris_data.iloc[:, 2:4]
    iris_g2 = iris_g2.apply(lambda x: (x - np.mean(x)) / np.std(x))

    # 求解A对应的特征变量并计算典型变量C1
    C1 = np.matmul(iris_g1, A_eig_vectors)
    print(C1.apply(np.std))
    print(C1.apply(np.mean))
    # 均值为0 标准差不为1 对特征向量进行伸缩变换
    eA=np.matmul(A_eig_vectors, np.diag(1/C1.apply(np.std)))
    C1=np.matmul(iris_g1,eA)
    print(C1.apply(np.std))
    print(C1.apply(np.mean))

    # 计算B

    C2= np.matmul(iris_g2, B_eig_vectors)
    print(C2.apply(np.std))
    print(C2.apply(np.mean))
    # 均值为0 标准差不为1 对特征向量进行伸缩变换
    eB=np.matmul(B_eig_vectors, np.diag(1/C2.apply(np.std)))
    C2=np.matmul(iris_g2,eB)
    print(C2.apply(np.std))
    print(C2.apply(np.mean))

    # 对C1 C2 的相关性进行验证
    print(round(pd.concat([C1, C2], axis=1).corr(),5))

    # 求解两组数据的典型的相关数据
    from sklearn.cross_decomposition import CCA
    cca=CCA(n_components=2)
    cca.fit(iris_g1, iris_g2)

    X_c, Y_c=cca.transform(iris_g1, iris_g2)
    result =round(pd.concat([pd.DataFrame(X_c,columns=iris_g1.columns), pd.DataFrame(Y_c,columns=iris_g2.columns)], axis=1).corr(),5)

    print(result)
输出结果:
     sepal length (cm)  sepal width (cm)  petal length (cm)  petal width (cm)
0                  5.1               3.5                1.4               0.2
1                  4.9               3.0                1.4               0.2
2                  4.7               3.2                1.3               0.2
3                  4.6               3.1                1.5               0.2
4                  5.0               3.6                1.4               0.2
..                 ...               ...                ...               ...
145                6.7               3.0                5.2               2.3
146                6.3               2.5                5.0               1.9
147                6.5               3.0                5.2               2.0
148                6.2               3.4                5.4               2.3
149                5.9               3.0                5.1               1.8

[150 rows x 4 columns]
                   sepal length (cm)  ...  petal width (cm)
sepal length (cm)           1.000000  ...          0.817941
sepal width (cm)           -0.117570  ...         -0.366126
petal length (cm)           0.871754  ...          0.962865
petal width (cm)            0.817941  ...          1.000000

[4 rows x 4 columns
result: 	 [0.940969   0.12393688]

     0    1
0  0.0 -0.0
1 -0.0  0.0
     0    1
0 -0.0 -0.0
1 -0.0  0.0

0    1.041196
1    0.951045
dtype: float64

0   -1.421085e-16
1   -9.118632e-16
dtype: float64

0    1.0
1    1.0
dtype: float64
0   -9.473903e-17
1   -9.592327e-16
dtype: float64

0    0.629124
1    0.200353
dtype: float64
0   -1.894781e-16
1   -7.993606e-17
dtype: float64

0    1.0
1    1.0
dtype: float64
0   -2.368476e-16
1   -3.552714e-16
dtype: float64

         0        1        0        1
0  1.00000  0.00000  0.94097  0.00000
1  0.00000  1.00000  0.00000  0.12394
0  0.94097  0.00000  1.00000  0.00000
1  0.00000  0.12394  0.00000  1.00000

                   sepal length (cm)  ...  petal width (cm)
sepal length (cm)            1.00000  ...          -0.00000
sepal width (cm)             0.00000  ...           0.12394
petal length (cm)            0.94097  ...          -0.00000
petal width (cm)            -0.00000  ...           1.00000

[4 rows x 4 columns]

Process finished with exit code 0
分析结果发现,典型的两个相关关系分别是0.94097 和 0.12394, 说明第一组典型的变量的相关性很强,后一组相关性较弱,通常选择第一相关系数用于分析


