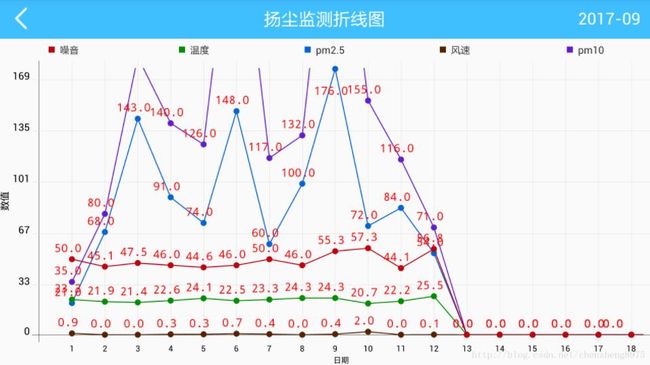
本文实例为大家分享了Android图表库HelloChart绘制多折线图的具体代码,供大家参考,具体内容如下
一、效果图
二、实现步骤
1.添加依赖库
compile 'com.github.lecho:hellocharts-android:v1.5.8'
2.布局文件
3.Activity类
package com.aldx.hccraftsman.activity;

import android.content.Context;
import android.content.Intent;
import android.graphics.Color;
import android.graphics.Matrix;
import android.graphics.Typeface;
import android.os.Bundle;
import android.view.View;
import android.view.Window;
import android.view.WindowManager;
import android.widget.ImageView;
import android.widget.LinearLayout;
import android.widget.TextView;

import com.aldx.hccraftsman.R;
import com.aldx.hccraftsman.application.Application;
import com.aldx.hccraftsman.base.BaseActivity;
import com.aldx.hccraftsman.entity.DustLineChart;
import com.aldx.hccraftsman.entity.DustLineChartModel;
import com.aldx.hccraftsman.entity.TempChartData;
import com.aldx.hccraftsman.jsonparse.JSONObject;
import com.aldx.hccraftsman.jsonparse.ReflectUtil;
import com.aldx.hccraftsman.okHttp.LoadingDialogCallback;
import com.aldx.hccraftsman.utils.Api;
import com.aldx.hccraftsman.utils.Constants;
import com.aldx.hccraftsman.utils.LogUtil;
import com.aldx.hccraftsman.utils.Utils;
import com.lzy.okgo.OkGo;

import java.text.ParseException;
import java.util.ArrayList;
import java.util.Calendar;
import java.util.Date;
import java.util.List;

import butterknife.BindView;
import butterknife.ButterKnife;
import butterknife.OnClick;
import cn.qqtheme.framework.picker.DatePicker;
import cn.qqtheme.framework.picker.DateTimePicker;
import lecho.lib.hellocharts.gesture.ZoomType;
import lecho.lib.hellocharts.model.Axis;
import lecho.lib.hellocharts.model.AxisValue;
import lecho.lib.hellocharts.model.Line;
import lecho.lib.hellocharts.model.LineChartData;
import lecho.lib.hellocharts.model.PointValue;
import lecho.lib.hellocharts.model.ValueShape;
import lecho.lib.hellocharts.model.Viewport;
import lecho.lib.hellocharts.view.LineChartView;
import okhttp3.Call;
import okhttp3.Response;

/**
 * author: chenzheng
 * created on: 2017/9/29 10:18
 * description:
 */

public class DustLineChartActivity extends BaseActivity {

    @BindView(R.id.line_chart)
    LineChartView lineChart;
    @BindView(R.id.back_iv)
    ImageView backIv;
    @BindView(R.id.layout_back)
    LinearLayout layoutBack;
    @BindView(R.id.title_tv)
    TextView titleTv;
    @BindView(R.id.right_tv)
    TextView rightTv;
    @BindView(R.id.layout_right)
    LinearLayout layoutRight;

    private String projectId;
    private List colors = new ArrayList<>();
    private List listTemp = new ArrayList();//数据
    private List mAxisXValues = new ArrayList();   //x轴方向的坐标数据
    private List mAxisYValues = new ArrayList();            //y轴方向的坐标数据
    private List distanceList = new ArrayList();
    private boolean hasAxes = true;       //是否有轴,x和y轴
    private boolean hasAxesNames = true;   //是否有轴的名字
    private boolean hasLines = true;       //是否有线(点和点连接的线,选择false只会出现点)
    private boolean hasPoints = true;       //是否有点(每个值的点)
    private ValueShape shape = ValueShape.CIRCLE;    //点显示的形式,圆形,正方向,菱形
    private boolean isFilled = false;                //是否是填充
    private boolean hasLabels = true;               //每个点是否有名字
    private boolean isCubic = false;                 //是否是立方的,线条是直线还是弧线
    private boolean hasLabelForSelected = false;       //每个点是否可以选择(点击效果)
    private LineChartData data;          // 折线图封装的数据类

    @Override
    protected void onCreate(Bundle savedInstanceState) {
        super.onCreate(savedInstanceState);
        requestWindowFeature(Window.FEATURE_NO_TITLE);
        getWindow().setFlags(WindowManager.LayoutParams.FLAG_FULLSCREEN,
                WindowManager.LayoutParams.FLAG_FULLSCREEN);
        setContentView(R.layout.activity_dust_line_chart);
        projectId = getIntent().getStringExtra("projectId");
        ButterKnife.bind(this);

        initView();
        initData();
        doRequest();
    }

    private void initData() {
        //颜色集合
        colors.add(0xff0862D8);
        colors.add(0xff6221D1);
        colors.add(0xff552705);
        colors.add(0xff088B05);
        colors.add(0xffBF0815);
    }

    private void initView() {
        titleTv.setText("扬尘监测折线图");
        Calendar calendar1 = Calendar.getInstance();
        String sss = Utils.DATE_SIMPLE_FORMATER.format(calendar1.getTime());
        rightTv.setText(sss);
        layoutRight.setVisibility(View.VISIBLE);

    }

    public void doRequest() {
        OkGo.get(Api.GET_MONITOR_MONTH_BY_PROJECT_ID)
                .tag(this)
                .params("projectId", projectId)
                .params("time", rightTv.getText().toString())
                .execute(new LoadingDialogCallback(this, Constants.LOADING_TXT) {

                    @Override
                    public void onSuccess(String s, Call call, Response response) {
                        DustLineChartModel dustLineChartModel = null;
                        try {
                            dustLineChartModel = (DustLineChartModel) ReflectUtil
                                    .copy(DustLineChartModel.class,
                                            new JSONObject(s));
                        } catch (Exception e) {
                            e.printStackTrace();
                        }
                        if (dustLineChartModel != null) {
                            if (dustLineChartModel.code == Api.SUCCESS_CODE) {
                                if (dustLineChartModel.data != null) {
                                    setLineChartData(dustLineChartModel.data);
                                }
                            } else {
                                Application.showCodeToast(DustLineChartActivity.this, dustLineChartModel.code);
                            }
                        }

                    }

                    @Override
                    public void onError(Call call, Response response, Exception e) {
                        super.onError(call, response, e);
                        Application.showResultToast(DustLineChartActivity.this, call, e);
                    }

                });
    }

    private void setLineChartData(List dlcList) {
        listTemp.clear();
        mAxisXValues.clear();
        mAxisYValues.clear();
        distanceList.clear();
        float yMax = 0;
        try {
            int xCount = 0;
            Calendar curCalendar = Calendar.getInstance();
            String curDateStr = Utils.DATE_SIMPLE_FORMATER.format(curCalendar.getTime());
            if (rightTv.getText().toString().equals(curDateStr)) {
                xCount = curCalendar.get(Calendar.DAY_OF_MONTH);
            } else {
                Date queryDate = Utils.DATE_FORMATER.parse(rightTv.getText().toString() + "-01");
                Calendar queryCalendar = Calendar.getInstance();
                queryCalendar.setTime(queryDate);
                xCount = queryCalendar.getActualMaximum(Calendar.DAY_OF_MONTH);
            }
            LogUtil.e("xCount=" + xCount);
            for (int j = 1; j <= xCount; j++) {
                boolean isFinded = false;
                for (DustLineChart dlc : dlcList) {
                    String tempStr = dlc.time;
                    if (!Utils.isEmpty(tempStr)) {
                        Date tempDate = Utils.DATE_FORMATER.parse(tempStr);
                        Calendar tempCalendar = Calendar.getInstance();
                        tempCalendar.setTime(tempDate);
                        if (j == (tempCalendar.get(Calendar.DAY_OF_MONTH))) {
                            isFinded = true;
                            if (Utils.toFloat(dlc.pm2) > yMax) {
                                yMax = Utils.toFloat(dlc.pm2);
                            }
                            if (Utils.toFloat(dlc.pm10) > yMax) {
                                yMax = Utils.toFloat(dlc.pm10);
                            }
                            if (Utils.toFloat(dlc.windspeed) > yMax) {
                                yMax = Utils.toFloat(dlc.windspeed);
                            }
                            if (Utils.toFloat(dlc.temperature) > yMax) {
                                yMax = Utils.toFloat(dlc.temperature);
                            }
                            if (Utils.toFloat(dlc.noise) > yMax) {
                                yMax = Utils.toFloat(dlc.noise);
                            }
                            listTemp.add(new TempChartData(j + "", Utils.toFloat(dlc.pm2), Utils.toFloat(dlc.pm10),
                                    Utils.toFloat(dlc.windspeed), Utils.toFloat(dlc.temperature), Utils.toFloat(dlc.noise)));
                            break;
                        }
                    }
                }
                if (!isFinded) {
                    listTemp.add(new TempChartData(j + "", 0.0f, 0.0f, 0.0f, 0.0f, 0.0f));
                }
            }

            //设置x轴坐标 ,显示的是时间5-1,5-2.。。。
            mAxisXValues.clear();
            for (int i = 1; i <= xCount; i++) {      //mClockNumberLength
                mAxisXValues.add(new AxisValue(i).setLabel(i + ""));
            }

            mAxisYValues.clear();
            float temp = (yMax + 10) / 10;
            for (int k = 0; k < 10; k++) {
                float ttt = temp * k;
                float fff = Utils.toFloat(((int)ttt)+"");
                mAxisYValues.add(new AxisValue(fff).setLabel("" + (int)fff));

            }

            //获取距离
            for (int i = 1; i <= listTemp.size(); i++) {
                float apart = i;//得到的拒Y轴的距离
                distanceList.add(apart);
            }
            //存放线条对象的集合
            List lines = new ArrayList();
            lines.clear();
            //把数据设置到线条上面去
            for (int i = 0; i < 5; ++i) {
                List values = new ArrayList();
                for (int j = 0; j < listTemp.size(); ++j) {
                    //i=0是最高温度的线,i=1,是最低温度的线
                    //PointValue的两个参数值,一个是距离y轴的长度距离,另一个是距离x轴长度距离
                    if (i == 0) {
                        values.add(new PointValue(distanceList.get(j), listTemp.get(j).pm2).setLabel("" + listTemp.get(j).pm2));
                    } else if (i == 1) {
                        values.add(new PointValue(distanceList.get(j), listTemp.get(j).pm10).setLabel("" + listTemp.get(j).pm10));
                    } else if (i == 2) {
                        values.add(new PointValue(distanceList.get(j), listTemp.get(j).windspeed).setLabel("" + listTemp.get(j).windspeed));
                    } else if (i == 3) {
                        values.add(new PointValue(distanceList.get(j), listTemp.get(j).temperature).setLabel("" + listTemp.get(j).temperature));
                    } else if (i == 4) {
                        values.add(new PointValue(distanceList.get(j), listTemp.get(j).noise).setLabel("" + listTemp.get(j).noise));
                    }

                }

                Line line = new Line(values);
                //设置线条的基本属性
                line.setColor(colors.get(i));
                line.setShape(shape);
                line.setCubic(isCubic);
                line.setFilled(isFilled);
                line.setHasLabels(hasLabels);
                line.setHasLabelsOnlyForSelected(hasLabelForSelected);
                line.setHasLines(hasLines);
                line.setHasPoints(hasPoints);
                line.setStrokeWidth(1);
                line.setPointRadius(3);
                lines.add(line);
            }

            data = new LineChartData(lines);

            if (hasAxes) {
                Axis axisX = new Axis();
                Axis axisY = new Axis().setHasLines(true);
                if (hasAxesNames) {
                    axisX.setName("日期");
                    axisY.setName("数值");
                }

                //对x轴,数据和属性的设置
                axisX.setTextSize(8);//设置字体的大小
                axisX.setHasTiltedLabels(false);//x坐标轴字体是斜的显示还是直的,true表示斜的
                axisX.setTextColor(Color.BLACK);//设置字体颜色
                axisX.setHasLines(true);//x轴的分割线
                axisX.setValues(mAxisXValues); //设置x轴各个坐标点名称

                //对Y轴 ,数据和属性的设置
                axisY.setTextSize(10);
                axisY.setHasTiltedLabels(false);//true表示斜的
                axisY.setTextColor(Color.BLACK);//设置字体颜色
                axisY.setValues(mAxisYValues); //设置x轴各个坐标点名称


                data.setAxisXBottom(axisX);//x轴坐标线的文字,显示在x轴下方
//            data.setAxisXTop();      //显示在x轴上方
                data.setAxisYLeft(axisY);   //显示在y轴的左边

            } else {
                data.setAxisXBottom(null);
                data.setAxisYLeft(null);
            }

            data.setBaseValue(2f); //设置反向覆盖区域颜色  ??
            data.setValueLabelBackgroundAuto(false);//设置数据背景是否跟随节点颜色
            data.setValueLabelBackgroundColor(Color.BLUE);//设置数据背景颜色
            data.setValueLabelBackgroundEnabled(false);//设置是否有数据背景
            data.setValueLabelsTextColor(Color.RED);//设置数据文字颜色
            data.setValueLabelTextSize(11);//设置数据文字大小
            data.setValueLabelTypeface(Typeface.MONOSPACE);//设置数据文字样式
            lineChart.setLineChartData(data);     //将数据添加到控件中
            lineChart.setViewportCalculationEnabled(false);

            lineChart.setZoomType(ZoomType.HORIZONTAL_AND_VERTICAL);//设置线条可以水平方向收缩
            final Viewport v = new Viewport(lineChart.getMaximumViewport());
            v.bottom = 0;
            v.top = yMax+10;
            v.left = 0;
            v.right = listTemp.size(); //  listBlood.size() - 1//如何解释
            lineChart.setMaximumViewport(v);
            lineChart.setCurrentViewport(v);

        } catch (Exception e) {
            e.printStackTrace();
        }

    }

    public static void startActivity(Context context, String projectId) {
        Intent intent = new Intent(context, DustLineChartActivity.class);
        intent.putExtra("projectId", projectId);
        context.startActivity(intent);
    }

    @OnClick({R.id.layout_back, R.id.layout_right})
    public void onViewClicked(View view) {
        switch (view.getId()) {
            case R.id.layout_back:
                finish();
                break;
            case R.id.layout_right:
                chooseDate();
                break;
        }
    }

    private void chooseDate() {
        Calendar cal = Calendar.getInstance();
        try {
            cal.setTime(Utils.DATE_FORMATER.parse(rightTv.getText().toString()+"-01"));
        } catch (ParseException e) {
            e.printStackTrace();
        }
        Calendar curCal = Calendar.getInstance();
        int curMonth = cal.get(Calendar.MONTH) + 1;
        int curYear = cal.get(Calendar.YEAR);
        final DatePicker picker = new DatePicker(this, DateTimePicker.YEAR_MONTH);
        picker.setRangeEnd(curCal.get(Calendar.YEAR), curCal.get(Calendar.MONTH) + 1);
        picker.setRangeStart(2010, 1);
        picker.setUseWeight(true);
        picker.setSelectedItem(curYear, curMonth);
        picker.setOnDatePickListener(new DatePicker.OnYearMonthPickListener() {
            @Override
            public void onDatePicked(String year, String month) {
                rightTv.setText(year + "-" + month);
                doRequest();
            }
        });
        picker.show();
    }
}
以上就是本文的全部内容,希望对大家的学习有所帮助,也希望大家多多支持脚本之家。
