看Y叔的公众号发现一个有意思的箱线图展示,赶紧来学习一下:https://mp.weixin.qq.com/s?__biz=MzI5NjUyNzkxMg==&mid=2247486539&idx=1&sn=97ff6a0d5fe2daa2151ebae218c92fe1&scene=21#wechat_redirect
barplot是我们从接触画图开始做的最多的图,但毕竟只有均值和标准误差信息量太低,万一有outliers呢?万一不是正态分布呢?Y叔呼吁大家使用boxplot,boxplot有四分位数的统计量,可以反应outlier和数据的分布,比barplot高得多了。
现在流行的不单单是画boxplot,有以下几种方式是显得比较专业的:
- boxplot + raw data
- violin plot + boxplot(这是我比较喜欢的类型)
- violin plot + raw data
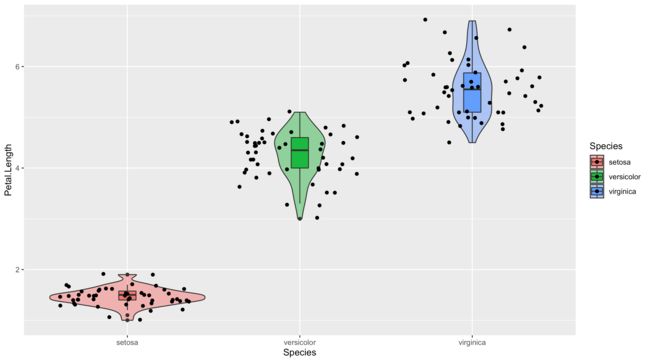
- violin plot + boxplot + raw data
就是原始数据+统计量(boxplot)+统计推断(violin plot, 概率密度)的组合。然而violin画出来是对称的,也就是说信息冗余,就有人提出来,能不能画一半的violin,但其实一半也挺丑的,但大家脑洞足够大,把violin往右移一点,它就像一朵云彩,而raw data就像是雨滴,于是乎云雨图(raincloud)应运而生,一下子俘获大家的芳心,包括我。
就这一个可视化方式,有人专门写文章介绍,并且还用主流语言实现了,https://peerj.com/preprints/27137v1/。
《ggridges:一种波涛汹涌,哦不对,是山峰叠峦的可视化方式》
那么要实现这个图,最大的问题在于需要一半的violin,这个David Robinson首先从ggplot2中的geom_violin图层修改得到,Y叔打了一个R包,叫gglayer,https://github.com/GuangchuangYu/gglayer, 顾名思义就是打包ggplot的图层的,还把他yyplot中的两个图层也给移过去。在下面2个链接中有体现:
130岁了,祝你生快
画个小圈圈
violin + boxplot + raw data
library(ggplot2)
ggplot(iris, aes(Species, Petal.Length, fill=Species))  +
  geom_violin(alpha=.5) +
  geom_boxplot(width=.1) +
  geom_jitter()
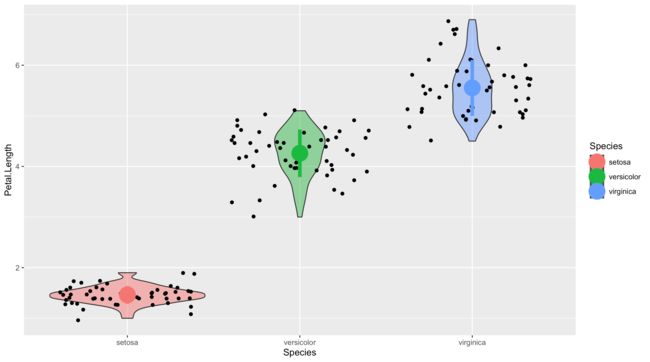
violin + mean+-sd + raw data
统计量不一定要用boxplot来展示四分位数,也可以用均值+-标准误差的方式,这样相当于你把barplot的信息也放进去了。当然统计量也不限于此,有合适的都可以放进去。无非是拼图层,这也是图形语法的灵活所在,封装失去了自由组合的灵活性。
library(dplyr)
d <- group_by(iris, Species) %>%
  summarize(mean = mean(Petal.Length),
            sd = sd(Petal.Length))
ggplot(iris, aes(Species, Petal.Length, fill=Species)) +
  geom_violin(alpha=.5) +
  geom_jitter() +
  geom_pointrange(aes(y = mean,ymin = mean-sd,
                      ymax = mean+sd, color = Species),
                  data=d,size=2)
云雨图1:加上均值和标准误差。
#devtools::install_github("GuangchuangYu/gglayer")
library(gglayer)
ggplot(iris, aes(Species, Petal.Length, fill=Species))  +
  geom_flat_violin(position=position_nudge(x=.2)) +
  geom_jitter(aes(color=Species), width=.15) +
  geom_pointrange(aes(y=mean, ymin=mean-sd, ymax=mean+sd),
                  data=d, size=1, position=position_nudge(x=.25)) +
  coord_flip() + theme_bw() +
  theme(legend.position="bottom")
> ggplot(iris, aes(Species, Petal.Length, fill=Species))  +
+   geom_flat_violin(position=position_nudge(x=.2)) +
+   geom_jitter(aes(color=Species), width=.15) +
+   geom_pointrange(aes(y=mean, ymin=mean-sd, ymax=mean+sd),
+                   data=d, size=1, position=position_nudge(x=.25)) +
+   coord_flip() + theme_bw() +
+   theme(legend.position="bottom")
Error in geom_flat_violin(position = position_nudge(x = 0.2)) :
  could not find function "geom_flat_violin"
出现了报错说不存在这个函数,不知道是函数被我写错了还是被Y叔更新了,反正我搜了一圈还是没找到gglayer包中的geom_flat_violin这个函数。
可能是搜索的范围不够广,因为网络问题有几个相关的网页是打不开的,先不管了,我发现了另一个云雨图的教程:
https://github.com/RainCloudPlots/RainCloudPlots
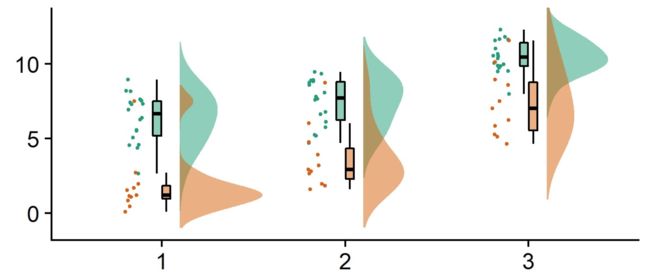
打开后第一幅图就惊艳了我:
非常的高级!教程里面讲到可以克隆这个项目到本地,支持Python和R,那就跟着教程学习吧。
Installing and running on your local machine
- Download from github (needed for all tutorials)
- Python environment
- R environment
- Matlab environment
先克隆这个项目到本地,解压缩,在R教程目录下新建一个Rproj.开始愉快的探索吧:
首先需要检查必要依赖包的安装
在R教程里面有全部的脚本首先看看第一个脚本R_rainclouds.R:
这个脚本主要是用来构建函数展示云雨图的如果是你自己的数据只需要前80行代码,这个代码在很大程度上嫁接自David Robinson(https://gist.github.com/dgrtwo/eb7750e74997891d7c20)和Hadley Wickham的ggplot2包。
Check if required packages are installed
packages <- c("cowplot", "readr", "ggplot2", "dplyr", "lavaan", "smooth", "Hmisc")
if (length(setdiff(packages, rownames(installed.packages()))) > 0) {
  install.packages(setdiff(packages, rownames(installed.packages())))
}
library(ggplot2)
# Defining the geom_flat_violin function ----
"%||%" <- function(a, b) {
  if (!is.null(a)) a else b
}
geom_flat_violin <- function(mapping = NULL, data = NULL, stat = "ydensity",
                             position = "dodge", trim = TRUE, scale = "area",
                             show.legend = NA, inherit.aes = TRUE, ...) {
  layer(
    data = data,
    mapping = mapping,
    stat = stat,
    geom = GeomFlatViolin,
    position = position,
    show.legend = show.legend,
    inherit.aes = inherit.aes,
    params = list(
      trim = trim,
      scale = scale,
      ...
    )
  )
}

#' @rdname ggplot2-ggproto
#' @format NULL
#' @usage NULL
#' @export
GeomFlatViolin <-
  ggproto("GeomFlatViolin", Geom,
    setup_data = function(data, params) {
      data$width <- data$width %||%
        params$width %||% (resolution(data$x, FALSE) * 0.9)

      # ymin, ymax, xmin, and xmax define the bounding rectangle for each group
      data %>%
        group_by(group) %>%
        mutate(
          ymin = min(y),
          ymax = max(y),
          xmin = x,
          xmax = x + width / 2
        )
    },
    draw_group = function(data, panel_scales, coord) {
      # Find the points for the line to go all the way around
      data <- transform(data,
        xminv = x,
        xmaxv = x + violinwidth * (xmax - x)
      )

      # Make sure it's sorted properly to draw the outline
      newdata <- rbind(
        plyr::arrange(transform(data, x = xminv), y),
        plyr::arrange(transform(data, x = xmaxv), -y)
      )

      # Close the polygon: set first and last point the same
      # Needed for coord_polar and such
      newdata <- rbind(newdata, newdata[1, ])
      ggplot2:::ggname("geom_flat_violin", GeomPolygon$draw_panel(newdata, panel_scales, coord))
    },
    draw_key = draw_key_polygon,
    default_aes = aes(
      weight = 1, colour = "grey20", fill = "white", size = 0.5,
      alpha = NA, linetype = "solid"
    ),
    required_aes = c("x", "y")
  )
另外2个重要的脚本一个是simulateData.R:
# Simulate data ----

m <- 50 # mean
s <- 25 # sd
n <- 250 # drawsx

# Calculate log-normal parameters ----

location <- log(m^2 / sqrt(s^2 + m^2))
shape <- sqrt(log(1 + (s^2 / m^2)))

# Set seed to get same data everytime ----
set.seed(123)

# Create data by hand ----

simdat_group1 <- rlnorm(n, location, shape)
simdat_group2 <- rnorm(n, m, s)

simdat <- c(simdat_group1, simdat_group2)
simdat <- data.frame(c(rep("Group1", times = n),
                       rep("Group2", times = n)), simdat)
colnames(simdat) <- c("group", "score")

# Calculate summary stats ----
summary_simdat <- summarySE(simdat, measurevar = "score",
                                     groupvars = c("group"))
另一个summarySE.R:
# summarySE function
summarySE <- function(data = NULL, measurevar, groupvars = NULL, na.rm = FALSE,
                      conf.interval = .95, .drop = TRUE) {
  library(plyr)

  # New version of length which can handle NA's: if na.rm==T, don't count them
  length2 <- function(x, na.rm = FALSE) {
    if (na.rm) {
      sum(!is.na(x))
    } else {
      length(x)
    }
  }

  # This does the summary. For each group's data frame, return a vector with
  # N, mean, median, and sd

  datac <- plyr::ddply(data, groupvars, .drop=.drop,
                   .fun = function(xx, col) {
                       c(N      = length2(xx[[col]], na.rm=na.rm),
                         mean   = mean(xx[[col]], na.rm=na.rm),
                         median = median(xx[[col]], na.rm=na.rm),
                         sd      = sd(xx[[col]], na.rm=na.rm)
                       )
                   },
                   measurevar
  )

  # Rename the "mean" and "median" columns
 datac <- plyr::rename(datac, c("mean" = paste(measurevar, "_mean", sep = "")))
 datac <- plyr::rename(datac, c("median" = paste(measurevar, "_median", sep = "")))

 datac$se <- datac$sd / sqrt(datac$N)  # Calculate standard error of the mean

  # Confidence interval multiplier for standard error
  # Calculate t-statistic for confidence interval:
  # e.g., if conf.interval is .95, use .975 (above/below), and use df=N-1
  ciMult <- qt(conf.interval / 2 + .5, datac$N - 1)
  datac$ci <- datac$se * ciMult

  return(datac)
}
有了这些之后就直接开始rmd文件的探索:
第一步检查安装包,定义图片保存的路径和大小:
library(cowplot)
library(dplyr)
library(readr)

source("R_rainclouds.R")
source("summarySE.R")
source("simulateData.R")

# width and height variables for saved plots
w = 6
h = 3
# Make the figure folder if it doesn't exist yet
dir.create('../figs/tutorial_R/', showWarnings = FALSE)

head(summary_simdat)
结果显示:
##    group   N score_mean score_median       sd       se       ci
## 1 Group1 250   49.45877     42.74587 25.27975 1.598832 3.148958
## 2 Group2 250   51.94353     52.69956 25.06328 1.585141 3.121994
该函数给出了两组N=250的观测值;两者的均值和方差(SDs)都相似,但第一组是从指数分布中提取的。现在,我们将为模拟日期绘制一个基本的条形图。请注意,我们使用的是“cowplot”主题来制作简单、整洁的曲线图
- 您应该根据需要设置您自己的主题或其他自定义选项:
#Barplot
p1 <- ggplot(summary_simdat, aes(x = group, y = score_mean, fill = group))+
  geom_bar(stat = "identity", width = .8)+
  geom_errorbar(aes(ymin = score_mean - se, ymax = score_mean+se), width = .2)+
  guides(fill=FALSE)+
  ylim(0, 80)+
  ylab('Score')+xlab('Group')+theme_cowplot()+
  ggtitle("Figure 1: Barplot +/- SEM")

ggsave('../figs/tutorial_R/1Barplot.png', width = w, height = h)
ps:如果您在
grid.newpage()中看到错误:无法打开文件...。运行本教程时:不用担心!binder中的RStudio只是比您希望以内联方式将情节呈现给您的速度稍慢一些。等待几秒钟,然后再次运行该部分代码,图像将会出现。
using the ‘geom_flat_violin’ option our function already setup for us:
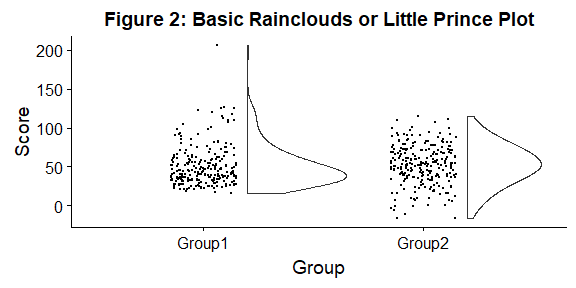
#Basic plot
p2 <- ggplot(simdat,aes(x=group,y=score))+
  geom_flat_violin(position = position_nudge(x = .2, y = 0),adjust =2)+
  geom_point(position = position_jitter(width = .15), size = .25)+
  ylab('Score')+xlab('Group')+theme_cowplot()+
  ggtitle('Figure 2: Basic Rainclouds or Little Prince Plot')

ggsave('../figs/tutorial_R/2basic.png', width = w, height = h)
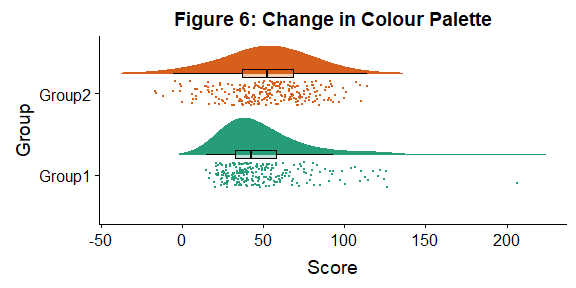
原始的云雨图出现了,翻转坐标,添加颜色映射:
#Plot with colours and coordinate flip
p3 <- ggplot(simdat,aes(x=group,y=score, fill = group))+
  geom_flat_violin(position = position_nudge(x = .2, y = 0),adjust = 2)+
  geom_point(position = position_jitter(width = .15), size = .25)+
  ylab('Score')+xlab('Group')+coord_flip()+theme_cowplot()+guides(fill = FALSE)+
  ggtitle('Figure 3: The Basic Raincloud with Colour')

ggsave('../figs/tutorial_R/3pretty.png', width = w, height = h)
再变下参数:
#Raincloud with reduced smoothing
p4 <- ggplot(simdat,aes(x=group,y=score, fill = group))+
  geom_flat_violin(position = position_nudge(x = .2, y = 0),adjust = .2)+
  geom_point(position = position_jitter(width = .15), size = .25)+
  ylab('Score')+xlab('Group')+coord_flip()+theme_cowplot()+guides(fill = FALSE) +
  ggtitle('Figure 4: Unsmooth Rainclouds')

ggsave('../figs/tutorial_R/4unsmooth.png', width = w, height = h)
加上箱线图:
#Rainclouds with boxplots
p5 <- ggplot(simdat,aes(x=group,y=score, fill = group))+
  geom_flat_violin(position = position_nudge(x = .25, y = 0),adjust =2)+
  geom_point(position = position_jitter(width = .15), size = .25)+
#note that here we need to set the x-variable to a numeric variable and bump it to get the boxplots to line up with the rainclouds.
  geom_boxplot(aes(x = as.numeric(group)+0.25, y = score),outlier.shape = NA, alpha = 0.3, width = .1, colour = "BLACK") +
  ylab('Score')+xlab('Group')+coord_flip()+theme_cowplot()+guides(fill = FALSE, colour = FALSE) +
  ggtitle("Figure 5: Raincloud Plot w/Boxplots")

ggsave('../figs/tutorial_R/5boxplots.png', width = w, height = h)
再变漂亮点:
#Rainclouds with boxplots
p6 <- ggplot(simdat,aes(x=group,y=score, fill = group, colour = group))+
  geom_flat_violin(position = position_nudge(x = .25, y = 0),adjust =2, trim = FALSE)+
  geom_point(position = position_jitter(width = .15), size = .25)+
  geom_boxplot(aes(x = as.numeric(group)+0.25, y = score),outlier.shape = NA, alpha = 0.3, width = .1, colour = "BLACK") +
  ylab('Score')+xlab('Group')+coord_flip()+theme_cowplot()+guides(fill = FALSE, colour = FALSE) +
  scale_colour_brewer(palette = "Dark2")+
  scale_fill_brewer(palette = "Dark2")+
  ggtitle("Figure 6: Change in Colour Palette")

ggsave('../figs/tutorial_R/6boxplots.png', width = w, height = h)
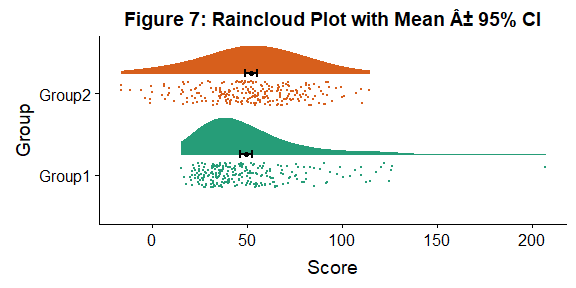
加上置信区间:
#Rainclouds with mean and confidence interval
p7 <- ggplot(simdat,aes(x=group,y=score, fill = group, colour = group))+
  geom_flat_violin(position = position_nudge(x = .25, y = 0),adjust =2)+
  geom_point(position = position_jitter(width = .15), size = .25)+
  geom_point(data = summary_simdat, aes(x = group, y = score_mean), position = position_nudge(.25), colour = "BLACK")+
  geom_errorbar(data = summary_simdat, aes(x = group, y = score_mean, ymin = score_mean-ci, ymax = score_mean+ci), position = position_nudge(.25), colour = "BLACK", width = 0.1, size = 0.8)+
  ylab('Score')+xlab('Group')+coord_flip()+theme_cowplot()+guides(fill = FALSE, colour = FALSE) +
  scale_colour_brewer(palette = "Dark2")+
  scale_fill_brewer(palette = "Dark2")+
  ggtitle("Figure 7: Raincloud Plot with Mean ± 95% CI")

ggsave('../figs/tutorial_R/7meanplot.png', width = w, height = h)
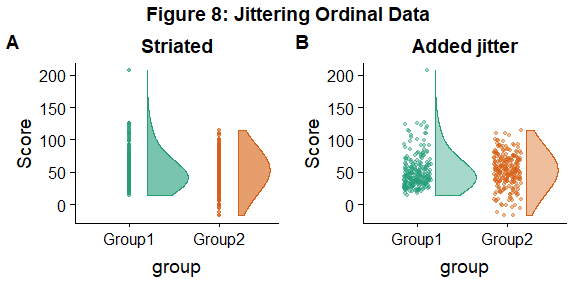
如果您的数据是离散的或有序的,则可能需要手动添加一些抖动以改进绘图:
#Rainclouds with striated data

#Round data
simdat_round<-simdat
simdat_round$score<-round(simdat$score,0)

#Striated/grouped when no jitter applied
ap1 <- ggplot(simdat_round,aes(x=group,y=score,fill=group,col=group))+
    geom_flat_violin(position = position_nudge(x = .2, y = 0), alpha = .6,adjust =4)+
    geom_point(size = 1, alpha = 0.6)+ylab('Score')+
    scale_fill_brewer(palette = "Dark2")+
    scale_colour_brewer(palette = "Dark2")+
    guides(fill = FALSE, col = FALSE)+
    ggtitle('Striated')

#Added jitter helps
ap2 <- ggplot(simdat_round,aes(x=group,y=score,fill=group,col=group))+
    geom_flat_violin(position = position_nudge(x = .2, y = 0), alpha = .4,adjust =4)+
    geom_point(position=position_jitter(width = .15),size = 1, alpha = 0.4)+ylab('Score')+
    scale_fill_brewer(palette = "Dark2")+
    scale_colour_brewer(palette = "Dark2")+
    guides(fill = FALSE, col = FALSE)+
    ggtitle('Added jitter')

all_plot <- plot_grid(ap1, ap2, labels="AUTO")

# add title to cowplot
title <- ggdraw() +
  draw_label("Figure 8: Jittering Ordinal Data",
             fontface = 'bold')

all_plot_final <- plot_grid(title, all_plot, ncol = 1, rel_heights = c(0.1, 1)) # rel_heights values control title margins

ggsave('../figs/tutorial_R/8allplot.png', width = w, height = h)
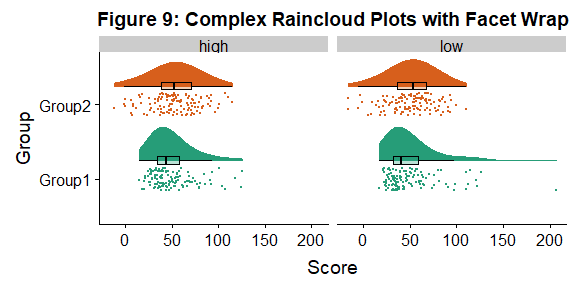
最后,在许多情况下,您可能具有嵌套的、阶乘的或重复的度量数据。在这种情况下,一种选择是使用绘图面按因素分组,强调条件或因素级别之间的成对差异:
#Add additional factor/condition
simdat$gr2<-as.factor(c(rep('high',125),rep('low',125),rep('high',125),rep('low',125)))


p9 <- ggplot(simdat,aes(x=group,y=score, fill = group, colour = group))+
  geom_flat_violin(position = position_nudge(x = .25, y = 0),adjust =2, trim = TRUE)+
  geom_point(position = position_jitter(width = .15), size = .25)+
  geom_boxplot(aes(x = as.numeric(group)+0.25, y = score),outlier.shape = NA, alpha = 0.3, width = .1, colour = "BLACK") +
  ylab('Score')+xlab('Group')+coord_flip()+theme_cowplot()+guides(fill = FALSE, colour = FALSE) + facet_wrap(~gr2)+
  scale_colour_brewer(palette = "Dark2")+
  scale_fill_brewer(palette = "Dark2")+
  ggtitle("Figure 9: Complex Raincloud Plots with Facet Wrap")

ggsave('../figs/tutorial_R/9facetplot.png', width = w, height = h)
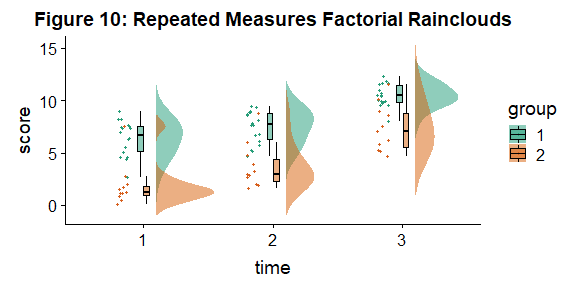
作为另一个例子,我们考虑了析因设计中的一些模拟重复测量数据,其中两组在三个时间点上进行测量。为此,我们将首先加载一些新数据:
#load the repeated measures facotiral data
rep_data <- read_csv("repeated_measures_data.csv",
    col_types = cols(group = col_factor(levels = c("1",
        "2")), time = col_factor(levels = c("1",
        "2", "3"))))

sumrepdat <- summarySE(rep_data, measurevar = "score", groupvars=c("group", "time"))
head(sumrepdat)
结果如下:
##   group time  N score_mean score_median       sd        se        ci
## 1     1    1 18   6.362222        6.670 1.658861 0.3909972 0.8249319
## 2     1    2 18   7.468333        7.730 1.546880 0.3646032 0.7692454
## 3     1    3 18  10.482778       10.455 1.060254 0.2499043 0.5272520
## 4     2    1 11   1.847273        1.210 2.010279 0.6061219 1.3505238
## 5     2    2 11   3.684545        2.920 2.135108 0.6437594 1.4343852
## 6     2    3 11   7.358182        7.020 2.236273 0.6742616 1.5023486
现在,我们将再次使用boxplots来绘制云雨图,这一次添加了一些dodge,这样我们可以更好地强调我们的因子和因子水平之间的差异。请注意,此处我们需要将点x轴作为数值进行微调,因为此变通方法目前不适用于具有多个因子的boxplots:
# Rainclouds for repeated measures, continued
p10 <- ggplot(rep_data, aes(x = time, y = score, fill = group)) +
  geom_flat_violin(aes(fill = group),position = position_nudge(x = .1, y = 0), adjust = 1.5, trim = FALSE, alpha = .5, colour = NA)+
  geom_point(aes(x = as.numeric(time)-.15, y = score, colour = group),position = position_jitter(width = .05), size = 1, shape = 20)+
  geom_boxplot(aes(x = time, y = score, fill = group),outlier.shape = NA, alpha = .5, width = .1, colour = "black")+
  scale_colour_brewer(palette = "Dark2")+
  scale_fill_brewer(palette = "Dark2")+
  ggtitle("Figure 10: Repeated Measures Factorial Rainclouds")

ggsave('../figs/tutorial_R/10repanvplot.png', width = w, height = h)
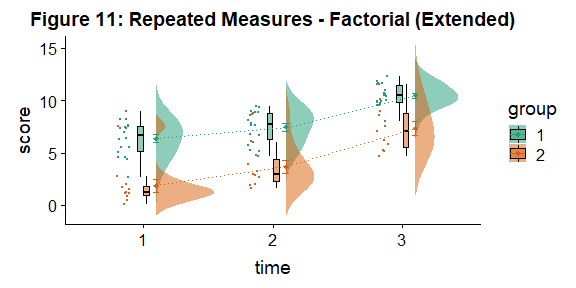
最后,您可能想要添加传统的线状图,以强调阶乘交互和主效果。在这里,我们绘制了设计中每个单元格的平均误差和标准误差,并用一条散列线将它们连接起来。不过,有很多可能的选择,所以您需要决定哪种最适合您的需求:
#Rainclouds for repeated measures, additional plotting options

p11 <- ggplot(rep_data, aes(x = time, y = score, fill = group)) +
  geom_flat_violin(aes(fill = group),position = position_nudge(x = .1, y = 0), adjust = 1.5, trim = FALSE, alpha = .5, colour = NA)+
  geom_point(aes(x = as.numeric(time)-.15, y = score, colour = group),position = position_jitter(width = .05), size = .25, shape = 20)+
  geom_boxplot(aes(x = time, y = score, fill = group),outlier.shape = NA, alpha = .5, width = .1, colour = "black")+
  geom_line(data = sumrepdat, aes(x = as.numeric(time)+.1, y = score_mean, group = group, colour = group), linetype = 3)+
  geom_point(data = sumrepdat, aes(x = as.numeric(time)+.1, y = score_mean, group = group, colour = group), shape = 18) +
  geom_errorbar(data = sumrepdat, aes(x = as.numeric(time)+.1, y = score_mean, group = group, colour = group, ymin = score_mean-se, ymax = score_mean+se), width = .05)+
  scale_colour_brewer(palette = "Dark2")+
  scale_fill_brewer(palette = "Dark2")+
  ggtitle("Figure 11: Repeated Measures - Factorial (Extended)")

ggsave('../figs/tutorial_R/11repanvplot2.png', width = w, height = h)
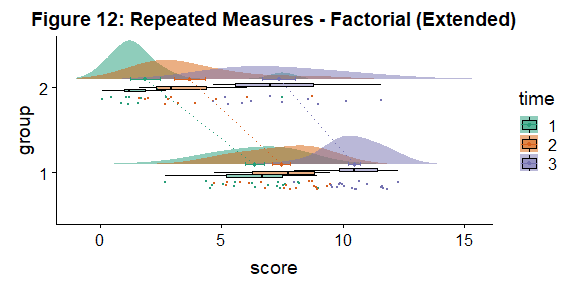
下面是相同的绘图,但将分组变量翻转:
#Rainclouds for repeated measures, additional plotting options

p12 <- ggplot(rep_data, aes(x = group, y = score, fill = time)) +
  geom_flat_violin(aes(fill = time),position = position_nudge(x = .1, y = 0), adjust = 1.5, trim = FALSE, alpha = .5, colour = NA)+
  geom_point(aes(x = as.numeric(group)-.15, y = score, colour = time),position = position_jitter(width = .05), size = .25, shape = 20)+
  geom_boxplot(aes(x = group, y = score, fill = time),outlier.shape = NA, alpha = .5, width = .1, colour = "black")+
  geom_line(data = sumrepdat, aes(x = as.numeric(group)+.1, y = score_mean, group = time, colour = time), linetype = 3)+
  geom_point(data = sumrepdat, aes(x = as.numeric(group)+.1, y = score_mean, group = time, colour = time), shape = 18) +
  geom_errorbar(data = sumrepdat, aes(x = as.numeric(group)+.1, y = score_mean, group = time, colour = time, ymin = score_mean-se, ymax = score_mean+se), width = .05)+
  scale_colour_brewer(palette = "Dark2")+
  scale_fill_brewer(palette = "Dark2")+
  ggtitle("Figure 12: Repeated Measures - Factorial (Extended)") +
  coord_flip()

ggsave('../figs/tutorial_R/12repanvplot3.png', width = w, height = h)
这个就很漂亮了,因为前面设置了图片的大小,看上去似乎像素不太高的样子,但是都是可以调整的。这个和之前的ggtastas一样优秀!
这个果断需要收藏点赞转发的是不是,哈哈哈

