《Python深度学习》之卷积神经网络可视化
import keras
keras.__version__
首先加载之前保存的模型
from keras.models import load_model

model = load_model('cats_and_dogs_small_2.h5')
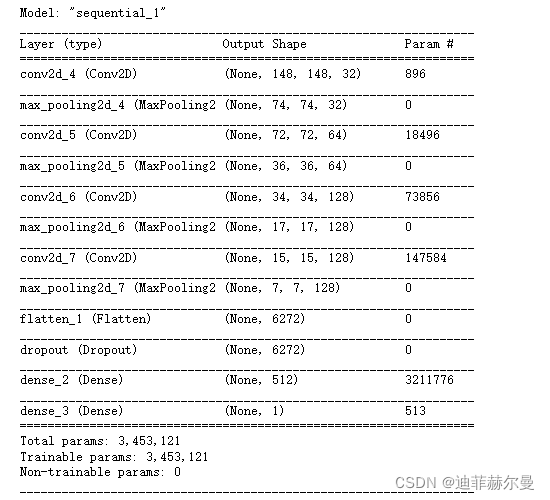
model.summary()  # As a reminder.
预处理单张图像
img_path = 'C:/Users/15790/Deep_Learning _with_Python/conv/cats_and_dogs_small/test/cats/cat.1700.jpg'

# We preprocess the image into a 4D tensor
from keras.preprocessing import image
import numpy as np

img = image.load_img(img_path, target_size=(150, 150))
img_tensor = image.img_to_array(img)
img_tensor = np.expand_dims(img_tensor, axis=0)
# Remember that the model was trained on inputs
# that were preprocessed in the following way:
img_tensor /= 255.

# Its shape is (1, 150, 150, 3)
print(img_tensor.shape)
#其形状为(1,150,150,3)
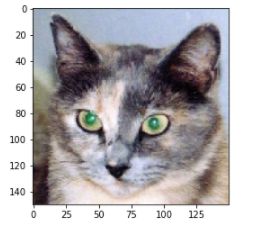
显示测试图像
import matplotlib.pyplot as plt

plt.imshow(img_tensor[0])
plt.show()
用一个输入张量和一个输出张量列表将模型实例化
from keras import models

# Extracts the outputs of the top 8 layers:
layer_outputs = [layer.output for layer in model.layers[:8]]
# Creates a model that will return these outputs, given the model input:
activation_model = models.Model(inputs=model.input, outputs=layer_outputs)
以预测模式运行模型
# This will return a list of 5 Numpy arrays:
# one array per layer activation
activations = activation_model.predict(img_tensor)
对于输入的猫图像,第一个卷积层的激活如下:
first_layer_activation = activations[0]
print(first_layer_activation.shape)
(1,148,148,32)
这是一个大小为148 * 148 的特征图,有32个通道
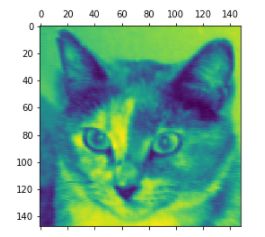
将第四个通道可视化
import matplotlib.pyplot as plt

plt.matshow(first_layer_activation[0, :, :, 3], cmap='viridis')
plt.show()
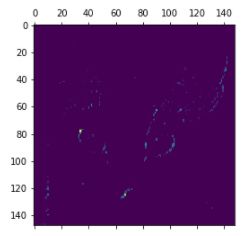
将第七个通道可视化
plt.matshow(first_layer_activation[0, :, :, 30], cmap='viridis')
plt.show()
将每个中间激活的所有通道可视化
import keras

# These are the names of the layers, so can have them as part of our plot
layer_names = []
for layer in model.layers[:8]:
    layer_names.append(layer.name)

images_per_row = 16

# Now let's display our feature maps
for layer_name, layer_activation in zip(layer_names, activations):
    # This is the number of features in the feature map
    n_features = layer_activation.shape[-1]

    # The feature map has shape (1, size, size, n_features)
    size = layer_activation.shape[1]

    # We will tile the activation channels in this matrix
    n_cols = n_features // images_per_row
    display_grid = np.zeros((size * n_cols, images_per_row * size))

    # We'll tile each filter into this big horizontal grid
    for col in range(n_cols):
        for row in range(images_per_row):
            channel_image = layer_activation[0,
                                             :, :,
                                             col * images_per_row + row]
            # Post-process the feature to make it visually palatable
            channel_image -= channel_image.mean()
            channel_image /= channel_image.std()
            channel_image *= 64
            channel_image += 128
            channel_image = np.clip(channel_image, 0, 255).astype('uint8')
            display_grid[col * size : (col + 1) * size,
                         row * size : (row + 1) * size] = channel_image

    # Display the grid
    scale = 1. / size
    plt.figure(figsize=(scale * display_grid.shape[1],
                        scale * display_grid.shape[0]))
    plt.title(layer_name)
    plt.grid(False)
    plt.imshow(display_grid, aspect='auto', cmap='viridis')

plt.show()
为过滤器的可视化定义损失张量
from keras.applications.vgg16 import VGG16
from keras import backend as K

model = VGG16(weights='imagenet',
              include_top=False)

layer_name = 'block3_conv1'
filter_index = 0

layer_output = model.get_layer(layer_name).output
loss = K.mean(layer_output[:, :, :, filter_index])
获取损失相对于输入的梯度
grads = K.gradients(loss, model.input)[0]
梯度标准化
grads /= (K.sqrt(K.mean(K.square(grads))) + 1e-5)
给定Numpy输入值,得到Numpy的输出值
iterate = K.function([model.input], [loss, grads])

# Let's test it:
import numpy as np
loss_value, grads_value = iterate([np.zeros((1, 150, 150, 3))])
通过随机梯度下降让损失最大化
# We start from a gray image with some noise
input_img_data = np.random.random((1, 150, 150, 3)) * 20 + 128.

# Run gradient ascent for 40 steps
step = 1.  # this is the magnitude of each gradient update
for i in range(40):
    # Compute the loss value and gradient value
    loss_value, grads_value = iterate([input_img_data])
    # Here we adjust the input image in the direction that maximizes the loss
    input_img_data += grads_value * step
将张量转换为有效图像的使用函数
def deprocess_image(x):
    # normalize tensor: center on 0., ensure std is 0.1
    x -= x.mean()
    x /= (x.std() + 1e-5)
    x *= 0.1

    # clip to [0, 1]
    x += 0.5
    x = np.clip(x, 0, 1)

    # convert to RGB array
    x *= 255
    x = np.clip(x, 0, 255).astype('uint8')
    return x
生成过滤器可视化的函数
def generate_pattern(layer_name, filter_index, size=150):
    # Build a loss function that maximizes the activation
    # of the nth filter of the layer considered.
    layer_output = model.get_layer(layer_name).output
    loss = K.mean(layer_output[:, :, :, filter_index])

    # Compute the gradient of the input picture wrt this loss
    grads = K.gradients(loss, model.input)[0]

    # Normalization trick: we normalize the gradient
    grads /= (K.sqrt(K.mean(K.square(grads))) + 1e-5)

    # This function returns the loss and grads given the input picture
    iterate = K.function([model.input], [loss, grads])

    # We start from a gray image with some noise
    input_img_data = np.random.random((1, size, size, 3)) * 20 + 128.

    # Run gradient ascent for 40 steps
    step = 1.
    for i in range(40):
        loss_value, grads_value = iterate([input_img_data])
        input_img_data += grads_value * step

    img = input_img_data[0]
    return deprocess_image(img)
生成某一层中所有过滤波器响应模式组成的网络
for layer_name in ['block1_conv1', 'block2_conv1', 'block3_conv1', 'block4_conv1']:
    size = 64
    margin = 5

    # This a empty (black) image where we will store our results.
    results = np.zeros((8 * size + 7 * margin, 8 * size + 7 * margin, 3))

    for i in range(8):  # iterate over the rows of our results grid
        for j in range(8):  # iterate over the columns of our results grid
            # Generate the pattern for filter `i + (j * 8)` in `layer_name`
            filter_img = generate_pattern(layer_name, i + (j * 8), size=size)

            # Put the result in the square `(i, j)` of the results grid
            horizontal_start = i * size + i * margin
            horizontal_end = horizontal_start + size
            vertical_start = j * size + j * margin
            vertical_end = vertical_start + size
            results[horizontal_start: horizontal_end, vertical_start: vertical_end, :] = filter_img

    # Display the results grid
    plt.figure(figsize=(20, 20))
    plt.imshow(results)
    plt.show()
md 太累了不写了


