R数据分析:潜在剖面分析LPA的做法与解释
Latent Profile Analysis (LPA) tries to identify clusters of individuals (i.e., latent profiles) based on responses to a series of continuous variables (i.e., indicators). LPA assumes that there are unobserved latent profiles that generate patterns of responses on indicator items.
潜在剖面分析要做的事情就是根据个体在连续变量上的响应情况将个体分为互斥的群,或者说互斥的剖面。
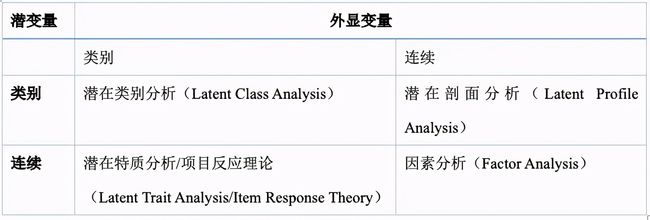
大家肯定还听过潜在类别分析,其实潜在剖面分析和潜在类别分析在统计上都是一样的,唯一的不同就是显变变量是分类变量(二分类)的时候我们叫它潜在类别,显变量是连续变量的时候我们叫潜在剖面。
The difference between LPA and LCA is conceptual, not computational: LPA uses continuous indicators and LCA uses binary indicators
大家记住下面这张图:
老规矩,今天还是带着大家做一个潜在剖面分析的实例。
实例操练
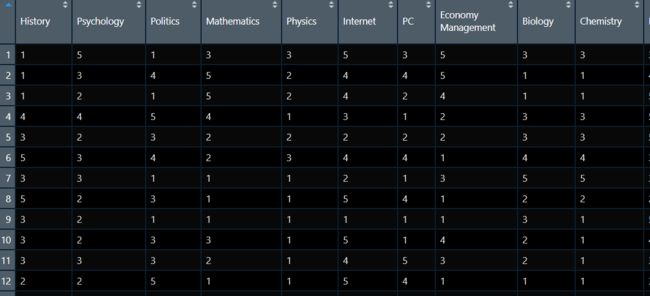
今天手上有997个学生样本的数据集interests_clean.csv,对于每个学生我们都调查了他的兴趣爱好,总共有32个兴趣爱好,我们会让学生对每一个兴趣的爱好程度以1-5分进行打分,就得到了一个如下图的数据集:
今天要做的就是对此数据集进行潜剖面分析,我们希望通过学生对每个兴趣的响应将学生分为不同的剖面。
在进行潜剖面分析的时候需要我们的数据是没有缺失值的,同时我们有必要将所有的值进行标准化处理,以便观察不同剖面的差异从而给每个剖面命名。
interests_clustering <- interests_clean %>%
  na.omit() %>%
  mutate_all(list(scale))
上面的代码就将原始数据集进行了缺失删除处理和标准化。
接下来我们首先探索一下对于我们的数据我们应该分为几个剖面,这个问题一般情况下我们可以使用mclust包的mclustBIC看不同剖面模型的BIC,通常我们可以将不同模型的BIC画出来:
library(mclust)
BIC <- mclustBIC(interests_clustering)
plot(BIC)
summary(BIC)
看上面的BIC的变化图和summaryBIC的结果,初步得到,对于我们的数据划分3个剖面是比较合适的。
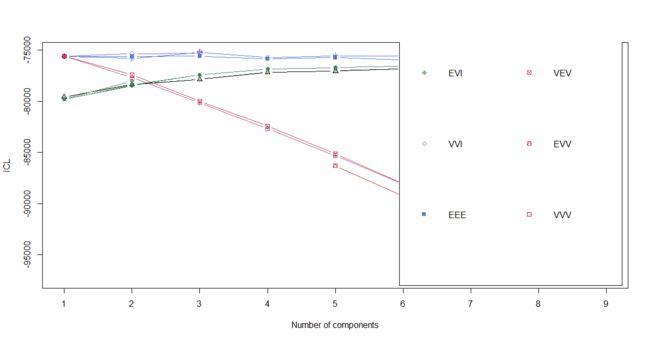
还有一个和BIC差不多的判断剖面个数的指标叫做ICL,Integrated Completed Likelikood,ICL对模型的不稳定性会进行惩罚,所以以ICL为标准得到的模型个数会更加稳定,要得到ICL指标只需要运行以下代码:
ICL <- mclustICL(interests_clustering)
plot(ICL)
summary(ICL)
看上面的ICL的变化图和summaryICL的结果,也同样得到,对于我们的数据划分3个剖面是比较合适的。
还有一个指标也是帮我们确定剖面个数的,叫做BLRT:
Bootstrap Likelihood Ratio Test (BLRT) which compares model fit between k-1 and k cluster models. In other words, it looks to see if an increase in profiles increases fit。
如上面的英文说明,这个指标就是帮我们看看,第 k-1 and k个模型之间是不是有差异,也就是说看看在k-1个剖面的基础上增加1个剖面后模型是不是会更好。
那么,我也来瞅瞅我的数据的BLRT指标的结果:
mclustBootstrapLRT(interests_clustering, modelName = "VEE")
可以看到,BLRT这个指标显示剖面个数从1增加到2,从2增加到3都是有显著性意义的,然后从3增加到4模型优度就并没有显著变好,所以BLRT依然显示我们的数据适合划分为3个剖面,那么现在我们就可以放心大胆地去做啦。
拟合模型
模型拟合超级简单哦。
只需要用到Mclust这个函数,然后把你的数据喂给它然后,规定好你要几个剖面就行。
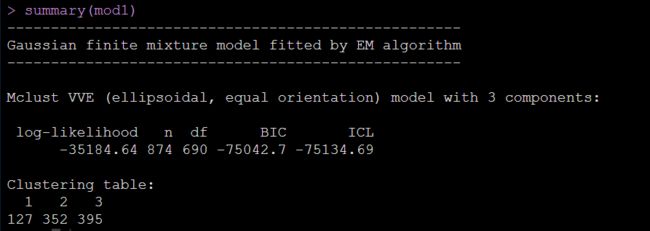
mod1 <- Mclust(interests_clustering, G = 3)
就这么简单。可以看到3个剖面中,每个剖面有多少个体等等信息。
潜剖面模型可视化
潜剖面模型的可视化可以帮助我们知道人群剖面在不同的显变量上的反应的平均水平:
we want to see how the profiles differ on the indicators, that is, the items that made up the profiles. If the solution is theoretically meaningful, we should see differences that make sense.
所以,首先我们就需要把剖面显变量的均值给它从模型中提取出来,代码如下:
means <- data.frame(mod1$parameters$mean, stringsAsFactors = FALSE) %>%
  rownames_to_column() %>%
  rename(Interest = rowname) %>%
  melt(id.vars = "Interest", variable.name = "Profile", value.name = "Mean") %>%
  mutate(Mean = round(Mean, 2),
         Mean = ifelse(Mean > 1, 1, Mean))
运行上面的代码就可以得到每个剖面的所有显变量上的均值,上面代码的思路如下:首先提取模型均值,然后将提取出的均值数据框列名变成变量,对列名变量改名后将数据由宽型数据变化为长形数据,考虑到我们画图时的纵坐标是从0起的,所以对于已经标准化的数据我们要将其最大值改1。
好吧,估计好多人看不懂了,但是你们先收藏着,代码就在上面你们自己套自己的数据就行。
均值提取完了之后,我们开始作图啦
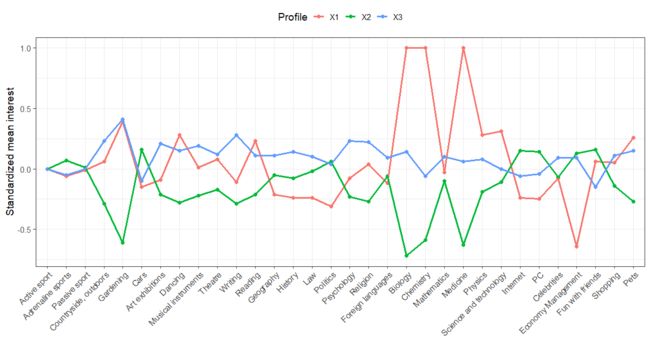
作图要达到的结果就是:通过图显示出不同剖面在各个指标上的响应均值,从而帮助我们给剖面起名字。
对于本例,作图代码如下:
means %>%
  ggplot(aes(Interest, Mean, group = Profile, color = Profile)) +
  geom_point(size = 2.25) +
  geom_line(size = 1.25) +
  scale_x_discrete(limits = c("Active sport", "Adrenaline sports", "Passive sport",
                              "Countryside, outdoors", "Gardening", "Cars",
                              "Art exhibitions", "Dancing", "Musical instruments", "Theatre", "Writing", "Reading",
                              "Geography", "History", "Law", "Politics", "Psychology", "Religion", "Foreign languages",
                              "Biology", "Chemistry", "Mathematics", "Medicine", "Physics", "Science and technology",
                              "Internet", "PC",
                              "Celebrities", "Economy Management", "Fun with friends", "Shopping", "Pets")) +
  labs(x = NULL, y = "Standardized mean interest") +
  theme_bw(base_size = 14) +
  theme(axis.text.x = element_text(angle = 45, hjust = 1), legend.position = "top")
上面都是很基本的ggplot2语法哈,我这儿将指标进行了重新排序,把比较相近的指标放在了一起,比如所有的sport放在一起等等,这样也是为了方便看图给剖面起名字。
运行上面的代码,就可以得到输出啦:
看,剖面3中的这些学生就属于兴趣爱好中规中矩的,剖面1的学生尤其喜爱生物,化学和医学,我们不妨将这个剖面命名为“理科爱好者”,同样的剖面2的学生尤其喜欢互联网,PC,聚会,我们不妨将这个剖面的学生命名为“爱好玩耍者”,还有剖面3的学生尤其对园艺和户外活动感兴趣,所以我将它命名为“户外运动爱好者”。
然后,给上图改改图例吧,改成我们的新的剖面命名:
p <- means %>%
  mutate(Profile = recode(Profile,
                          X1 = "理科爱好者: 16%",
                          X2 = "爱好玩耍者: 60%",
                          X3 = "户外运动爱好者: 24%")) %>%
  ggplot(aes(Interest, Mean, group = Profile, color = Profile)) +
  geom_point(size = 2.25) +
  geom_line(size = 1.25) +
  scale_x_discrete(limits = c("Active sport", "Adrenaline sports", "Passive sport",
                              "Countryside, outdoors", "Gardening", "Cars",
                              "Art exhibitions", "Dancing", "Musical instruments", "Theatre", "Writing", "Reading",
                              "Geography", "History", "Law", "Politics", "Psychology", "Religion", "Foreign languages",
                              "Biology", "Chemistry", "Mathematics", "Medicine", "Physics", "Science and technology",
                              "Internet", "PC",
                              "Celebrities", "Economy Management", "Fun with friends", "Shopping", "Pets")) +
  labs(x = NULL, y = "Standardized mean interest") +
  theme_bw(base_size = 14) +
  theme(axis.text.x = element_text(angle = 45, hjust = 1), legend.position = "top")
好啦,大功告成,这个研究发个核心期刊没问题吧,哈哈哈。
同学们学会了嘛,欢迎留言。
小结
今天给大家写了潜在剖面分析的做法与解释,感谢大家耐心看完,自己的文章都写的很细,代码都在原文中,希望大家都可以自己做一做,请关注后私信回复“数据链接”获取所有数据和本人收集的学习资料。如果对您有用请先收藏,再点赞转发。
也欢迎大家的意见和建议,大家想了解什么统计方法都可以在文章下留言,说不定我看见了就会给你写教程哦。
如果你是一个大学本科生或研究生,如果你正在因为你的统计作业、数据分析、论文、报告、考试等发愁,如果你在使用SPSS,R,Python,Mplus, Excel中遇到任何问题,都可以联系我。因为我可以给您提供好的,详细和耐心的数据分析服务。
如果你对Z检验,t检验,方差分析,多元方差分析,回归,卡方检验,相关,多水平模型,结构方程模型,中介调节,量表信效度等等统计技巧有任何问题,请私信我,获取详细和耐心的指导。
If you are a student and you are worried about you statistical #Assignments, #Data #Analysis, #Thesis, #reports, #composing, #Quizzes, Exams.. And if you are facing problem in #SPSS, #R-Programming, #Excel, Mplus, then contact me. Because I could provide you the best services for your Data Analysis.
Are you confused with statistical Techniques like z-test, t-test, ANOVA, MANOVA, Regression, Logistic Regression, Chi-Square, Correlation, Association, SEM, multilevel model, mediation and moderation etc. for your Data Analysis...??
Then Contact Me. I will solve your Problem...
加油吧,打工人!
猜你喜欢
R数据分析:用R语言做潜类别分析LCA
R数据分析:非专业解说潜变量增长模型
R数据分析:如何做潜在剖面分析Mplus
数据分析:顶级期刊文章的潜在剖面分析如何用Mplus 实现
Mplus数据分析:潜在类别分析(LCA)流程(详细版)
