机器学习可解释性(一) —— 累积局部效应图(ALE)
一、序言
深度学习的“黑盒”特性如今越来越让计算机工作者困扰,因此模型的可解释性问题在近些年越来越受到人们的关注。作为该领域的萌新,我开始一点点学习相关领域的内容,参考的书籍是:《Interpretable Machine Learning》。书中从最基本的可解释性算法讲起,再到基于深度神经网络的可解释性算法。随着对本书学习的深入,我也将更新关于书籍的更多内容的学习记录。
二、算法介绍
2.1 算法背景
累积局部效应 (Accumulated Local Effects Plot) 描述了特征平均如何影响机器学习模型的预测。
在书中的本节之前的部分讲解了部分依赖图(Partial Dependence Plot) 以及个体条件期望(Individual Conditional Expectation) ,这些算法的大体实现步骤都可以理解为:
- 训练机器学习模型;
- 使用得到的机器学习模型,修改原数据的一到两个特征重新进行预测;
- 观察被修改特征的样本的预测结果,绘制在统计意义下随着某特征变化的趋势。
这样的过程十分直观,但存在巨大的隐患,当特征之间存在明显的线性关系时,任意对于原数据某一特征进行修改可能会产生很多无意义数据。这也正是ALE算法提出的前提。
2.2 实现思路
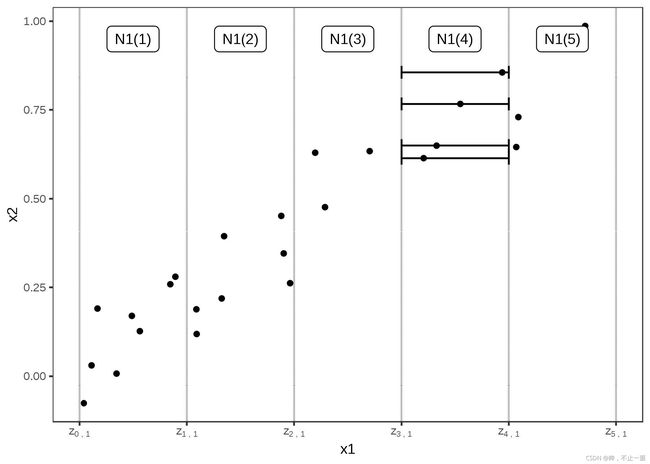
图中能够看到特征 X 1 X_1 X1 和 X 2 X_2 X2 存在一定的线性关系,这意味着假设特征之间互不相关的算法在这里都无法应用。
ALE算法的精妙之处就在于解决了特征之间存在相关性的问题 。它将特征划分为间隔(垂直线),这样在间隔中的点很大程度是符合实际的点。对于间隔中的数据实例(点),当我们用间隔的上限和下限(⽔平线) 替换特征时,我们计算预测值的差异。这些差异随后被累积并中心化,从而形成ALE曲线。
2.3 理论实现
ALE图对特征的变化进行平均,然后将其累积在网格上。(这里我仅介绍我对于ALE算法的理解,在书中还有与M图,PDP的算法对比,有想要了解的读者可以看书中的讲解)。
ALE的理论公式如下所示:
f ^ x s , M ( x s ) = ∫ z 0 , 1 x s E X c ∣ X s [ f ^ s ( X s , X c ) ∣ X s = z s ] d z s − c o n s t a n t = ∫ z 0 , 1 x s ∫ x c f ^ s ( X s , X c ) P ( x c ∣ z s ) d x c d z s − c o n s t a n t \hat{f}_{x_s,M}(x_s)=\int_{z_{_{0,1}}}^{x_s}E_{X_c|X_s}[\hat{f}^s(X_s,X_c)|X_s=z_s]dz_s-constant \\ =\int_{z_{_{0,1}}}^{x_s} \int_{x_c}\hat{f}^s(X_s,X_c)P(x_c|z_s)dx_cdz_s-constant f^xs,M(xs)=∫z0,1xsEXc∣Xs[f^s(Xs,Xc)∣Xs=zs]dzs−constant=∫z0,1xs∫xcf^s(Xs,Xc)P(xc∣zs)dxcdzs−constant
其中 X s X_s Xs为选中用于解释的特征, X c X_c Xc为其他特征。该算法计算的是平均预测的变化,而不是预测本身。这种变化被定义为梯度:
f ^ s ( X s , X c ) = δ f ^ ( X s , X c ) δ X s \hat{f}^s(X_s,X_c)=\frac{\delta \hat{f}(X_s,X_c)}{\delta X_s} f^s(Xs,Xc)=δXsδf^(Xs,Xc)
另外,注意积分上下限,这里的积分仅仅定义在选定特征的一个网格范围内,能够确保在其他特征确定的条件下,在网格内选定的特征取上下限是基本符合实际的,这样就解决了特征之间的相关性问题。
最后,我们注意到在积分的最后减去了一个常量,这是与M图的一个很重要的差异,能够将ALE图中心化,以便数据的平均效应为零。
三、算法实现
3.1 估计
上述推导都是理论上进行的,在很多情况下模型是无法求出显式梯度的。因此也就有了近似的算法用来估计ALE函数的值,在代码实现过程中也是根据下文的公式实现的。
首先,写出非中心化的效应:
f ~ ^ j , A L E ( x ) = ∑ k = 1 k j ( x ) 1 n j ( k ) ∑ i : x j ( i ) ∈ N j ( K ) [ f ( z k , j , x \ j ( i ) ) − f ( z k − 1 , j , x \ j ( i ) ) ] \hat{\widetilde{f}}_{j,ALE}(x)=\sum_{k=1}^{k_{j}(x)}\frac{1}{n_j(k)}\sum_{i:x_j^{(i)}\in{N_j(K)}}[f(z_{k,j},x_{\backslash j}^{(i)})-f(z_{k-1,j},x_{\backslash j}^{(i)})] f ^j,ALE(x)=k=1∑kj(x)nj(k)1i:xj(i)∈Nj(K)∑[f(zk,j,x\j(i))−f(zk−1,j,x\j(i))]
式中 n j ( k ) n_j(k) nj(k)是该网格中共有的数据个数, z k , j z_{k,j} zk,j是所选特征上界的取值, z k − 1 , j z_{k-1,j} zk−1,j是所选特征下届的取值。从公式中也能很好理解为什么算法被称为累积局部效应,能够很清楚看到计算预测差异的过程。将总和除以该网格内的数据个数,获得间隔的预测平均差。
将效应中心化,即平均效应为零,得到下面的表达式:
f ~ j , A L E ( x ) = f ~ ^ j , A L E ( x ) − 1 n ∑ i = 1 n f ~ ^ j , A L E ( x j ( i ) ) \widetilde{f}_{j,ALE}(x)=\hat{\widetilde{f}}_{j,ALE}(x)-\frac{1}{n}\sum_{i=1}^n \hat{\widetilde{f}}_{j,ALE}(x_j^{(i)}) f j,ALE(x)=f ^j,ALE(x)−n1i=1∑nf ^j,ALE(xj(i))
即为每个效应减去了平均的效应,这样当特征效应为正说明特征对预测结果产生正向作用。
在实际实现过程中,使用特征的分位数来定义间隔的网格,这样确保了每个网格中有相同数量的数据实例。不过也带来了间隔长度可能有很大差异的问题。如果感兴趣的特征非常偏斜,则有可能导致某些ALE图出现异常。
3.2 代码展示
代码部分仅仅对于连续单变量问题给出了结果,代码使用jupyter NoteBook编写,基于github上开源的python ALE库。在函数库中包含了双变量以及分类问题的情况,限于书中没有详细讲解双变量的表达式,同时我实验的数据是回归类问题,也就没有实现其余部分,详细大家可以参考原作者的代码。
数据集采用的是Kaggle上经典的单车租赁问题的数据。
处理数据
# 导入需要的库
import numpy as np
import pandas as pd
import matplotlib.pyplot as plt
import seaborn as sns
from datetime import datetime
import matplotlib
matplotlib.matplotlib_fname()
# 已经下载好的训练集和测试集样本
train=pd.read_csv('kaggle_bycle/train.csv')
test=pd.read_csv('kaggle_bycle/test.csv')
train.head()
| datetime | season | holiday | workingday | weather | temp | atemp | humidity | windspeed | casual | registered | count | |
|---|---|---|---|---|---|---|---|---|---|---|---|---|
| 0 | 2011-01-01 00:00:00 | 1 | 0 | 0 | 1 | 9.84 | 14.395 | 81 | 0.0 | 3 | 13 | 16 |
| 1 | 2011-01-01 01:00:00 | 1 | 0 | 0 | 1 | 9.02 | 13.635 | 80 | 0.0 | 8 | 32 | 40 |
| 2 | 2011-01-01 02:00:00 | 1 | 0 | 0 | 1 | 9.02 | 13.635 | 80 | 0.0 | 5 | 27 | 32 |
| 3 | 2011-01-01 03:00:00 | 1 | 0 | 0 | 1 | 9.84 | 14.395 | 75 | 0.0 | 3 | 10 | 13 |
| 4 | 2011-01-01 04:00:00 | 1 | 0 | 0 | 1 | 9.84 | 14.395 | 75 | 0.0 | 0 | 1 | 1 |
删除异常数据
# 删除异常值
train = train[np.abs(train['count']-train['count'].mean())<=3*train['count'].std()]
拆分时间
# 导入dateutil模块帮助提取时间数据
from dateutil.parser import *

# 保留原始数据df,新建df的副本进行数据清洗
train_use = train.copy()

# 提取datetime数据,并将数据类型转换成str
date_time = train_use['datetime'].astype('str')
# 利用parse()解析时间数据
parsed = date_time.apply(lambda x: parse(x))

# 提取年、月、日、小时、星期日数,并以列的形式添加到data数据中
train_use['year'] = parsed.apply(lambda x: x.year)
train_use['month'] = parsed.apply(lambda x: x.month)
train_use['day'] = parsed.apply(lambda x: x.day)
train_use['hour'] = parsed.apply(lambda x: x.hour)
train_use['weekday'] = parsed.apply(lambda x: x.strftime("%a"))
train_use['weekday'] = train_use['weekday'].map({'Mon':0, 'Tue':1, 'Wed':2, 'Thu':3, 'Fri':4, 'Sat':5, 'Sun':6})

# 调整列标题顺序,方便理解数据
columns = ['datetime', 'year', 'month', 'day', 'hour', 'weekday',
           'season', 'holiday', 'workingday',
           'weather', 'temp', 'atemp', 'humidity', 'windspeed',
           'casual', 'registered', 'count',]

train_use = train_use[columns]
# 查看列顺序调整后的数据
train_use.head()
| datetime | year | month | day | hour | weekday | season | holiday | workingday | weather | temp | atemp | humidity | windspeed | casual | registered | count | |
|---|---|---|---|---|---|---|---|---|---|---|---|---|---|---|---|---|---|
| 0 | 2011-01-01 00:00:00 | 2011 | 1 | 1 | 0 | 5 | 1 | 0 | 0 | 1 | 9.84 | 14.395 | 81 | 0.0 | 3 | 13 | 16 |
| 1 | 2011-01-01 01:00:00 | 2011 | 1 | 1 | 1 | 5 | 1 | 0 | 0 | 1 | 9.02 | 13.635 | 80 | 0.0 | 8 | 32 | 40 |
| 2 | 2011-01-01 02:00:00 | 2011 | 1 | 1 | 2 | 5 | 1 | 0 | 0 | 1 | 9.02 | 13.635 | 80 | 0.0 | 5 | 27 | 32 |
| 3 | 2011-01-01 03:00:00 | 2011 | 1 | 1 | 3 | 5 | 1 | 0 | 0 | 1 | 9.84 | 14.395 | 75 | 0.0 | 3 | 10 | 13 |
| 4 | 2011-01-01 04:00:00 | 2011 | 1 | 1 | 4 | 5 | 1 | 0 | 0 | 1 | 9.84 | 14.395 | 75 | 0.0 | 0 | 1 | 1 |
定义ALE算法所用函数
# 函数获得分位数
def _get_quantiles(train_set, feature, bins):
    quantiles = np.unique(
        np.quantile(train_set[feature], np.linspace(0, 1, bins + 1), interpolation="lower")
    )
    bins = len(quantiles) - 1
    return quantiles, bins
def _get_centres(x):
    return (x[1:] + x[:-1])/ 2
# 估计一阶ALE参数
def _first_order_ale_quant(predictor, train_set, feature, bins):
    quantiles, _ = _get_quantiles(train_set, feature, bins)  # 获得分位数
    # 获得每个特征所在的索引
    indices = np.clip(
        np.digitize(train_set[feature], quantiles, right=True) - 1, 0, None
    )
    predictions = []  # 用来存放特征修改之后的预测结果
    for offset in range(2):
        mod_train_set = train_set.copy()
        mod_train_set[feature] = quantiles[indices + offset]
        predictions.append(predictor(mod_train_set))
    effects = predictions[1] - predictions[0]
    index_groupby = pd.DataFrame({"index":indices, "effects": effects}).groupby("index")
    mean_effects = index_groupby.mean().to_numpy().flatten()
    ale = np.array([0, *np.cumsum(mean_effects)])  # 在最前面增加一个0
    ale = _get_centres(ale)  # 中心化之后降维
    ale -= np.sum(ale * index_groupby.size() / train_set.shape[0])
    return ale, quantiles
# 绘制一阶图像
def _first_order_quant_plot(ax, quantiles, ale, **kwargs):
    ax.plot(_get_centres(quantiles), ale, **kwargs)
# 设置图像横纵坐标
def _ax_labels(ax, xlabel=None, ylabel=None):
    if xlabel is not None:
        ax.set_xlabel(xlabel)
    if ylabel is not None:
        ax.set_ylabel(ylabel)

# 设置图像标题
def _ax_title(ax, title, subtitle=""):
    ax.set_title("\n".join((title, subtitle)))
# 定义了一阶ALE图的绘制函数
def ale_plot(model, train_set, features,
            bins=10, monte_carlo=False, monte_carlo_rep=50,
             monte_carlo_ratio=0.1, rugplot_lim=1000):
    # 这里feature应该是字符串
    fig, ax = plt.subplots()
    if monte_carlo:  # 蒙特卡洛采样
        mc_replicates = np.asarray(
        [
            [
                    np.random.choice(range(train_set.shape[0]))
                    for _ in range(int(monte_carlo_ratio * train_set.shape[0]))
            ]
            for _ in range(monte_carlo_rep)
        ])
        for k, rep in enumerate(mc_replicates):
            train_set_rep = train_set.iloc[rep, :]
            mc_ale, mc_quantiles = _first_order_ale_quant(
                model.predict,
                train_set_rep,
                features[0],
                bins,
            )
            _first_order_quant_plot(ax, mc_quantiles, mc_ale, color="#1f77b4", alpha=0.06)
    ale, quantiles = _first_order_ale_quant(
        model.predict,
        train_set,
        features[0],
        bins,
    )
    _ax_labels(ax, "Feature '{}'".format(features[0]), "")
    _ax_title(
                ax,
                "First-order ALE of feature '{0}'".format(features[0]),
                "Bins : {0} - Monte-Carlo : {1}".format(
                    len(quantiles) - 1,
                    mc_replicates.shape[0] if monte_carlo else "False",
                ),
    )
    ax.grid(True, linestyle="-", alpha=0.4)
    if rugplot_lim is None or train_set.shape[0] <= rugplot_lim:
        sns.rugplot(train_set[features[0]], ax=ax, alpha=0.2)
        _first_order_quant_plot(ax, quantiles, ale, color="black")
    return ax
定义决策树模型
from sklearn import tree
from sklearn.inspection import plot_partial_dependence
from sklearn.inspection import partial_dependence
# 基于决策树进行预测
train_use_X = train_use[['year', 'month', 'day', 'hour', 'weekday',
           'season', 'holiday', 'workingday',
           'weather', 'temp', 'atemp', 'humidity', 'windspeed']]
train_use_Y = train_use[['count']]

# 定义决策树模型
clf = tree.DecisionTreeRegressor()
clf = clf.fit(train_use_X, train_use_Y)
函数调用与图像绘制
# 绘制图像
features = ['humidity']
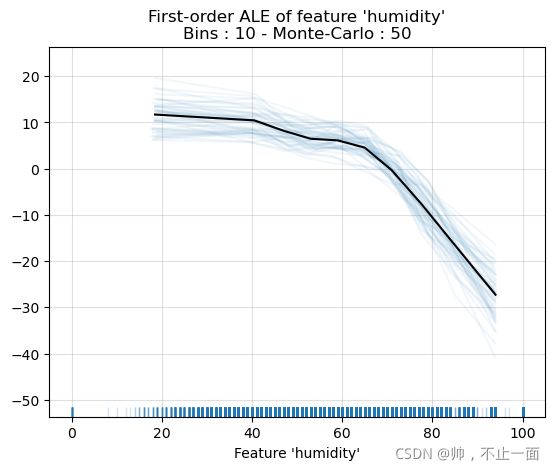
ale_plot(clf, train_set=train_use_X, monte_carlo=True, rugplot_lim=None, features=features,)
plt.show()
结语
本文是本人第一次写博客,有很多不懂的地方希望大家多多指教,在学习过程中可能引用了别人的代码忘记标明出处,如有侵权请联系我进行修正。
累计局部效应图作为机器学习可解释性的基础内容,在很多方面仍然无法做好,尤其很难对于多特征同时进行解释。而可解释性希望解决的一个重要问题——深度学习可解释性,需要解释模型能够对复杂的数据类型进行解释,ALE就显得捉襟见肘了。
后续的学习过程中,我也将更新更多可解释性方面的学习笔记,欢迎大家和我交流。

