【python数据分析】用python进行数据探索2(常见matplotlib及pandas绘图函数汇总、对比及拓展)
| 绘图函数 | 绘图函数功能 | 所属工具箱 |
| plot() | 折线图 | matplotlib/pandas |
| pie() | 饼图 | matplotlib/pandas |
| hist() | 直方图 | matplotlib/pandas |
| boxplot() | 箱型图 | matplotlib/pandas |
| plot(logy=True) | y轴的对数图形 | pandas |
| plot(yerr=error) | 误差条形图 | pandas |
1. plot
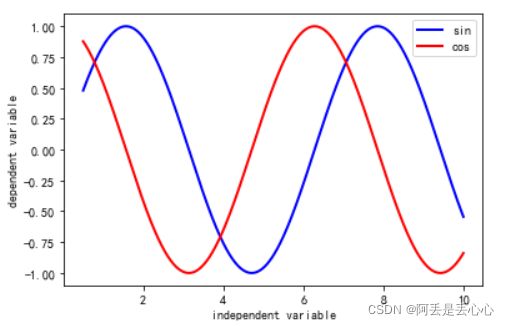
matplotlib.pyplot.plot使用实例:
import numpy as np
x = np.linspace(0.5, 10, 1000)
y = np.sin(x)
z = np.cos(x)
plt.plot(x, y, ls='-', lw=2, label='sin', color='b')
plt.plot(x, z, ls='-', lw=2, label='cos', color='red')
plt.legend()
plt.xlabel('independent variable')
plt.ylabel('dependent variable')
plt.show()
结果如图:
如果将两条线分开:
plt.subplot(2,1,1)   #添加子图
plt.plot(x, y, ls='-', lw=2, label='sin', color='b')
plt.legend()   #加上图例
plt.subplot(2,1,2)
plt.plot(x, z, ls='-', lw=2, label='cos', color='red')
plt.legend()
plt.show()
结果如下:
注意!!pandas中plot用法跟上面是不一样的
如果想用pandas中的plot绘制上面的图像用以下代码:
test_dict = {'sin':y,'cos':z}
line = pd.DataFrame(test_dict,index=x)
line.plot(colormap='RdBu')   #或者用line.plot.line(colormap='RdBu')
line.plot.line(subplots=True,colormap='RdBu')
这篇文章讲了matplotlib和pandas的一些绘图区别,可以参考:
【matplotlib绘图】Pandas绘图与matplotlib绘图的关联及异同_Room221技术笔记-CSDN博客_pandas和matplotlib区别z
这篇文章更详细的讲了matplotlib中plot的绘图方法:
Python--Matlibplot画图功能演示_叶小刀-CSDN博客_plot python
更多pandas中plot的绘图方法:
pandas.DataFrame.plot( )参数详解_h_hxx的博客-CSDN博客_df.plot()
关于Matplotlib 多子图绘制:
Matplotlib 多子图绘制 - 知乎
2. pie
matplotlib中的饼图
import matplotlib.pyplot as plt

# The slices will be ordered and plotted counter-clockwise.
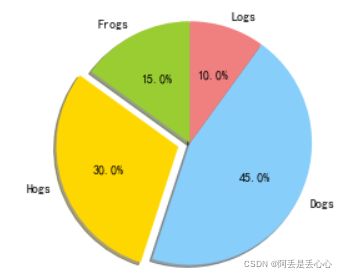
labels = 'Frogs', 'Hogs', 'Dogs', 'Logs'  # 定义标签
sizes = [15, 30, 45, 10]  # 每一块的比例
colors = ['yellowgreen', 'gold', 'lightskyblue', 'lightcoral']  # 每一块的颜色
explode = (0, 0.1, 0, 0)  # 突出显示,这里仅仅突出显示第二块(即'Hogs')

plt.pie(sizes, explode=explode, labels=labels, colors=colors, autopct='%1.1f%%', shadow=True, startangle=90)
plt.axis('equal')  # 显示为圆(避免比例压缩为椭圆)
plt.show()
得到结果:
pandas中pie():
test_dict = {'animal':[15, 30, 45, 10]}
line = pd.DataFrame(test_dict,index=['Frogs', 'Hogs', 'Dogs', 'Logs'])
line.plot.pie(subplots=True,
              figsize=(10, 8),
              autopct='%.2f%%',
              radius = 1,
              startangle = 250,   #设置饼图初始角度
              legend=False,
              colormap='viridis'   #设置颜色
             )
3. hist
matplotlib中的hist:
import matplotlib.pyplot as plt
import numpy as np
x = np.random.randn(1000)  # 1000个服从正态分布的随机数
plt.hist(x, 10)  # 分成10组进行绘制直方图
plt.show()
结果如图:
pandas中的hist:
df = pd.DataFrame({'a': np.random.randn(1000) + 1,
                   'b': np.random.randn(1000),
                   'c': np.random.randn(1000) - 1},
                  columns=['a', 'b', 'c'])
df.hist(bins=4)
df.plot.hist(alpha=0.5)
结果可以发现df.hist和df.plot.hist有区别
多种hist绘图方法可以参考:
Pandas中,画直方图Hist 的四种方法,以及其他绘图_Elvirangel的博客-CSDN博客_df.hist
4. boxplot
matplotlib中的箱线图
plt.figure(figsize=(5,5))#设置画布的尺寸
plt.title('boxplot',fontsize=20)#标题,并设定字号大小
x = np.random.randn(1000)  # 1000个服从正态分布的随机数
D = pd.DataFrame([x, x+1]).T  # 构造两列的DataFrame
labels = '0','1',   #图例
plt.boxplot([D[0], D[1]], labels = labels)#grid=False:代表不显示背景中的网格线
plt.show()#显示图像
pandas中的箱线图:
import numpy as np
import pandas as pd
x = np.random.randn(1000)  # 1000个服从正态分布的随机数
D = pd.DataFrame([x, x+1]).T  # 构造两列的DataFrame
D.plot(kind = 'box')  # 调用Series内置的绘图方法画图,用kind参数指定箱型图box
得到的结果:
matplotlib中箱线图更多用法:
Matplotlib - 箱线图、箱型图 boxplot () 所有用法详解_Not Found黄小包-CSDN博客_matplotlib箱线图
5. plot(logx=True)/plot(logy=True)
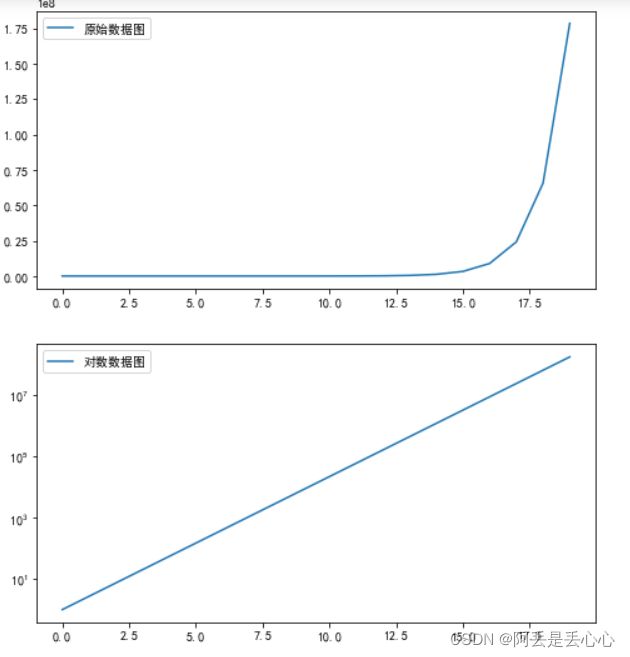
对x轴或者y轴使用对数刻度
x = pd.Series(np.exp(np.arange(20)))  # 原始数据
plt.figure(figsize = (8, 9))  # 设置画布大小
ax1 = plt.subplot(2, 1, 1)
x.plot(label = u'原始数据图', legend = True)

ax1 = plt.subplot(2, 1, 2)
x.plot(logy = True, label = u'对数数据图', legend = True)
plt.show()
结果如下:
6. plot(yerr=error)
import matplotlib.pyplot as plt
plt.rcParams['font.sans-serif'] = ['SimHei']  # 用来正常显示中文标签
plt.rcParams['axes.unicode_minus'] = False  # 用来正常显示负号
import numpy as np
import pandas as pd

error = np.random.randn(10)  # 定义误差列
y = pd.Series(np.sin(np.arange(10)))  # 均值数据列
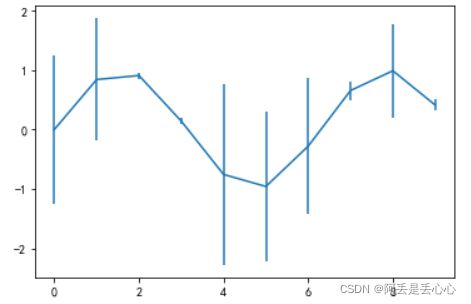
y.plot(yerr = error)  # 绘制误差图
plt.show()
结果如下:
matplotlib中也有绘制误差棒的函数errorbar可以参考我之前的文章用matplotlib画带有误差棒的三维数据散点图(第三维连续变量属性用节点颜色和大小表示)——python_阿丢是丢心心的博客-CSDN博客


