yolov5损失函数的几点理解
yolov5损失函数的几点理解
所用代码:https://github.com/ultralytics/yolov5
参考文献:https://www.cnblogs.com/pprp/p/12590801.html
感谢知乎网友:Ancy贝贝
重要的代码块在build_targets内。
def build_targets(p, targets, model):
    # Build targets for compute_loss(), input targets(image,class,x,y,w,h)
    det = model.module.model[-1] if is_parallel(model) else model.model[-1]  # Detect() module
    na, nt = det.na, targets.shape[0]  # number of anchors, targets
    tcls, tbox, indices, anch = [], [], [], []
    gain = torch.ones(7, device=targets.device)  # normalized to gridspace gain
    ai = torch.arange(na, device=targets.device).float().view(na, 1).repeat(1, nt)  # same as .repeat_interleave(nt)
    #将targets复制3份,每份分配一个anchor编号,如0,1,2. 也就是每个anchor分配一份targets。
    targets = torch.cat((targets.repeat(na, 1, 1), ai[:, :, None]), 2)  # append anchor indices

    g = 0.5  # bias
    # 这里off表示了5个偏移,原点不动,往右、往下、往左、往上。
    # 其中坐标原点在图像的左上角,x轴往右(列),y轴往下(行)。
    off = torch.tensor([[0, 0],
                        [1, 0], [0, 1], [-1, 0], [0, -1],  # j,k,l,m
                        # [1, 1], [1, -1], [-1, 1], [-1, -1],  # jk,jm,lk,lm
                        ], device=targets.device).float() * g  # offsets

    for i in range(det.nl):
        #det.anchors在导入model的时候就除以了步长,因此此时anchor大小不是相对于原图,而是相对于对应特征层的尺寸
        anchors = det.anchors[i]
        gain[2:6] = torch.tensor(p[i].shape)[[3, 2, 3, 2]]  # xyxy gain

        # Match targets to anchors
        #这里主要是将gt的cx,cy,w,h换算到当前特征层对应的尺寸,以便和该层的anchor大小相对应
        t = targets * gain
        if nt:
            # Matches
            #这个部分是计算gt和anchor的匹配程度
            #即w_gt/w_anchor  h_gt/h_anchor
            r = t[:, :, 4:6] / anchors[:, None]  # wh ratio
            #这里判断了r和1/r与model.hyp['anchor_t']的大小关系,即只有不大于这个数,也就是说gt与anchor的宽高差距不过大的时候,才认为匹配。代码中 model.hyp['anchor_t']=4
            j = torch.max(r, 1. / r).max(2)[0] < model.hyp['anchor_t']  # compare
            # j = wh_iou(anchors, t[:, 4:6]) > model.hyp['iou_t']  # iou(3,n)=wh_iou(anchors(3,2), gwh(n,2))
			#将满足条件的targets筛选出来。
            t = t[j]  # filter

            # Offsets
            #这个部分就是扩充targets的数量,将比较targets附近的4个点,选取最近的2个点作为新targets中心,新targets的w、h使用与原targets一致,只是中心点坐标的不同。
            gxy = t[:, 2:4]  # grid xy
            gxi = gain[[2, 3]] - gxy  # inverse
            j, k = ((gxy % 1. < g) & (gxy > 1.)).T
            l, m = ((gxi % 1. < g) & (gxi > 1.)).T
            j = torch.stack((torch.ones_like(j), j, k, l, m))
            t = t.repeat((5, 1, 1))[j] #筛选后t的数量是原来t的3倍。
            offsets = (torch.zeros_like(gxy)[None] + off[:, None])[j]
        else:
            t = targets[0]
            offsets = 0

        # Define
        b, c = t[:, :2].long().T  # image, class
        gxy = t[:, 2:4]  # grid xy
        gwh = t[:, 4:6]  # grid wh
        gij = (gxy - offsets) #自己加的代码,方便查看gij的分布。
         plot_gxy(gxy=gij, scale_i=i, size=gain, flag='gij') #自己编的代码,用于查看gij的分布。
        gij = (gxy - offsets).long() #将所有targets中心点坐标进行偏移。

        gi, gj = gij.T  # grid xy indices

        # Append
        a = t[:, 6].long()  # anchor indices
        indices.append((b, a, gj, gi))  # image, anchor, grid indices
        tbox.append(torch.cat((gxy - gij, gwh), 1))  # box
        anch.append(anchors[a])  # anchors
        tcls.append(c)  # class

    return tcls, tbox, indices, anch
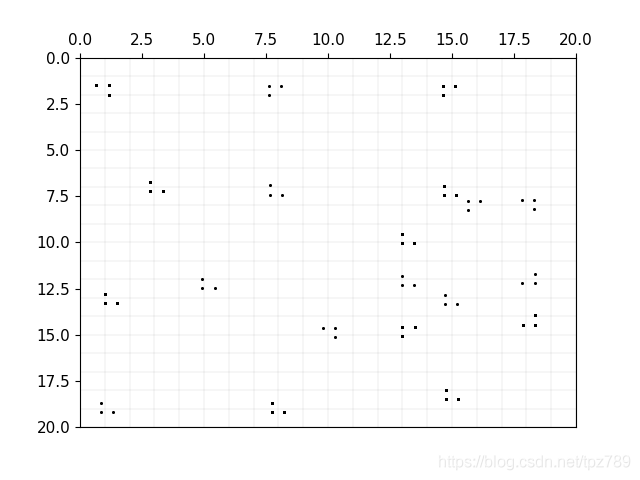
下图是20x20的特征图上的gij的分布示意图,从图中可以看出每个targets都扩充了2个临近的targets。关于为什么扩充,我还没理解,有知道的网友欢迎留言。另外,知乎网友Ancy贝贝的理解是:之前通过筛选,去掉了一些匹配不上anchor的gt,本来正样本就比负样本少很多,经过筛选,少得更多了,所以每个gt扩充2个出来,增加正样本比例。

    # Regression
    pxy = ps[:, :2].sigmoid() * 2. - 0.5
    pwh = (ps[:, 2:4].sigmoid() * 2) ** 2 * anchors[i]
    pbox = torch.cat((pxy, pwh), 1).to(device)  # predicted box
    giou = bbox_iou(pbox.T, tbox[i], x1y1x2y2=False, CIoU=True)  # giou(prediction, target)
    lbox += (1.0 - giou).mean()  # giou loss

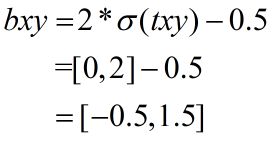
代码中的pxy对应bxy,ps[:, :2]对应txy。由此可知bxy的取值范围是[-0.5,1.5]。因此有可能偏移到临近的单元格内,但偏移不多,不知道作者是什么考虑的。

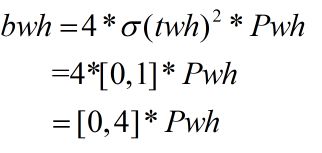
代码中的pwh对应bwh,anchors[i]对应Pwh。因此可知bwh的范围是[0,4]*Pwh。这和前面
j = torch.max(r, 1. / r).max(2)[0] < model.hyp[‘anchor_t’] # model.hyp[‘anchor_t’]=4 是一致的。
Objectness
tobj[b, a, gj, gi] = (1.0 - model.gr) + model.gr * giou.detach().clamp(0).type(tobj.dtype) # giou ratio
此处 tobj[b, a, gj, gi]用giou(真实的是ciou)取代1,代表该点对应置信度。为什么要用giou来代替,我也没想明白,有知道的网友欢迎留言。
其余的部分比较好理解,在此不再赘述。
附:
plot_gxy的代码:
def plot_gxy(gxy, scale_i, size, flag):
    s = int(size[2].cpu().numpy())
    ax = plt.subplot(111)
    ax.axis([0, s, 0, s])
    lxx = np.arange(0, s + 1, 1)
    lxx = np.repeat(lxx, s + 1, axis=0)
    lxx = lxx.reshape(s + 1, s + 1)
    lyy = np.arange(0, s + 1, 1)
    lyy = np.repeat(lyy, s + 1, axis=0)
    lyy = lyy.reshape(s + 1, s + 1)
    lyy = lyy.T


    for i in range(len(lxx)):
        plt.plot(lxx[i], lyy[i], color='k', linewidth=0.05, linestyle='-')
        plt.plot(lyy[i], lxx[i], color='k', linewidth=0.05, linestyle='-')

    for i in range(len(gxy)):
        x1, y1 = gxy.cpu().numpy().T
        plt.scatter(x1, y1, s=0.02, color='k')

    ax = plt.gca()  # 获取到当前坐标轴信息
    ax.xaxis.set_ticks_position('top')  # 将X坐标轴移到上面
    ax.invert_yaxis()
    plt.savefig("gxy_{}_{}.png".format(scale_i, flag))
    plt.close()