python对疫情数据爬取,可视化,词云
1.首先我们要找到对应的接口才能爬取到相应的数据,先找到腾讯疫情网址,如下
https://news.qq.com/hdh5/feiyanarea.htm#/

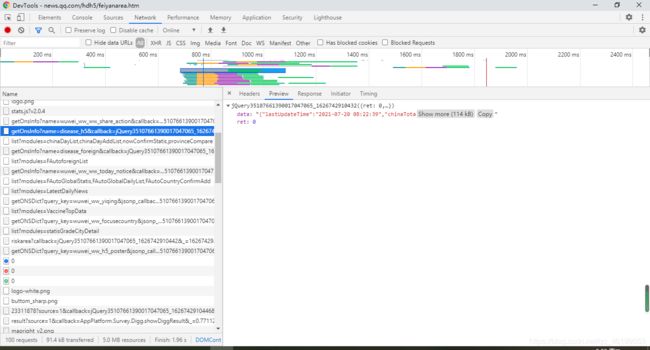
2.按F12,查看源代码:get是获取到数据,也就是我们爬取数据的一个接口,对于数据接口可能在变化,例如chinaDayAddList,chinaDayList原来是在图中的这个接口,后来腾讯将接口进行了改变,所以要获取这两个键的值,就需要从
https://api.inews.qq.com/newsqa/v1/query/inner/publish/modules/list?modules=chinaDayList,chinaDayAddList,nowConfirmStatis,provinceCompare这个接口对数据进行爬取,获取自己想要的数据。

3.搞定了接口,接下来就是对接口数据的了解


import time
import json
import requests
from datetime import datetime
import pandas as pd
import numpy as np

#画中国地图前的数据整理
def catch_data():
    url = 'https://view.inews.qq.com/g2/getOnsInfo?name=disease_h5'
    reponse = requests.get(url=url).json()
    # 返回数据字典
    data = json.loads(reponse['data'])
    return data
data = catch_data()
data.keys()
lastUpdateTime = data['lastUpdateTime']
# 数据明细,数据结构比较复杂,一步一步打印出来看,先明白数据结构
areaTree = data['areaTree']
# 国内数据
china_data = areaTree[0]['children']
china_list = []
wf=[]
for a in range(len(china_data)):
    province = china_data[a]['name']
    province_list = china_data[a]['children']
    wf.append(str(province))
    for b in range(len(province_list)):
        city = province_list[b]['name']
        total = province_list[b]['total']
        today = province_list[b]['today']
        china_dict = {}
        china_dict['province'] = province
        china_dict['city'] = city
        china_dict['total'] = total
        china_dict['today'] = today
        china_list.append(china_dict)
china_data = pd.DataFrame(china_list)
china_data.head()
print(wf)
# wf=list(wf)

def confirm(x):
    confirm = eval(str(x))['confirm']
    return confirm
def dead(x):
    dead = eval(str(x))['dead']
    return dead
def heal(x):
    heal =  eval(str(x))['heal']
    return heal
# 函数映射
china_data['confirm'] = china_data['total'].map(confirm)
china_data['dead'] = china_data['total'].map(dead)
china_data['heal'] = china_data['total'].map(heal)
china_data = china_data[["province","city","confirm","dead","heal"]]
china_data.head()
area_data = china_data.groupby("province")["confirm"].sum().reset_index()
area_data.columns = ["province","confirm"]
print(area_data )


def a():
    url="https://api.inews.qq.com/newsqa/v1/query/inner/publish/modules/list?modules=chinaDayList,chinaDayAddList,nowConfirmStatis,provinceCompare"
    res=requests.get(url)
    # print(res.text)
    d=json.loads(res.text)
    return d
a=a()
# print(a["data"].keys())
# print(a["data"]["chinaDayList"])
chinaDayAddList = pd.DataFrame(a["data"]['chinaDayAddList'])
chinaDayAddList = chinaDayAddList[['date','confirm','suspect','dead','heal']]


#画图
from pyecharts.charts import * #导入所有图表
from pyecharts import options as opts
#导入pyecharts的主题(如果不使用可以跳过)
from pyecharts.globals import ThemeType

bar = Bar(init_opts=opts.InitOpts(theme=ThemeType.WESTEROS,width = '1000px',height ='500px'))
bar .add_xaxis(list(chinaDayAddList["date"]))
bar .add_yaxis("确诊", list(chinaDayAddList["confirm"]))
bar .add_yaxis("疑似", list(chinaDayAddList["suspect"]))
bar .add_yaxis("死亡", list(chinaDayAddList["dead"]))
bar .add_yaxis("治愈", list(chinaDayAddList["heal"]))
bar .set_global_opts(title_opts=opts.TitleOpts(title="每日新增数据趋势"))
bar.render_notebook()


#日数据处理
chinaDayList = pd.DataFrame(a['data']['chinaDayList'])
chinaDayList = chinaDayList[['date','confirm','suspect','dead','heal']]
da=chinaDayList.head()
print(da)

#治疗和死亡
line1 = Line(init_opts=opts.InitOpts(theme=ThemeType.WESTEROS,width = '1000px',height ='500px'))
line1.add_xaxis(list(chinaDayAddList["date"]))
line1.add_yaxis("治愈",list(chinaDayAddList["heal"]),is_smooth=True)
line1.add_yaxis("死亡", list(chinaDayAddList["dead"]),is_smooth=True)
line1.set_global_opts(title_opts=opts.TitleOpts(title="Line1-治愈与死亡趋势"))
line1.render_notebook()

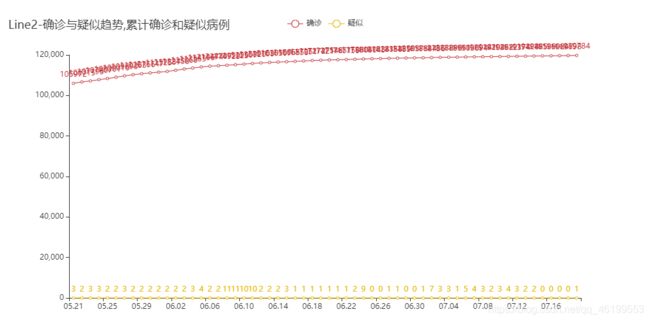
line2 = Line(init_opts=opts.InitOpts(theme=ThemeType.SHINE,width = '1000px',height ='500px'))
line2.add_xaxis(list(chinaDayList["date"]))
line2.add_yaxis("确诊",list(chinaDayList["confirm"]))
line2.add_yaxis("疑似", list(chinaDayList["suspect"]))
line2.set_global_opts(title_opts=opts.TitleOpts(title="Line2-确诊与疑似趋势,累计确诊和疑似病例"))
line2.render_notebook()


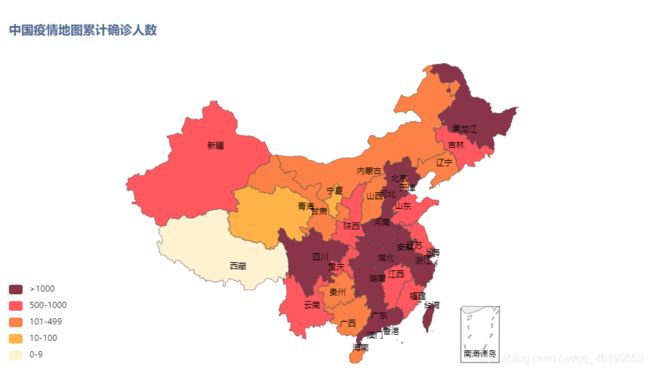
#画中国地图
area_data = china_data.groupby("province")["confirm"].sum().reset_index()
area_data.columns = ["province","confirm"]
area_map = Map(init_opts=opts.InitOpts(theme=ThemeType.WESTEROS))
area_map.add("",[list(z) for z in zip(list(area_data["province"]), list(area_data["confirm"]))], "china",is_map_symbol_show=False)
area_map.set_global_opts(title_opts=opts.TitleOpts(title="中国疫情地图累计确诊人数"),visualmap_opts=opts.VisualMapOpts(is_piecewise=True,
                pieces = [
                        {"min": 1001 , "label": '>1000',"color": "#893448"}, #不指定 max,表示 max 为无限大
                        {"min": 500, "max": 1000, "label": '500-1000',"color": "#ff585e"},
                        {"min": 101, "max": 499, "label": '101-499',"color": "#fb8146"},
                        {"min": 10, "max": 100, "label": '10-100',"color": "#ffb248"},
                        {"min": 0, "max": 9, "label": '0-9',"color" : "#fff2d1" }]))
area_map.render_notebook()

from wordcloud import WordCloud,ImageColorGenerator,STOPWORDS
import jieba
import numpy as np
import PIL.Image as Image
import matplotlib.pyplot as plt
mask=np.array(Image.open("img.png"))
wordcloud=WordCloud(background_color='white',max_words=10000,font_path="C:/Windows/Fonts/simkai.ttf",stopwords=STOPWORDS,mask=mask).generate(str(wf))
image=wordcloud.to_image()
image.show()

page = Page()
page.add(line1)
page.add(bar)
page.add(line2)
page.add(area_map)
print(page.render("疫情数据可视化.html"))
5.对于词云需要自己去网上下载一个中国地图,如果是pytharm,直接放在对应的包下面,就可以直接使用


