相关性分析
addmodule_ns7d_dataframe与PAGE_enrichments相关性
addmodulescore得到的每个细胞评分与page_enrichments得到的每个细胞评分的相关性
library(patchwork)
library(ggplot2)
library(ggalluvial)
library(svglite)
library(Seurat)
library(openxlsx)
library(Hmisc)
getwd()
path="G:/silicosis/sicosis/silicosis_ST/overlapped_map/addmodule_ns7d"
dir.create(path)
setwd(path)
load("G:/silicosis/需求/矽肺-数据分析结果-0119-yll/矽肺-数据分析结果-0119/single_slide_cluster/silicosis_ST_NS_7_SCT_r0.5.rds")
table(Idents(NS_7_sct))
marker = read.xlsx("G:/silicosis/sicosis/gitto/myspatial/SingCellMarkers.xlsx",
sheet='selected_markers')
head(marker)
library(dplyr)
marker=marker[,-1]
cellnames=colnames(marker)
for (each in cellnames) {
cellname=each
mymarker=marker[,cellname] %>% na.exclude() %>% unique() %>%
capitalize() %>% list()
number=length(mymarker[[1]])
unlist(mymarker)
if(1==1){NS_7_sct=AddModuleScore(NS_7_sct,
features = mymarker,
name = paste0(cellname,"_Addmodule"))
colnames(NS_7_sct@meta.data)
}
}
colnames(NS_7_sct@meta.data)
mydata=FetchData(NS_7_sct,vars = colnames(NS_7_sct@meta.data))
head(mydata)
data=mydata[,-c(1:8)]
head(data)
getwd()
load("G:/silicosis/sicosis/silicosis_ST/overlapped_map/addmodule_ns7d/addmodule_ns7d_dataframe.rds")
if(1==1){library(svglite)
library(Seurat)
library(xlsx)
library(Giotto)
load("G:/silicosis/需求/矽肺-数据分析结果-0119-yll/矽肺-数据分析结果-0119/single_slide_cluster/silicosis_ST_NS_7_SCT_r0.5.rds")
table(Idents(NS_7_sct))
load("G:/silicosis/需求/矽肺-数据分析结果-0119-yll/矽肺-数据分析结果-0119/single_slide_cluster/silicosis_ST_SiO2_7_SCT_r0.6.rds")
Idents(sio2_7_sct)
load("G:/silicosis/需求/矽肺-数据分析结果-0119-yll/矽肺-数据分析结果-0119/single_slide_cluster/silicosis_ST_NS_56_SCT_r0.5.rds")
table(Idents(NS_56_sct))
load(file = "G:/silicosis/需求/矽肺-数据分析结果-0119-yll/矽肺-数据分析结果-0119/single_slide_cluster/silicosis_ST_SiO2_56_SCT_r0.5_true.rds")
table(Idents(sio2_56_sct))
getwd()
path="G:/silicosis/sicosis/gitto/seurat/ns7d-2"
dir.create(path,recursive = TRUE)
setwd(path)
load("G:/silicosis/需求/矽肺-数据分析结果-0119-yll/矽肺-数据分析结果-0119/single_slide_cluster/silicosis_ST_NS_7_SCT_r0.5.rds")
table(Idents(NS_7_sct))
DefaultAssay(NS_7_sct)
str(NS_7_sct)
seuratToGiotto_OLD <- function(obj_use = NULL,...){
require(Seurat)
require(Giotto)
obj_assays <- names(obj_use@assays)
if ('Spatial' %in% obj_assays){
obj_assays <- c('Spatial',obj_assays[-which(obj_assays == 'Spatial')])
}
obj_dimReduc <- names(obj_use@reductions)
obj_dimReduc_assay <- sapply(obj_dimReduc,function(x)
obj_use[[x]]@assay.used)
obj_graph_expr <- names(obj_use@graphs)
obj_graph_expr_assay <- sapply(obj_graph_expr,function(x)
obj_use[[x]]@assay.used)
obj_meta_cells <- obj_use@meta.data
obj_meta_genes <- lapply(obj_assays,function(x)
obj_use[[x]]@meta.features)
names(obj_meta_genes) <- obj_assays
obj_img <- obj_use@images
obj_img_names <- names(obj_img)
loc_use <- lapply(obj_img_names,function(x){
temp <- obj_img[[x]]@coordinates
temp <- as.data.frame(temp[,c('col','row')])
return (temp)
})
loc_use <- Reduce(rbind,loc_use)
for (i in c(2) ){
data_raw <- GetAssayData(obj_use,slot = 'counts',assay = obj_assays[i])
data_norm <- GetAssayData(obj_use,slot = 'data',assay = obj_assays[i])
data_scale <- GetAssayData(obj_use,slot = 'scale.data',assay = obj_assays[i])
if (1==1){
feat_use <- 'rna'
test <- createGiottoObject(raw_exprs = obj_use[[obj_assays[i]]]@counts,
norm_expr=data_norm,
spatial_locs = loc_use
)
test <- addCellMetadata(test,new_metadata = obj_meta_cells)
} else {
feat_use <- obj_assays[i]
test@expression[[feat_use]][['raw']] <- data_raw
test@feat_ID[[feat_use]] = rownames(data_raw)
test@feat_metadata[[feat_use]] = data.table::data.table(feat_ID = test@feat_ID[[feat_use]])
}
for (i in obj_dimReduc){
if (!i %in% c('pca','umap','tsne')){
next
} else {
dimReduc_name <- i
dimReduc_method <- i
dimReduc_coords <- obj_use[[i]]@cell.embeddings
dimReduc_misc <- list(obj_use[[i]]@stdev,
obj_use[[i]]@feature.loadings,
obj_use[[i]]@feature.loadings.projected)
names(dimReduc_misc) <- c('eigenvalues','loadings','loadings_projected')
dimObject <- Giotto:::create_dimObject(name = dimReduc_name,reduction_method = dimReduc_method,
coordinates = dimReduc_coords,misc = dimReduc_misc)
test@dimension_reduction[['cells']][[dimReduc_method]][[dimReduc_name]] <- dimObject
}
}
for (i in obj_graph_expr){
mtx_use <- obj_use[[i]]
ig_use <- igraph::graph_from_adjacency_matrix(mtx_use,weighted = T)
g_type <- unlist(strsplit(i,split = "_"))[2]
g_val <- i
test@nn_network[[g_type]][[g_val]][['igraph']] <- ig_use
}
return (test)
}
}
Assays(NS_7_sct@assays$SCT)
NS_7_sct@assays$SCT@scale.data
NS_7_sct_giotto=seuratToGiotto_OLD(NS_7_sct)
getwd()
library(openxlsx)
library(Hmisc)
brain_sc_markers = read.xlsx("G:/silicosis/sicosis/gitto/myspatial/SingCellMarkers.xlsx",
sheet='Sheet2')
head(brain_sc_markers)
topper_column=capitalize(colnames(brain_sc_markers))
colnames(brain_sc_markers)=topper_column
topper_markers=capitalize(brain_sc_markers$Event)
head(topper_markers)
brain_sc_markers$Event=topper_markers
head(brain_sc_markers)
sig_matrix = as.matrix(brain_sc_markers[,-1]); rownames(sig_matrix) = brain_sc_markers$Event
sig_matrix[is.na(sig_matrix)] <- 0
head(sig_matrix)
visium_brain=NS_7_sct_giotto
visium_brain = createSpatialEnrich(visium_brain,
sign_matrix = sig_matrix,
enrich_method = 'PAGE',
min_overlap_genes = 1)
visium_brain = runPAGEEnrich(gobject = visium_brain,
sign_matrix = sig_matrix,
min_overlap_genes = 0)
getwd()
cell_types = colnames(sig_matrix)
head(cell_types)
length(cell_types)
plotMetaDataCellsHeatmap(gobject = visium_brain,
metadata_cols = 'seurat_clusters',
value_cols = cell_types,spat_enr_names = 'PAGE',
x_text_size = 8, y_text_size = 8,
save_param = list(save_name="7_a-_metaheatmap"))
getwd()
load("G:/silicosis/sicosis/gitto/seurat/ns7d-2/ns_7d_sct_giotto.rds")
str(NS_7_sct_dwl)
getwd()
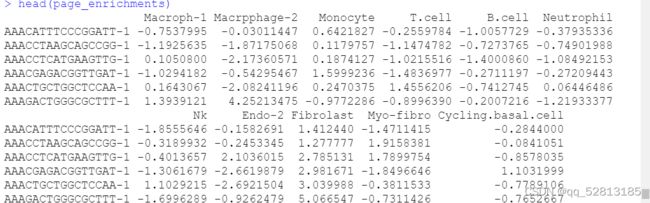
page_enrichments=as.data.frame(visium_brain@spatial_enrichment$PAGE)
head(page_enrichments)
rownames(page_enrichments)<-page_enrichments$cell_ID
page_enrichments=page_enrichments[,-1]
head(page_enrichments)
class(page_enrichments)
}
load("G:/silicosis/sicosis/gitto/seurat/ns7d-2/PAGE_enrichments.rds")
head(data)
head(page_enrichments)

mydata=bind_cols(data,page_enrichments)
head(mydata)

cor_data <- cor(mydata,method="pearson")
cor_data2 <- cor(mydata,method="spearman")
cor_data[1:5,1:5]
p.mat <- ggcorrplot::cor_pmat(mydata)
head(p.mat[, 1:4])
library(corrplot)
corrplot(cor_data)
p=corrplot(cor_data,order="hclust",hclust.method="average")
ggcorrplot::ggcorrplot(cor_data,hc.order=TRUE,outline.color="white")
p=ggcorrplot::ggcorrplot(cor_data,outline.color="white")
p=ggcorrplot::ggcorrplot(cor_data,outline.color="white", p.mat = p.mat,
hc.order = TRUE,
type = "lower",
insig = "blank")
p=ggcorrplot::ggcorrplot(cor_data,outline.color="white", p.mat = p.mat,
hc.order = TRUE,
insig = "blank")
p=ggcorrplot::ggcorrplot(
cor_data,
p.mat = p.mat,
insig = "blank"
)
jpeg("correaltaion-67.jpeg",width = 20,height = 20,units = 'in', res=600)
print(p)
dev.off()
##测试用
for (each in cellnames) {
 # each="macroph-1"
  cellname=each

  mymarker=marker[,cellname]   %>% na.exclude() %>% unique() %>%
    capitalize()    %>% list()
  number=length(mymarker[[1]])
  unlist(mymarker)

  #对给定的基因集合进行打分  并画图
  if(1==1){NS_7_sct=AddModuleScore(NS_7_sct,
                                features = mymarker,
                                name = "mymarker")
  #结果保存在这里
  colnames([email protected])

  ###

  p1=SpatialFeaturePlot(d.all, features = "mymarker1", slot = "scale.data",images = "image")+ ggtitle(paste(unlist(mymarker), collapse = "|"))
  p2=SpatialFeaturePlot(d.all, features = "mymarker1", slot = "scale.data",images = "image.1")
  p3=SpatialFeaturePlot(d.all, features = "mymarker1", slot = "scale.data",images = "image.2")+ ggtitle(paste(cellname))
  p4=SpatialFeaturePlot(d.all, features = "mymarker1", slot = "scale.data",images = "image.3")

  jpeg(paste0(cellname,"_","total_",length(unlist(mymarker)),"_",paste0(min(number),"-",max(number)),
              paste(unlist(mymarker)[1:15],collapse = "_"),"_.jpeg"), #只取前15个
       height = 12, width = 12, units = 'in', res=600)
  p=ggpubr::ggarrange(p1,p2,p3,p4,ncol = 2,nrow =2)
  print(p)
  dev.off()}
}
··
if(1==1){
names(d.all)
SpatialFeaturePlot(d.all, features = "mymarker1", slot = "scale.data")+
ggtitle(paste(unlist(mymarker), collapse = "|"))
SpatialFeaturePlot(d.all, features = "mymarker1", slot = "scale.data")+
theme(plot.title =element_text(paste(unlist(mymarker), collapse = "|")) )
SpatialFeaturePlot(d.all, features = "mymarker1", slot = "scale.data")+
labs(title = paste(unlist(mymarker), collapse = "|"),
colour="Cylinders")
}