集成学习boosting算法:Adaboost&GBDT&Xgboost&LightGBM&CatBoost + 超参数优化 + 模型保存 (更ing)
Adaboost&GBDT&Xgboost&LightGBM&CatBoost
- 0简介
-
- 0.0发展史
- 0.1 经典文章链接/文章总结链接
- 0.2 bagging和boosting
- 0.3 简记
-
- 0.3.0 mean_squared_error
- 1 Adaboost
- 2 GBDT
-
- 2.1 参数和概述
- 2.1 init
-
- 2.1.1 model
- 2.1.2 zero
- 2.1.3 None(sklearn默认)
- 2.1.4 测试
- 2.2 loss
-
- 2.2.1 分类loss
- 2.2.2 回归loss
- 2.2.3 回归损失的选择
- 2.2.4 探究离群值对不同的loss的影响
- 2.3 min_impurity_decrease
- 2.4 n_estimators&learning_rate
- 2.5 warm_start
-
- 2.5.1 增量学习
- 2.5.2 确定巨量csv文件中样本条数
- 2.5.3 增量学习过程
- 2.6 GBDT回归树实现分类的方式
-
- 2.6.1 二分类模型
- 2.6.2 多分类问题
- 2.7 接口(属性)
-
- 2.7.1 所有接口
- 2.7.2 接口estimators_体现出来的问题
- 2.8 和其他集成算法对比的效果
- 2.9 调参代码
-
- 2.9.1 boosting算法调参思想
- 2.9.1 调参过程代码
- 3 Xgboost
-
- 3.1 参数
-
- 3.1.0 参数建议
- 3.1.1 sklearn接口
- 3.1.2 原生库(只写了重要的)
- 3.2 学习曲线(没啥用)
- 3.3 n_estimators参数对于模型的影响
-
- 3.3.1 只考虑 R 2 R^2 R2
- 3.3.2 考虑泛化误差
- 3.3.3 精细化确定泛化误差
- 3.3.4 以上三者的对比
- 3.4 subsample对模型的影响
- 3.6 scale_pos_weight权重平衡(分类)
- 3.5 使用原生库调参数
- LightGBM
- CatBoost
- 6 问题
-
- 6.1 RF和GBDT之间区别
- 6.2 XGBoost和GBDT之间区别
- 6.3 XGBoost是如何防止过拟合的
- 6.4 GBDT中的步长
- 6.5 boosting和bagging区别
- 6.6 GBDT优缺点
- 6.7 XGBoost优缺点
- 7 超参数优化
-
- 7.1 网格搜索类
-
- 7.1.1 枚举网格搜索
- 7.1.2 随机网格搜索
- 7.1.3 对半网格搜索(Halving Grid Search)
- 7.2 贝叶斯超参数优化(推荐)
-
- 7.2.1 BayesOpt实现高斯过程GP(较慢)
-
- 7.2.1.1 定义目标函数
- 7.2.1.2 定义参数空间
- 7.2.1.3 定义优化目标函数和具体流程
- 7.2.1.4 验证(非必要)
- 7.2.1.5 执行
- 7.2.2 hyperopt贝叶斯方法(推荐)
-
- 7.2.2.1 导包--导入数据--init初始学习器的建立
- 7.2.2.2 定义目标函数
- 7.2.2.3 参数空间的确定
- 7.2.2.4 定义优化目标函数
- 7.2.2.5 验证函数(非必要)
- 7.2.2.6 执行和建议
- 模型存储和读取
- 总体来说,boosting算法还是需要大量的数据集的,因为模型相对于单一的学习器来说还是比较复杂的,数据简单就更不能用subsample了
0简介
0.0发展史
| 年份 | 算法/理论 | 成就/改进 |
|---|---|---|
| 1988 | General Boosting | 先前的弱评估器上预测错误的样本应该在后续得到更多关注 |
| 1997 | AdaBoost | 从0到1,首次在工程上实现了boosting理论 确立了决策树作为弱评估器,生长规则为C4.5 自适应地调整数据分布 自适应地计算每个弱分类器的权重 |
| 2000 | GBDT 在ADB基础上改进 |
更新损失函数 L ( x , y ) L(x,y) L(x,y),在数学流程上推广到任意可微函数 放弃调整数据分布、放弃弱分类器权重 自适应地调整后续弱评估器拟合的目标 |
| 2014 | XGBoost 在GBDT基础上改进 |
更新损失函数 L ( x , y ) L(x,y) L(x,y),在损失函数中加入正则项 改进弱评估器 f ( x ) f(x) f(x)生长规则,自适应地调整后续弱评估器的结构 改进拟合中的数学过程,提升拟合精度 首次在工程上实现了boosting树的并行,提升运算速度 支持GPU加速 |
| 2016 | LGBM 在GBDT基础上改进 受XGBoost启发 |
改进弱评估器 f ( x ) f(x) f(x)生长规则,自适应地调整后续弱评估器的结构 设计了适合于GBDT的数据分布调整方式GOSS,自适应地调整数据分布 设计了加速弱分类器分枝的计算方式EFB,在工程上大幅度降低了运算时间与内存消耗 支持GPU加速 |
| 2017 | CatBoost 在GBDT基础上改进 受XGBoost启发 |
改进弱评估器 f ( x ) f(x) f(x)生长规则,自适应地调整后续弱评估器的结构 设计了适用于梯度下降的弱分类器权重调整方式,自适应地调整弱分类器的权重 改进离散型变量的分枝方式,提升拟合精度 支持GPU加速 |
0.1 经典文章链接/文章总结链接
GBDT算法推导-------刘建平
XGBoost 知乎答主写的这一篇太棒了
XGBoost算法参数---------刘建平
GBDT和XGBoost区别
B站菜菜的机器学习
0.2 bagging和boosting
- bagging实际上本质就是通过单一的弱模型通过加权或投票等(可以并行)的方式生成新的强学习器,我们常见的还是通过多个决策树级集成形成的强学习器随机森林,本质上和模型融合相似,不过模型融合主要是融合不同的模型,也就是多种模型集成形成的集成模型。
- boosting是通过若干个弱评估器通过递进的方式集成形成的强学习器,bagging可能是由多个强学习器组成弱评估器,boosting是弱评估器,效果为啥在一定程度上比bagging更加有效?是因为boosting还是通过想着损失函数极小化方向进行,虽然说是弱评估器,叠加起来却能很好的拟合结果,并在一定程度上抗过拟合的发生,但是也不能说不可能发生过拟合,毕竟boosting算法是较为复杂的学习器,在样本数据集简单时还是很容易发生过拟合的现象,抗过拟合的能力还是相对于bagging特别是随机森林来说的。
0.3 简记
0.3.0 mean_squared_error
sklearn.metrics.mean_squared_error( y_true, # 真实值
								    y_pred, # 预测值
								    squared=True,
								    # True 表示MSE均方误差
								    # False 表示RMSE均方根误差
								    )
1 Adaboost
- 通过对每次预测错或者残差较大的数据样本调整数据权值分布间接影响后续的评估器模型结果。
- 实际上Adaboost除了在算法推到中和GBDT,Xgboost不同之外,还有是使用的基学习器和其他不同,在Adaboost中分类是DecisionTreeClassifier,回归是DecisionTreeRegressor两种弱学习器,其他boosting学习算法使用都是回归学习算法,再通过softmax或signomid函数转化成分类问题。
sklearn.ensemble.AdaBoostClassifier(
    base_estimator=None,  # 自定义弱评估器,默认CART树
    n_estimators=50,  # 默认创建50棵树模型,小了欠拟合,大了过拟合
    learning_rate=1.0,  # 学习率
    algorithm="SAMME.R",
    # 个参数只有AdaBoostClassifier有。主要原因是scikit - learn实现了两种Adaboost分类算法,SAMME和SAMME.R。
    # 两者的主要区别是弱学习器权重的度量,SAMME使用了和我们的原理篇里二元分类Adaboost算法的扩展,即用对样本集分类效果作为弱学习器权重
    # 而SAMME.R使用了对样本集分类的预测概率大小来作为弱学习器权重。由于SAMME.R使用了概率度量的连续值,迭代一般比SAMME快
    # 因此AdaBoostClassifier的默认算法algorithm的值也是SAMME.R。我们一般使用默认的SAMME.R就够了,但是要注意的是使用了SAMME.R,
    # 则弱分类学习器参数base_estimator必须限制使用支持概率预测的分类器。SAMME算法则没有这个限制
    random_state=None,  # 随机起始点
)

sklearn.ensemble.AdaBoostRegressor(
    base_estimator=None,  # 基学习器
    n_estimators=50,  # 弱学习器的数量
    learning_rate=1.0,
    loss="linear",
    # 只有在回归模型中存在有线性‘linear’, 平方‘square’和指数 ‘exponential’三种选择
    # 代表每次对于预测误差较大的数据样本点的关注度,在经典adaboost中使用的是指数更新迭代权重,不过一般使用默认的linear足够
    random_state=None,
)
这个模型没啥说的,比较简单,只要推一遍理论就能完全理解这个东西都是干嘛用的了。
2 GBDT
2.1 参数和概述
- 和Xgboost相似都是通过弱评估器对于残差进行拟合:
- 依据上一个弱评估器 f ( x ) t − 1 f(x)_{t-1} f(x)t−1 的结果,计算损失函数 L ( x , y ) L(x, y) L(x,y) , 并使用 L ( x , y ) L(x, y) L(x,y) 自适应地影响下一个弱评估器 f ( x ) t f(x)_{t} f(x)t 的构建集成模型输出的结果,受到整体所有弱评估器 f ( x ) 0 ∼ f ( x ) T f(x)_{0} \sim f(x)_{T} f(x)0∼f(x)T 的影响。
- GBDT基学习器都是回归模型
- GBDT以向前阶段的方式构建一个加法模型,它允许优化任意可微损失函数,损失函数有较多的选择。
- 在GBDT算法实现时使用了随机森林的思想(subsample),在创建新的拟合树模型时,可以允许通过随机抽取部分样本数据和特征进行树的构建,增大了软评估器之间的独立性(因此存在了袋外数据)。当弱评估器表现在数据上不稳定时可以通过该方法增加稳定性。但是不适用于样本数据较小的情况。
参数简介
| 参数相关的流程 | 参数 |
|---|---|
| 损失函数 | loss, alpha |
| 集成规则 | init, subsample, learning_rate |
| 弱评估器 | n_estimators, criterion |
| 弱评估器(抗过拟合) | min_samples_split, min_samples_leaf, min_weight_fraction_leaf, max_depth, min_impurity_decrease, max_features, max_leaf_nodes, ccp_alpha |
| 训练流程(结果监控) | verbose |
| 训练流程(提前停止) | validation_fraction, n_iter_no_change, tol |
| 训练流程(增量学习) | warm_start |
| 随机性控制 | random_state |
sklearn.ensemble.GradientBoostingClassifier(
    loss="deviance",  # 下面说
    init=None,  # 下面说
    min_impurity_decrease=0.0,  # 下面说
    learning_rate=0.1,  # 学习率:通过“learning_rate”缩小每棵树的贡献。在学习率和n_estimators之间有一个折中
    n_estimators=100,  # 创建树的个数,梯度提升对过度拟合相当健壮,因此通常很大导致更好的性能, 但是会造成过拟合
    subsample=1.0,  # 每次创建树模型使用的样本数量比重
    random_state=None,
    verbose=0,  # 监控模型的创建

    criterion="friedman_mse",  # {'friedman_mse','squared_error','mse','mae'默认值='friedman_mse'
    min_samples_split=2,  # CART树分节点最小样本量
    min_samples_leaf=1,  # 叶子节点最少样本量
    min_weight_fraction_leaf=0.0,  # 权重总和的最小加权分数(所有输入样本)需要位于叶节点。样品有未提供 sample_weight 时,权重相等
    max_depth=3,  # CART树最大生长深度
    max_features=None,  # 单棵树最大使用的特征数量,因为max_depth最大3,这个参数就显得鸡肋{'auto', 'sqrt', 'log2'},
    max_leaf_nodes=None,  # 以最佳优先方式使用“max_leaf_nodes”种植树。最佳节点定义为杂质的相对减少。如果 None 则无限数量的叶节点

    warm_start=False, # 增量学习,见下
    validation_fraction=0.1,# 仅在设置n_iter_no_change时有用,通过设置一定的验证数据,对模型早停标准进行检测。默认值为0.1。
    n_iter_no_change=None, # 若模型连续n_iter_no_change次更新,模型的损失函数增益均在tol范围内,则停止更新。默认值为None禁用
    tol=1e-4, # 若模型连续n_iter_no_change次更新,模型的损失函数增益均在tol范围内,则停止更新。默认值为1e-4
    ccp_alpha=0.0,
)

sklearn.ensemble.GradientBoostingRegressor(
    loss="squared_error",  # 下面说
    alpha=0.9,  # 对应损失函数中的一个huber,quantile
    init=None,  # 下面说
    min_impurity_decrease=0.0,  # 下面说
    learning_rate=0.1,  # 学习率:通过“learning_rate”缩小每棵树的贡献。在学习率和n_estimators之间有一个折中
    n_estimators=100,  # 创建树的个数,梯度提升对过度拟合相当健壮,因此通常很大导致更好的性能, 但是会造成过拟合
    subsample=1.0,  # 每次创建树模型使用的样本数量比重
    random_state=None,
    verbose=0,  # 监控模型的创建


    criterion="friedman_mse",  # {'friedman_mse','squared_error','mse','mae'默认值='friedman_mse'
    min_samples_split=2,  # CART树分节点最小样本量
    min_samples_leaf=1,  # 叶子节点最少样本量
    min_weight_fraction_leaf=0.0,  # 权重总和的最小加权分数(所有输入样本)需要位于叶节点。样品有未提供 sample_weight 时,权重相等
    max_depth=3,  # CART树最大生长深度
    max_features=None,  # 单棵树最大使用的特征数量,因为max_depth最大3,这个参数就显得鸡肋{'auto', 'sqrt', 'log2'},
    max_leaf_nodes=None,  # 以最佳优先方式使用“max_leaf_nodes”种植树。最佳节点定义为杂质的相对减少。如果 None 则无限数量的叶节点

    # 同上
    warm_start=False,
    validation_fraction=0.1,
    n_iter_no_change=None,
    tol=1e-4,
    ccp_alpha=0.0,
)
GBDT参数影响力:

m a x _ d e p t h max\_depth max_depth:本来默认就是3,本来接不深,因为他是一个boosting,多个CART树集成形成,所以通过减小该参数调整不能很好地抗过拟合,和随机森林bagging有很大区别。若boosting学习能力不好,增大该参数可以增加学习能力,所以这个参数经常在学习能力不足时调大以增强学习能力。
boosting天生也擅长拟合小样本高纬度数据,若在小样本中过拟合了,说明数据维度不高,尽力不用boosting了。
2.1 init
i n i t : { " z e r o " , N o n e , m o d e l } init:\{"zero", None,model\} init:{"zero",None,model}
这个参数一般不主动调参,因为需要较大的算力,若有足够算力,就可以网格搜索进行调参。
在第一棵树创建时:
H 1 ( x i ) = H 0 ( x i ) + ϕ 1 f 1 ( x i ) H_{1}\left(x_{i}\right)=H_{0}\left(x_{i}\right)+ \phi_{1} f_{1}\left(x_{i}\right) H1(xi)=H0(xi)+ϕ1f1(xi)
在GBDT算法推导时默认zero,但是我们使用时并不是这样,因为效果不好。
2.1.1 model
通常选择 H 0 ( x i ) H_0(x_i) H0(xi)是一个常见好的评估器,前提是必须具备 f i t fit fit和 p r e d i c t _ p r o b a predict\_proba predict_proba接口,可以是决策树,随机森林,逻辑回归,GBDT(可以,但是…),朴素贝叶斯等
2.1.2 zero
将 H 0 ( x i ) H_0(x_i) H0(xi)置为全0
2.1.3 None(sklearn默认)
会自动选择DummyEstimator类中的随机简单的模型预测结果,和zero结果差不多。
2.1.4 测试
from sklearn.tree import DecisionTreeRegressor as DTR
from sklearn.model_selection import KFold,cross_validate
from sklearn.ensemble import RandomForestRegressor as RFR,GradientBoostingRegressor as GBR
from sklearn.datasets import load_boston

X=load_boston().data
y=load_boston().target
tree_reg = DTR(random_state=1000)
rf = RFR(max_features='sqrt', n_estimators=68, max_depth=10,
         criterion='squared_error', n_jobs=-1, random_state=15234,)
for init in [tree_reg, rf, "zero", None]:
    reg = GBR(init=init, random_state=12432)
    cv = KFold(n_splits=5, shuffle=True, random_state=2432)
    result_reg = cross_validate(reg, X, y, cv=cv, scoring="neg_root_mean_squared_error",
                                return_train_score=True, n_jobs=-1)
    print("\n"+str(init))
    print(abs(result_reg["train_score"].mean()))
    print(abs(result_reg["test_score"].mean()))

数据可能太简单了,没有充分展现init设置为随机森林的优势
"""
init参数为:DecisionTreeRegressor(random_state=1000)
0.0
4.479982852526829

init参数为:RandomForestRegressor(max_depth=10, max_features='sqrt', n_estimators=68,
                      n_jobs=-1, random_state=15234)
0.7010386986200121
3.2401778542930293

init参数为:zero
1.346408702672974
3.22570734810666

init参数为:None
1.346408569325733
3.203902874876255
"""
2.2 loss
2.2.1 分类loss
分 类 l o s s : { " d e v i a n c e " , " e x p o n e n t i a l " } 分类loss:\{"deviance", "exponential"\} 分类loss:{"deviance","exponential"}
deviance二分类交叉熵损失(常用):
L = − ( y i log p ( x i ) + ( 1 − y i ) log ( 1 − p ( x i ) ) ) L=-\left(y_{i} \log p\left(x_{i}\right)+\left(1-y_{i}\right) \log \left(1-p\left(x_{i}\right)\right)\right) L=−(yilogp(xi)+(1−yi)log(1−p(xi)))
- 注意, l o g log log当中输入的一定是概率值。对于逻辑回归来说,概率就是算法的输出,因此我们可以认为逻辑回 归中 p = H ( x ) p=H(x) p=H(x) ,但对于 G B D T GBDT GBDT来说, p ( x i ) = Sigmoid ( H ( x i ) ) p\left(x_{i}\right)=\operatorname{Sigmoid}\left(H\left(x_{i}\right)\right) p(xi)=Sigmoid(H(xi)) ,这一点一定要注意。
deviance多分类交叉熵损失(常用):
L = − ∑ c = 1 K y c ∗ log ( P k ( x ) ) L=-\sum_{c=1}^{K} y_{c}^{*} \log \left(P^{k}(x)\right) L=−c=1∑Kyc∗log(Pk(x))
- 其中, P k ( x ) 是 概 率 值 , 对 于 多 分 类 P^{k}(x) 是概率值,对于多分类 Pk(x)是概率值,对于多分类GBDT$来说, p k ( x ) = Softmax ( H k ( x ) ) p^{k}(x)=\operatorname{Softmax}\left(H^{k}(x)\right) pk(x)=Softmax(Hk(x)) 。 y ∗ y^{*} y∗ 是由真实标签转化后的向量,下是转换公式。
y j ∗ = { 1 , 若 y ˆ j = y 0 , e l s e ( j = 1 , 2... K ) y_j^*= \begin{cases} 1, &\text{若 } \text{\^y}_j= y\\ 0, &else \end{cases} ~~~~(j=1,2...K) yj∗={1,0,若 yˆj=yelse (j=1,2...K)
exponential二分类指数损失
L = e − y H ( x ) L=e^{-yH(x)} L=e−yH(x)
exponential多分类指数损失
L = exp ( − 1 K y ∗ ⋅ H ∗ ( x ) ) = exp ( − 1 K ( y 1 H 1 ( x ) + y 2 H 2 ( x ) + … + y k H k ( x ) ) ) \begin{aligned} L &=\exp \left(-\frac{1}{K} y^{*} \cdot \boldsymbol{H}^{*}(x)\right) \\ &=\exp \left(-\frac{1}{K}\left(y^{1} H^{1}(x)+y^{2} H^{2}(x)+\ldots+y^{k} H^{k}(x)\right)\right) \end{aligned} L=exp(−K1y∗⋅H∗(x))=exp(−K1(y1H1(x)+y2H2(x)+…+ykHk(x)))
- 一般不使用,会退化成Adaboost
2.2.2 回归loss
回 归 l o s s : { ′ s q u a r e d e r r o r ′ , ′ a b s o l u t e e r r o r ′ , ′ h u b e r ′ , ′ q u a n t i l e ′ } 回归loss:\{'squared_error', 'absolute_error', 'huber', 'quantile'\} 回归loss:{′squarederror′,′absoluteerror′,′huber′,′quantile′}
squared_error平方误差
L = ∑ ( y i − H ( x i ) ) 2 . L=\sum\left(y_{i}-H\left(x_{i}\right)\right)^{2}. L=∑(yi−H(xi))2.
absolute_error绝对误差
L = ∑ ∣ ∑ i j − H ( x i ) ∣ L=\sum\left|\sum_{i j}-H\left(x_{i}\right)\right| L=∑∣∣∣∣∣ij∑−H(xi)∣∣∣∣∣
huber上二权衡
L = ∑ l ( y i , H ( x i ) ) l = { 1 2 ( y i − H ( x i ) ) 2 , ∣ y i − H ( x i ) ∣ ≤ α α ( ∣ y i − H ( x i ) ∣ − α 2 ) , ∣ y i − H ( x i ) ∣ > α , α ∈ ( 0 , 1 ) \begin{array}{c} L=\sum l\left(y_{i}, H\left(x_{i}\right)\right) \\\\ l=\left\{\begin{array}{ll} \frac{1}{2}\left(y_{i}-H\left(x_{i}\right)\right)^{2}, & \left|y_{i}-H\left(x_{i}\right)\right| \leq \alpha \\ \alpha\left(\left|y_{i}-H\left(x_{i}\right)\right|-\frac{\alpha}{2}\right), & \left|y_{i}-H\left(x_{i}\right)\right|>\alpha \end{array}, \alpha \in(0,1)\right. \end{array} L=∑l(yi,H(xi))l={21(yi−H(xi))2,α(∣yi−H(xi)∣−2α),∣yi−H(xi)∣≤α∣yi−H(xi)∣>α,α∈(0,1)
quantile损失
L = ∑ l ( y i , H ( x i ) ) I = { α ( y i − H ( x i ) ) , y i − H ( x i ) > 0 0 , y i − H ( x i ) = 0 , α ∈ ( 0 , 1 ) ( 1 − α ) ( y i − H ( x i ) ) , y i − H ( x i ) < 0 \begin{array}{c} L=\sum l\left(y_{i}, H\left(x_{i}\right)\right) \\\\ I=\left\{\begin{array}{ll} \alpha\left(y_{i}-H\left(x_{i}\right)\right), & y_{i}-H\left(x_{i}\right)>0 \\ 0, & y_{i}-H\left(x_{i}\right)=0, \alpha \in(0,1) \\ (1-\alpha)\left(y_{i}-H\left(x_{i}\right)\right), & y_{i}-H\left(x_{i}\right)<0 \end{array}\right. \end{array} L=∑l(yi,H(xi))I=⎩⎨⎧α(yi−H(xi)),0,(1−α)(yi−H(xi)),yi−H(xi)>0yi−H(xi)=0,α∈(0,1)yi−H(xi)<0
- 超 参 数 α 就 是 回 归 模 型 中 的 a l p h a 参 数 超参数\alpha 就是回归模型中的alpha参数 超参数α就是回归模型中的alpha参数
2.2.3 回归损失的选择
GBDT是工业应用中最广泛的模型,工业数据大多都是极度偏态,长尾,因此GBDT使用时必须考虑离离群值带来的影响,数据中的离群值会极大地影响模型的构建,当离群值在标签中,而我们是依赖于减小损失构建模型,影响会前所未有的大,因此GBDT是天生容易被离群值所影响的模型,也更擅长学习离群值。
有时由于离群值存在,将离群值预测错误会带来巨大的损失。在这种状况下,最终迭代出的算法可能是严重偏离大部分数据的规律的。同样,我们也会遇见很多离群值对我们很关键的业务场景:例如,电商中的金额离群用户可能是 VIP 用户,风控中信用分离群的用户可能是高风险用户,这种状况下我们反而更关注将离群值预测正确。不同的损失函数可以帮助我们解决不同的问题:
- 当高度关注离群值、并且希望努力将离群值预测正确时,选择 MSE
这在工业中是大部分的情况。在实际进行预测时,离群值往往比较难以预测,因此离群样本的预测值和真实值之间的差异会较大。 MSE 作为预测值和真实值差值的平方,会放大离群值的影响,会让算法更加向学习离群值的方向进化,这可以帮助算法更好地预测离群值。 - 努力排除离群值的影响、更关注非离群值的时候,选择 MAE
MAE 对一切样本都一视同仁,对所有的差异都只求绝对值,因此会保留样本差异最原始的状态。相比MSE , MAE 对离群值完全不敏感,这可以有效地降低 GBDT 在离群值上的注意力. - 试图平衡离群值与非离群值、没有偏好时,选择 Huber 或者 quantileloss
Huberloss 损失结合了 MSE 与 MAE ,在 Huber 的公式中,当预测值与真实值的差异大于阈值时,则取绝对
值,小于阈值时,则取平方。在真实数据中,部分离群值的差异会大于阈值,部分离群值的差异会小于阈值,因此比起全部取绝对值的 MAE , Huberloss 会将部分离群值的真实预测差异求平方,相当于放大了离群值的影响(但这种影响又不像在 MSE 那样大)。因此 HuberLoss 是位于 MSE 和 MAE 之间的、对离群值相对不敏感的损失。
2.2.4 探究离群值对不同的loss的影响
import numpy as np
y_true = np.concatenate((np.linspace(-1,1,450),np.linspace(9,10,50))) #含有50个离群值
y_pred = np.linspace(-1,1,500) #预测结果忽略了离群值,会导致离群值上的损失很大

def huber_loss(y_true, y_pred, alpha=0.9):
    #对huber_loss,alpha位于(0,1)之间,一般是更靠近1的方向,默认0.9或者0.99
    error = y_true - y_pred
    #error小于等于阈值(如果True,则计算,如果False则直接为0)
    l1 = (abs(error)<=alpha)*error**2/2
    #error大于阈值
    l2 = (abs(error)>alpha)*alpha*(abs(error)-alpha/2)
    return  (l1+l2).sum()

def squared_error(y_true,y_pred):
    #注意这里不是MSE,而是TSE
    l = (y_true - y_pred)**2
    return l.sum()

def absolute_error(y_true,y_pred):
    #不是MAE,而是TAE
    l = abs(y_true - y_pred)
    return l.sum()

for name,error in [("对离群值最敏感的SE\t",squared_error)
               , ("对离群值一般敏感的Huber\t",huber_loss)
               , ("对离群值完全不敏感的AE\t",absolute_error)]:
    loss = error(y_true,y_pred)
    abratio = error(y_true[451:],y_pred[451:])/loss
    print(name,"总损失为{:.3f},离群值损失占总损失的占比为{:.3f}%".format(loss,abratio*100))

"""
对离群值最敏感的SE	 总损失为3705.280,离群值损失占总损失的占比为98.024%
对离群值一般敏感的Huber	 总损失为369.684,离群值损失占总损失的占比为97.298%
对离群值完全不敏感的AE	 总损失为475.000,离群值损失占总损失的占比为88.782%
"""
2.3 min_impurity_decrease
N t / N ∗ ( i m p u r i t y − N t R / N t ∗ r i g h t i m p u r i t y − N t L / N t ∗ l e f t i m p u r i t y ) N_t / N * (impurity - N_{t R} / N_t * right_{impurity} - N_{tL} / N_t * left_{impurity}) Nt/N∗(impurity−NtR/Nt∗rightimpurity−NtL/Nt∗leftimpurity)
其中 N N N是样本总数, N t N_t Nt是样本数,当前节点的样本数, N t L N_{tL} NtL 是当前节点左孩子的样本数, N t R N_{tR} NtR是右孩子的样本数。 N , N t , N t R 和 N t L N, N_t, N_{tR}和 N_{tL} N,Nt,NtR和NtL都是指加权和。
2.4 n_estimators&learning_rate
H t − 1 ( x i ) H_{t-1}\left(x_{i}\right) Ht−1(xi)为前t-1棵树的预测值累加, f t ( x i ) f_{t}\left(x_{i}\right) ft(xi)就是单个树模型对于残差的拟合值, ϕ t \phi_{t} ϕt为第t棵树的权值,一般是常量1, η \eta η就是 l e a r n i n g _ r a t e learning\_rate learning_rate ,最终的 t t t 就是 n _ e s t i m a t o r s n\_estimators n_estimators
H t ( x i ) = H t − 1 ( x i ) + η ϕ t f t ( x i ) H_{t}\left(x_{i}\right)=H_{t-1}\left(x_{i}\right)+\eta \phi_{t} f_{t}\left(x_{i}\right) Ht(xi)=Ht−1(xi)+ηϕtft(xi)
import sklearn
import matplotlib as mlp
import numpy as np
import pandas as pd
from time import time
from sklearn.ensemble import GradientBoostingRegressor as GBR
data = pd.read_csv(r"D:\学习资料\sklearn课件\集成算法code&数据集\公开课sample_data1.csv",index_col=0)
# 数据量(45988, 107)
X = data.iloc[:,:-1]
y = data.iloc[:,-1] #标签是游戏氪金玩家的氪金数额


"""-----------------------------n_estimators对于模型的影响----------------------"""
for i in range(50,550,50): #[50,100,150,....500]
    start = time() #开始时间的记录
    model = GBR(n_estimators=i,random_state=1412)
    model.fit(X,y)
    print("estimators:{},\tR2:{:.3f}%,\tTime:{:.3f}".format(i,model.score(X,y)*100,time()-start))
    # 这里是将所有数据训练预测,知识简单说明n_estimators参数的作用
"""
estimators:50,	R2:75.448%,	Time:26.515
estimators:100,	R2:80.529%,	Time:52.332
estimators:150,	R2:83.924%,	Time:82.340
estimators:200,	R2:86.109%,	Time:105.157
estimators:250,	R2:87.777%,	Time:136.229
estimators:300,	R2:88.954%,	Time:156.518
estimators:350,	R2:89.854%,	Time:190.958
estimators:400,	R2:90.730%,	Time:213.192
estimators:450,	R2:91.366%,	Time:240.337
estimators:500,	R2:91.999%,	Time:255.028
"""

"""-----------------------------learning_rate对于模型的影响----------------------"""
for i in np.linspace(0.01,0.2,10):
    start = time()
    model = GBR(n_estimators=300,learning_rate=i,random_state=1412)
    model.fit(X,y)
    print("learningrate:{:.3f},\tR2:{:.3f}%,\tTime:{:.3f}".format(i,model.score(X,y)*100,time()-start))
    # 这里是将所有数据训练预测,知识简单说明learning_rate参数的作用

"""
learningrate:0.010,	R2:71.510%,	Time:106.836
learningrate:0.031,	R2:79.401%,	Time:108.110
learningrate:0.052,	R2:83.885%,	Time:109.747
learningrate:0.073,	R2:86.905%,	Time:109.161
learningrate:0.094,	R2:88.539%,	Time:109.393
learningrate:0.116,	R2:89.765%,	Time:108.999
learningrate:0.137,	R2:90.916%,	Time:108.193
learningrate:0.158,	R2:92.008%,	Time:108.893
learningrate:0.179,	R2:92.351%,	Time:109.254
learningrate:0.200,	R2:92.808%,	Time:108.346
"""
2.5 warm_start
2.5.1 增量学习
w a r m _ s t a r t warm\_start warm_start表示是否开启增量学习,增量学习就是允许算法不断接入新的数据来拓展当前模型,将巨量数据分成若干个子集进行逐步训练
- 在之前我们的 m o d e l model model调用 f i t fit fit接口时,后面的会将前面所有已经训练好的模型删除,开始新的训练。
- 但是增量学习开启后,可以通过多次调用 f i t fit fit接口,在保留原训练数据模型的前提下再对当前新的数据进行训练(前提是 : 前后数据的shape,类别和所遵循的数学规律基本相同),在两个 f i t fit fit之间可以人为的调整模型中树的个数
- 增量学习主要应用在数据量巨大的情况下。
2.5.2 确定巨量csv文件中样本条数
在csv文件巨大时,我们通常是无法通过excle文件打开的,所以如何确定数据样本量以逐步进行增量学习成为了难事,所以我们要通过某种手段对于csv文件样本量(行数)进行估计。
import pandas as pd
# 先确定一个上限,这里确定的是 10 ** 7,然后每次跳过十万行样本,直到报错,
# 输出最后一次 i 值说明上限比 i 小,若最后一次输出 950000 说明数据在900000~950000之间
# 若到结束都没报错,说明上限 10 ** 7 小了
for i in range(0, 10 ** 7, 50000):
    df = pd.read_csv(filepath_or_buffer="文件路径", skiprows=i, nrows=1)
    print(i)
2.5.3 增量学习过程
import pandas as pd
from sklearn.ensemble import GradientBoostingRegressor as GBR

gbr = GBR(warm_start=True)
# max_rows是上面大致估计出来的范围
for start_row in np.array(0, max_rows + 1, 50000):
    if start_row == 0:
        header = "infer"  # 第一次保存列名
        add_tree_num = 0  # 第一次训练让它自己生成树模型个数
    else:
        header = None
        add_tree_num = 10  # 每次+10棵树
    train_sub_sample = pd.read_csv(filepath_or_buffer="文件路径", header=header, skiprows=start_row, nrows=50000)
    X = train_sub_sample.iloc[:, :-1]  # 训练数据X
    y = train_sub_sample.iloc[:, -1]  # 训练数据y
    gbr.n_estimators += add_tree_num  # 加GBDT中树个数
    gbr = gbr.fit(X, y)  # 训练
    if (X.shape[0] < 50000):  # 退出结束条件
        break
2.6 GBDT回归树实现分类的方式
需要使用softmax或者sigmoid进行处理
对于回归树模型有:
H ( x i ) = ∑ t = 1 T ϕ t f t ( x i ) H\left(x_{i}\right)=\sum_{t=1}^{T} \phi_{t} f_{t}\left(x_{i}\right) H(xi)=t=1∑Tϕtft(xi)
2.6.1 二分类模型
通过嵌套 s i g m o i d sigmoid sigmoid函数 σ \sigma σ进行转换
p ( y ^ i = 1 ∣ x i ) = σ ( H ( x i ) ) p\left(\hat{y}_{i}=1 \mid x_{i}\right)=\sigma\left(H\left(x_{i}\right)\right) p(y^i=1∣xi)=σ(H(xi))
当 p ( y ^ i = 1 ∣ x i ) 大 于 0.5 时 , 样 本 x i 的 预 测 类 别 为 1 , 反 之 则 为 0 当 p\left(\hat{y}_{i}=1 \mid x_{i}\right) 大于 0.5 时,样本 x_{i} 的预测类别为 1 ,反之则为 0 当p(y^i=1∣xi)大于0.5时,样本xi的预测类别为1,反之则为0
2.6.2 多分类问题
嵌套 s o f t m a x softmax softmax函数 σ \sigma σ进行转换:
具体来说,当现在的问题是 K K K 分类、且每个类别为 [ 1 , 2 , 3 … k ] [1,2,3 \ldots k] [1,2,3…k] 时,我们则分别按照 y = 1 , y = 2 , … , y = k y=1, y=2, \ldots, y=k y=1,y=2,…,y=k 进行建樭 总共建立 K K K 棵树,每棵树输出的结果为:
H 1 ( x i ) , H 2 ( x i ) , … , H k ( x i ) H^{1}\left(x_{i}\right), H^{2}\left(x_{i}\right), \ldots, H^{k}\left(x_{i}\right) H1(xi),H2(xi),…,Hk(xi)
总共 K K K 个输出结果。然后,我们分别将 H 1 ( x i ) H^{1}\left(x_{i}\right) H1(xi) 到 H k ( x i ) H^{k}\left(x_{i}\right) Hk(xi) 的结果输入 s o f t m a x softmax softmax,来计算出每个标签类别所对应的概率。具体地来说, s o f t m a x softmax softmax 函数的表达式为:
Softmax ( H k ( x ) ) = e H k ( x ) ∑ k = 1 K e H k ( x ) \operatorname{Softmax}\left(H^{k}(x)\right)=\frac{e^{H^{k}(x)}}{\sum_{k=1}^{K} e^{H_{k}(x)}} Softmax(Hk(x))=∑k=1KeHk(x)eHk(x)
其中 e e e 为自然常数, H H H 是集成算法的输出结果, K K K 表示标笠中的类别总数为 K K K ,如三分类时 K = 3 K=3 K=3 ,四分类 时 K = 4 K=4 K=4 , k k k 表示任意标签类别, H k H_{k} Hk 则表示以类别 k k k 为真实标签进行训练而得出的 H H H 。不难发现, S o f t m a x Softmax Softmax 函数的分子时多分类状况下某一个标签类别的 H ( x ) \mathrm{H}(\mathrm{x}) H(x) 的指数函数,而分母时多分类状况下所有标签类别的 H ( x ) \mathrm{H}(\mathrm{x}) H(x) 的指数函数之和,因此 S o f t m a x Softmax Softmax函数的结果代表了样本的预测标签为类别 k k k 的概率。假设现在是三分类 [ 1 , 2 , 3 ] [1,2,3] [1,2,3] ,则样本 i i i 被分类为 1 类的概率为:
p 1 ( x i ) = e H 1 ( x ) ∑ k = 1 K e H k ( x ) = e H 1 ( x ) e H 1 ( x ) + e H 2 ( x ) + e H 3 ( x ) \begin{aligned} p^{1}\left(x_{i}\right) &=\frac{e^{H^{1}(x)}}{\sum_{k=1}^{K} e^{H_{k}(x)}} \\ &=\frac{e^{H^{1}(x)}}{e^{H^{1}(x)}+e^{H^{2}(x)}+e^{H^{3}(x)}} \end{aligned} p1(xi)=∑k=1KeHk(x)eH1(x)=eH1(x)+eH2(x)+eH3(x)eH1(x)
最终得到 K K K 个相对概率 p k ( x i ) p^{k}\left(x_{i}\right) pk(xi) ,并求解出相对概率最高的类别。不难发现,当执行多分类时,这一计算流程 中涉及到的计算量以及弱评估器数量都会远远超出二分类以及回归类问题。实际上,在执行多分类任务时, 如果我们要求模型迭代10次,模型则会按照实际的多分类标笠数 n _ c l a s s e s n\_classes n_classes建立 10 ∗ n _ c l a s s e s 10 * n\_classes 10∗n_classes个弱评估器。对 于这一现象,我们可以通过属性 n _ e s t i m a t o r s _ n\_estimators\_ n_estimators_以及属性 e s t i m a t o r s _ estimators\_ estimators_查看到。
2.7 接口(属性)
2.7.1 所有接口
n_estimators_ : int
    通过提前停止选择的估计器数量(如果n_iter_no_change被指定)。否则设置为n_estimators

feature_importances_ : ndarray of shape (n_features,)
     基于杂质的特征重要性。
     越高,特征越重要。
     特征的重要性计算为(标准化)完全降低了该功能带来的标准。
     也是被称为基尼重要性(基于基尼系数)。


oob_improvement_ : ndarray of shape (n_estimators,)
	袋外样本损失(=偏差)相对于上一次迭代的改善。
    举个栗子``oob_improvement_[0]`` 就是在在"init"估计器的第一阶段的损失。
    仅在 ``subsample < 1.0`` 时可用

train_score_ : ndarray of shape (n_estimators,)
    第 i 个分数"train_score_[i]"是在袋内样本上迭代i次后的的模型。
    如果 ``subsample == 1`` 这是训练数据的偏差

loss_ : LossFunction
    所使用的损失函数

init_ : estimator
    返回 ``init``评估器

estimators_ : ndarray of DecisionTreeRegressor of shape (n_estimators, ``loss_.K``)
    回归\二分类问题时返回形状为 (n_estimators,1)的模型,因为只需要创建一组树模型
    多分类问题时返回形状(n_estimators,类别总数)的模型,因为每个类别都需要一组树模型
    返回的每个树模型一般是决策树,因为之前默认的基学习器是CART决策树

classes_ : ndarray of shape (n_classes,)
    类别标签(形状大小为:类别总数K)

n_classes_ : int
    类别总数K

n_features_ : int
    数据特征的数量。

n_features_in_ : int
     在 fit 期间使用的的特征数量

feature_names_in_ : ndarray of shape (`n_features_in_`,)
    在 fit 期间使用的的特征的名称,仅仅在定义了features_name才能使用

max_features_ : int
    最大贡献度的特征
2.7.2 接口estimators_体现出来的问题
因为在多分类问题时,每种类别都要生成一组树,
一共 n _ e s t i m a t o r s _ ∗ n _ c l a s s e s _ n\_estimators\_ *n\_classes\_ n_estimators_∗n_classes_棵树 造成了计算量较大 ,使用时计算量甚至超过了随机森林。
2.8 和其他集成算法对比的效果
import sklearn
import matplotlib as mlp
import numpy as np
import pandas as pd
from sklearn.datasets import load_boston
from sklearn.ensemble import GradientBoostingRegressor as GBR
from sklearn.ensemble import RandomForestRegressor as RFR
from sklearn.model_selection import KFold, cross_validate, train_test_split
from sklearn.ensemble import AdaBoostRegressor as ABR
import time
import matplotlib.pyplot as plt
from sklearn.model_selection import GridSearchCV

X = load_boston().data
y = load_boston().target
modelnames = ["GBDT", "AdaBoost", "RF-TPE"]
models = [
    GBR(random_state=100),
    ABR(random_state=100),
    RFR(max_features='sqrt', n_estimators=68, max_depth=10,
        criterion='squared_error', n_jobs=-1, random_state=15234,),
]
colors = ["green", "gray", "red"]
axis = range(1, 6)
cv = KFold(n_splits=5, shuffle=True, random_state=100)
plt.figure(figsize=(8, 6), dpi=80)
for name, model, color in zip(modelnames, models, colors):
    result = cross_validate(model, X, y,
                            cv=cv,
                            scoring="neg_root_mean_squared_error",
                            return_train_score=True,
                            verbose=False, n_jobs=-1)
    plt.plot(axis, abs(result["train_score"]),
             color=color, linestyle="-", label=name+"_Train")
    plt.plot(axis, abs(result["test_score"]),
             color=color, linestyle="--", label=name+"_Test")
plt.xticks([1, 2, 3, 4, 5])
plt.xlabel("CV_n", fontsize=16)
plt.ylabel("RMSE", fontsize=16)
plt.legend()
plt.show()
横轴为第几次交叉验证,Adaboost拟合程度还是比较轻,拟合程度不好,未调参的GBDT还是有很大的提升空间。

2.9 调参代码
2.9.1 boosting算法调参思想
这时一些调参建议,适用于继承算法boosting的绝大部分算法

2.9.1 调参过程代码
import sklearn
import matplotlib as mlp
import numpy as np
import pandas as pd
from sklearn.datasets import load_boston
from sklearn.ensemble import GradientBoostingRegressor as GBR
from sklearn.ensemble import RandomForestRegressor as RFR
from sklearn.model_selection import KFold, cross_validate, train_test_split
from sklearn.ensemble import AdaBoostRegressor as ABR
import time
import matplotlib.pyplot as plt
from sklearn.model_selection import GridSearchCV

X = load_boston().data
y = load_boston().target
cv = KFold(n_splits=5, shuffle=True, random_state=100)


def RMSE(result, name):
    return abs(result[name].mean())


rfr1_train_list = []
rfr1_test_list = []
rfr2_train_list = []
rfr2_test_list = []
# n_estimators learning_rate min_impurity_decrease max_features subsample min_samples_split
for n in range(20, 170, 10):

    model1 = GBR(random_state=100, learning_rate=0.075,
                 n_estimators=n, max_features=7)

    res1 = cross_validate(model1, X, y, cv=cv, scoring="neg_root_mean_squared_error",
                          return_train_score=True, verbose=False, n_jobs=-1)
    rfr1_train_list.append(RMSE(res1, "train_score"))
    rfr1_test_list.append(RMSE(res1, "test_score"))

    model2 = GBR(random_state=100, learning_rate=0.075,
                 n_estimators=n, max_features=7)

    res2 = cross_validate(model2, X, y, cv=cv, scoring="neg_root_mean_squared_error",
                          return_train_score=True, verbose=False, n_jobs=-1)
    rfr2_train_list.append(RMSE(res2, "train_score"))
    rfr2_test_list.append(RMSE(res2, "test_score"))


fig = plt.figure(figsize=(10, 6))
ax = fig.add_subplot(111)
ax.grid()
ax.plot(range(20, 170, 10), rfr1_train_list, "r-", range(20, 170, 10),
        rfr1_test_list, "r--", label="first_model")

ax.plot(range(20, 170, 10), rfr2_train_list, "g-",
        range(20, 170, 10), rfr2_test_list, "g--", label="this_model")
ax.legend()
plt.show()
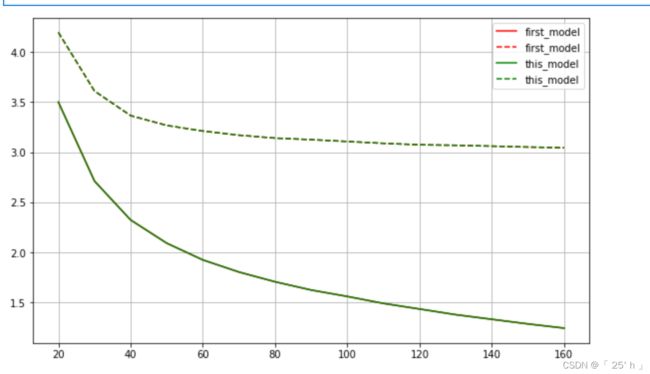
两个模型参数一样,后面覆盖了前面的,主要是第一个保存最优的,然后第二个调参用,实时更新第一个模型参数。
3 Xgboost
3.1 参数
xgb参数英文文档
3.1.0 参数建议
| 参数相关的流程 | 原生库参数 | skleanAPI参数 |
|---|---|---|
| 损失函数 | objective, lambda ,alpha | objective, reg_alpha, reg_lambda |
| 集成规则 | eta, base_score, eval_metric, subsample, sampling_method, colsample_bytree, colsample_bylevel, colsample_bynode |
learning_rate, base_score, eval_metric, subsample, colsample_bytree, colsample_bylevel, colsample_bynode |
| 弱评估器 | num_boost_round, booster, tree_method, sketch_eps, updater, grow_policy |
n_estimators, booster, tree_method |
| 弱评估器 (抗过拟合) |
num_feature, max_depth, gamma, min_child_weight, max_delta_step, max_leaves, max_bin |
max_depth, gamma, min_child_weight, max_delta_step |
| 训练流程 (结果监控) |
verbosity | verbosity |
| 训练流程 (提前停止) |
early_stopping_rounds | early_stopping_rounds |
| 训练流程 (增量学习) |
warm_start | |
| 随机性控制 | seed | random_state |
| 其他流程 | missing, scale_pos_weight, predictor, num_parallel_tree |
n_jobs, scale_pos_weight, num_parallel_tree,enable_categorical, importance_type |
3.1.1 sklearn接口
import xgboost
xgboost.XGBClassifier()合并在回归中说,只有objective不一样
xgboost.XGBRegressor(
                     learning_rate=0.1, # 学习率,和n_estimators树个数相对应
                     n_estimators=100,# 梯度提升树的数量,一般不超过300

#---------------------------限制过拟合的主要参数值有一下几个------------------------
					 max_depth=3, # 每棵树的最大深度
                     gamma=0,#在叶子上进行进一步分区所需的最小损失减少树的节点
                     colsample_bytree=1,# 构建每棵树时的子特征比率
                     colsample_bylevel=1,#构建每层的子特征比率
                     colsample_bynode=1, #构建每个节点能使用的特征比例
                     subsample=1,#训练实例的子样本比率
# 这两个正则项系数虽然能抗过闭合,不过我们通常使用gamma抗过拟合,默认使用L2范式,系数为1
                     reg_alpha=0,#  L1 权重正则化项系数
                     reg_lambda=1,#  L2 权重正则化项系数

                     silent=True,# 是否显示过程
                     objective='reg:squarederror',
                     #objective代表了我们要解决的问题(目标函数)是分类还是回归,或其他问题,以及对应的损失函数。具体可以取的值很多,一般我们只关心在分类和回归的时候使用的参数。
                     #在回归问题objective一般使用reg:squarederror ,即MSE均方误差。二分类问题一般使用binary:logistic, 多分类问题一般使用multi:softmax
                     booster='gbtree',# 弱学习器基于树模型 gbtree、gblinear 或 dart
                     #booster决定了XGBoost使用的弱学习器类型,可以是默认的gbtree, 也就是CART决策树,还可以是线性弱学习器gblinear以及DART。
                     #一般来说,我们使用gbtree就可以了,不需要调参
                     n_jobs=1,
                     min_child_weight=1,# 样本点所以的权重的和若小于1则不分节点
                     max_delta_step=0,# 允许每棵树的权重估计的最大增量步长
                     scale_pos_weight=1,# 平衡正负权重
                     base_score=0.5,
                     random_state=0,
                     verbosity = 0 ,# 0 (silent) - 3 (debug
                     missing=None,# 处理空值,填充什么
                     importance_type='gain'#特征重要性类型
                     #树模型 "gain", "weight", "cover", "total_gain" or"total_cover".
        			 #线性模型只有"weight",归一化系数,未有偏差
                    )

eval_metric参数设置模型使用什么评估指标:这个参数在sklearnAPI中要在实例化模型后在fit方法中添加。
3.1.2 原生库(只写了重要的)
objective参数默认binary:logistic
params = {"eta": 0.3,# 相当于learning_rate
           "max_depth": 3,
           "gamma": 0,
           "objective": "reg:squarederror",# 同sklearn,不同问题不同参数
           "colsample_bytree": 1,
           "colsample_bylevel": 1,
           "colsample_bynode": 1,
           "lambda": 1,# L2范数
           "alpha": 0,# L1范数
           "subsample": 1,
           "seed": 100,# random_state

           "eval_metric":"mae"#重要
           """
           这个参数表示用哪个评估指标:
           rmse: 回归中的均方误差
           mae: 回归中的绝对平均误差
           logloss:二分类对数损失
           mlogloss: 多分类对数损失
           error: 多分类误差,相当于 1-准确率
           auc:多分类中的AUC面积
           """
           }
XGBoost中的正则项:
γ T + 1 2 α ∑ j = 1 T ∣ w j ∣ + 1 2 λ ∑ j = 1 T w j 2 \gamma T+\frac{1}{2} \alpha \sum_{j=1}^{T}\left|w_{j}\right|+\frac{1}{2} \lambda \sum_{j=1}^{T} w_{j}^{2} γT+21αj=1∑T∣wj∣+21λj=1∑Twj2
T 就 是 树 的 叶 节 点 数 量 , w j 就 是 树 中 第 j 个 叶 节 点 的 值 。 T 就是树的叶节点数量,w_j就是树中第j个叶节点的值。 T就是树的叶节点数量,wj就是树中第j个叶节点的值。
γ 就 是 控 制 信 息 增 益 的 参 数 , α 就 是 L 1 正 则 项 系 数 , λ 就 是 L 2 正 则 项 系 数 \gamma就是控制信息增益的参数,\alpha就是L1正则项系数,\lambda 就是L2正则项系数 γ就是控制信息增益的参数,α就是L1正则项系数,λ就是L2正则项系数
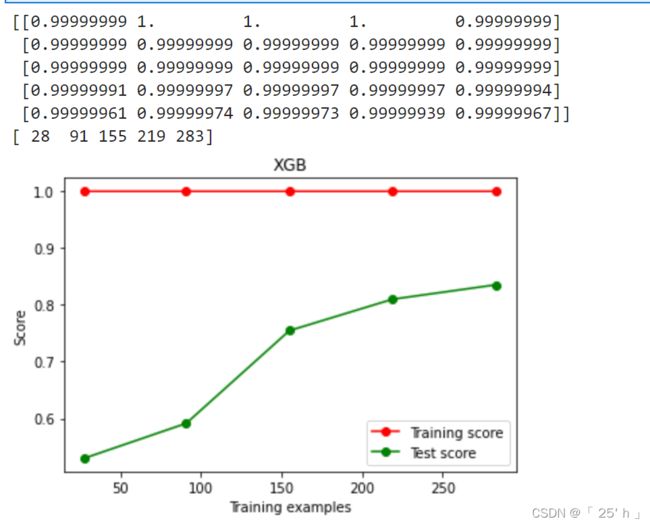
3.2 学习曲线(没啥用)
import datetime
from time import time
import matplotlib.pyplot as plt
import numpy as np
import pandas as pd
from sklearn.metrics import mean_squared_error as MSE
from xgboost import XGBRegressor as XGBR
from sklearn.ensemble import RandomForestRegressor as RFR
from sklearn.linear_model import LinearRegression as LinearR
from sklearn.datasets import load_boston
from sklearn.model_selection import KFold, cross_val_score as CVS, train_test_split as TTS,learning_curve

data = load_boston()
X = data.data
y = data.target
def plot_learning_curve(estimator, title, X, y, ylim=None, cv=None, n_jobs=None):
    sizes, train_scores, test_scores = learning_curve(estimator, X, y,
                                                      shuffle=True,
                                                      cv=cv,
                                                      random_state=20,
                                                      n_jobs=n_jobs)
    ax = plt.figure().add_subplot(111)
    ax.set_title(title)
    if ylim is not None:
        ax.set_ylim(*ylim)
    ax.set_xlabel("Training examples")
    ax.set_ylabel("Score")
    print(train_scores)
    print(sizes)
    ax.plot(sizes, np.mean(train_scores, axis=1),
            'o-', color="r", label="Training score")
    ax.plot(sizes, np.mean(test_scores, axis=1),
            'o-', color="g", label="Test score")
    ax.legend(loc="best")
    plt.show()

cv = KFold(n_splits=5, shuffle=True, random_state=42)
plot_learning_curve(
    XGBR(n_estimators=100, random_state=420), "XGB", Xtrain, Ytrain, cv=cv)
3.3 n_estimators参数对于模型的影响
3.3.1 只考虑 R 2 R^2 R2
axisx = range(10,1010,50)
rs = []
for i in axisx:
    reg = XGBR(n_estimators=i,random_state=420)
    rs.append(CVS(reg,Xtrain,Ytrain,cv=cv).mean())
print(axisx[rs.index(max(rs))],max(rs))
plt.figure(figsize=(20,5))
plt.plot(axisx,rs,c="red",label="XGB")
plt.legend()
plt.show()
3.3.2 考虑泛化误差
从数据上看,参数n_estimators为160时 R 2 R^2 R2最高,不过这仅仅是从单一指标。
并且数据集过于简单,所以模型并没有足够多的数据进行学习,造成模型中存在的方差和偏差较大,模型的效果存在一定的偶然性,所以我们要根据泛化误差,考虑偏差,方差所带来的损失:
E ( f ; D ) = bias 2 + var + ϵ 2 E(f ; D)=\operatorname{bias}^{2}+\operatorname{var}+\epsilon^{2} E(f;D)=bias2+var+ϵ2
bias \operatorname{bias} bias是偏差, var \operatorname{var} var是方差, ϵ 2 \epsilon^{2} ϵ2样本噪声,我们寻找 E ( f ; D ) E(f ; D) E(f;D)最小,就是我们的目标值。
axisx = range(50, 1050, 50)
rs = []
var = []
ge = []
for i in axisx:
    reg = XGBR(n_estimators=i, random_state=420)
    cvresult = CVS(reg, Xtrain, Ytrain, cv=cv)
    # 记录1-偏差
    rs.append(cvresult.mean())
    # 记录方差
    var.append(cvresult.var())
    # 计算泛化误差的可控部分
    ge.append((1 - cvresult.mean())**2+cvresult.var())
# 打印R2最高所对应的参数取值,并打印这个参数下的方差
print(axisx[rs.index(max(rs))], max(rs), var[rs.index(max(rs))])
# 打印方差最低时对应的参数取值,并打印这个参数下的R2
print(axisx[var.index(min(var))], rs[var.index(min(var))], min(var))
# 打印泛化误差可控部分的参数取值,并打印这个参数下的R2,方差以及泛化误差的可控部分
print(axisx[ge.index(min(ge))], rs[ge.index(min(ge))],
      var[ge.index(min(ge))], min(ge))
plt.figure(figsize=(20, 5))
plt.plot(axisx, rs, c="red", label="XGB")
plt.legend()
plt.show()
结果表示:偏差,方差,泛化误差 E ( f ; D ) E(f ; D) E(f;D)最小的地方是n_estimators为100时。

3.3.3 精细化确定泛化误差
然后在100左右缩小范围进行训练模型,以确定更加精确的n_estimators参数:
axisx = range(60, 150, 5)
rs = []
var = []
ge = []
for i in axisx:
    reg = XGBR(n_estimators=i, random_state=420)
    cvresult = CVS(reg, Xtrain, Ytrain, cv=cv)
    rs.append(cvresult.mean())
    var.append(cvresult.var())
    ge.append((1 - cvresult.mean())**2+cvresult.var())
print(axisx[rs.index(max(rs))], max(rs), var[rs.index(max(rs))])
print(axisx[var.index(min(var))], rs[var.index(min(var))], min(var))
print(axisx[ge.index(min(ge))], rs[ge.index(min(ge))],
      var[ge.index(min(ge))], min(ge))
rs = np.array(rs)
var = np.array(var)*0.01
plt.figure(figsize=(20, 5))
plt.plot(axisx, rs, c="black", label="XGB")  # 添加方差线
plt.fill_between(axisx, rs+var, rs-var,
                 alpha=0.1, color="b")

plt.legend()
plt.show()
# 看看泛化误差的可控部分如何?
plt.figure(figsize=(20, 5))
plt.plot(axisx, ge, c="gray", linestyle='-.')
plt.show()
泛化最优解为 85 85 85.(上图是 R 2 R^2 R2,透明的是方差范围,下图是泛化误差变化曲线)

3.3.4 以上三者的对比
time0 = time()
print("\n 只考虑R_2时 n_estimators :160 ")
print(XGBR(n_estimators=160, random_state=420).fit(
    Xtrain, Ytrain).score(Xtest, Ytest))
print(time()-time0)

time0 = time()
print("\n 经过第一次考虑泛化误差 n_estimators :100 ")
print(XGBR(n_estimators=100, random_state=420).fit(
    Xtrain, Ytrain).score(Xtest, Ytest))
print(time()-time0)

time0 = time()
print("\n 经过精细化范围后的情况 n_estimators :100 ")
print(XGBR(n_estimators=85, random_state=420).fit(
    Xtrain, Ytrain).score(Xtest, Ytest))
print(time()-time0)

"""
 只考虑R_2时 n_estimators :160
0.9050526026617368
114.02017259597778

 经过第一次考虑泛化误差 n_estimators :100
0.9050988968414799
0.10242223739624023

 经过精细化范围后的情况 n_estimators :100
0.9051350393630944
0.0827784538269043
"""

可以看出这几种情况下,虽然模型效果有了提升(没有特别的提高),但是时间上有了很大的优化。
3.4 subsample对模型的影响
import datetime
from time import time
import matplotlib.pyplot as plt
import numpy as np
import pandas as pd
from sklearn.metrics import mean_squared_error as MSE
from xgboost import XGBRegressor as XGBR
from sklearn.ensemble import RandomForestRegressor as RFR
from sklearn.linear_model import LinearRegression as LinearR
from sklearn.datasets import load_boston
from sklearn.model_selection import KFold, cross_val_score as CVS, train_test_split as TTS,learning_curve

data = load_boston()
X = data.data
y = data.target
axisx = np.linspace(0.05, 1, 20)
rs = []
var = []
ge = []
for i in axisx:
    reg = XGBR(n_estimators=180, subsample=i, random_state=420)
    cvresult = CVS(reg, Xtrain, Ytrain, cv=cv)
    rs.append(cvresult.mean())
    var.append(cvresult.var())
    ge.append((1 - cvresult.mean())**2+cvresult.var())
print(axisx[rs.index(max(rs))], max(rs), var[rs.index(max(rs))])
print(axisx[var.index(min(var))], rs[var.index(min(var))], min(var))
print(axisx[ge.index(min(ge))], rs[ge.index(min(ge))],
      var[ge.index(min(ge))], min(ge))
rs = np.array(rs)
var = np.array(var)
plt.figure(figsize=(20, 5))
plt.plot(axisx, rs, c="black", label="XGB")
plt.plot(axisx, rs+var, c="red", linestyle='-.')
plt.plot(axisx, rs-var, c="red", linestyle='-.')
plt.legend()
plt.show()
# 细化学习曲线
axisx = np.linspace(0.75, 1, 20)  # 不要盲目找寻泛化误差可控部分的最低值,注意观察结果
plt.figure(figsize=(20, 5))
plt.plot(axisx, ge, c="gray", linestyle='-.')
plt.show()
3.6 scale_pos_weight权重平衡(分类)
from sklearn.datasets import make_blobs
from sklearn.metrics import confusion_matrix as cm, recall_score as recall, roc_auc_score as auc
import xgboost as xgb
class_1 = 500
class_2 = 50
centers = [[0.0, 0.0], [2.0, 2.0]]
clusters_std = [1.5, 0.5]
[X, y] = make_blobs(n_samples=[class_1, class_2],
                    n_features=2,
                    centers=centers,
                    cluster_std=clusters_std,
                    shuffle=True,
                    random_state=0,
                    return_centers=False, )
X_train, X_test, y_train, y_test = TTS(X, y, test_size=0.3, random_state=0)

# 使用scale_pos_weight默认值1
sklearn_model = xgb.XGBClassifier(random_state=1, scale_pos_weight=1)
sklearn_model.fit(X_train, y_train, eval_metric="logloss")
y_pre = sklearn_model.predict(X_test)

# 混淆矩阵
cm(y_test,y_pre,labels=[1,0])
# array([[ 15,   3],
#        [  5, 142]], dtype=int64)

# 准确率
sklearn_model.score(X_test, y_test)
# 0.9515151515151515

# 召回率
recall(y_test,y_pre)
# 0.8333333333333334

# AUC
auc(y_test,sklearn_model.predict_proba(X_test)[:,1])
# 0.9792139077853362

#****************************scale_pos_weight变成10,因为class_1 : class_2 = 500 : 50

sklearn_model_scale = xgb.XGBClassifier( random_state=1, scale_pos_weight=10)
sklearn_model_scale.fit(X_train, y_train, eval_metric="logloss")
y_pre_scale = sklearn_model_scale.predict(X_test)
cm(y_test,y_pre_scale,labels=[1,0])
#array([[ 16,   2],
#       [  4, 143]], dtype=int64)

sklearn_model_scale.score(X_test, y_test)
#0.9636363636363636

recall(y_test,y_pre_scale)
#0.8888888888888888

auc(y_test,sklearn_model_scale.predict_proba(X_test)[:,1])
#0.9792139077853362

# ************************************不同scale_pos_weight下准确率,召回率,AUC曲线
rang=[1,5,10,20,30]
acu_list=[]
recall_list=[]
auc_list=[]
for i in rang:
    clf=xgb.XGBClassifier(scale_pos_weight=i).fit(X_train,y_train)
    y_pr=clf.predict(X_test)
    acu_list.append(clf.score(X_test,y_test))
    recall_list.append(recall(y_test,y_pr))
    auc_list.append(auc(y_test,clf.predict_proba(X_test)[:,1]))

ax = plt.figure(figsize=(15, 8)).add_subplot(111)
ax.plot(rang,acu_list,label="Accuracy")
ax.plot(rang,recall_list,label="Recall")
ax.plot(rang,auc_list,label="AUC")
plt.legend(fontsize = "xx-large")
plt.show()
在一些特定情况下,我们更加倾向于在保证准确率的情况下看中召回率,这就是scale_pos_weight参数的作用,而不是一味的追求准确率。

这几个评估指标:

3.5 使用原生库调参数
xgboost.DMatrix(X,y)
转换数据类型,原生库要求
xgboost.cv(params,# 参数
			dtrian, # DMatrix数据
			num_boost_round# 弱分类器个数
			,nfold #交叉验证次数,默认3
			)
函数就是在一次模型下树生长过程,就是新建一个弱评估器,就返回一次强学习器的情况。
xgboost.cv()当params中"eval_metric":"rmse"时,返回值:行表示树模型(若评估器的个数num_boost_round),列含义分别为:训练均方误差均值,训练均方误差标准差,测试均方误差均值,测试均方误差标准差。
import matplotlib.pyplot as plt
import numpy as np
import pandas as pd
import xgboost as xgb
from sklearn.model_selection import KFold, train_test_split as TTS
data = pd.read_csv( r"D:\学习资料\sklearn课件\AutoML与超参数优化——菜菜\train_encode.csv", index_col=0)
X = data.iloc[:, :-1]
y = data.iloc[:, -1]
X_train, X_test, y_train, y_test = TTS( X, y, test_size=0.3, random_state=0, shuffle=True)

dfull = xgb.DMatrix(X_train, y_train)

num_round = 600
params1 = {"eta": 0.05,
           "max_depth": 2,
           "gamma": 0,
           "objective": "reg:squarederror",
           "colsample_bytree": 1,
           "colsample_bylevel": 0.4,
           "colsample_bynode": 1,
           "lambda": 1,
           "alpha": 0,
           "subsample": 1,
           "seed": 100,
          "eval_metric":"rmse"}
cvresult1 = xgb.cv(params1, dfull, num_boost_round=num_round)

params2 = {"eta": 0.3,
           "max_depth": 2,
           "gamma": 0,
           "objective": "reg:squarederror",
           "colsample_bytree": 1,
           "colsample_bylevel": 0.4,
           "colsample_bynode": 1,
           "lambda": 1,
           "alpha": 0,
           "subsample": 1,
           "seed": 100,
          "eval_metric":"rmse"}
cvresult2 = xgb.cv(params2, dfull, num_boost_round=num_round)

ax = plt.figure(figsize=(15, 8)).add_subplot(111)
ax.plot(range(1, num_round+1), cvresult1.iloc[:, 0], "r-",
        range(1, num_round+1), cvresult1.iloc[:, 2], "r--", label="first_model")
ax.plot(range(1, num_round+1), cvresult2.iloc[:, 0], "g-",
        range(1, num_round+1), cvresult2.iloc[:, 2], "g--", label="this_model")

plt.grid()
plt.legend(fontsize = "xx-large")
plt.show()
说明:
first_model就是之前最好的模型情况
this_model就是现在参数组的情况,图中this_model不好,所以保留last_model,继续调参取得最优解。
LightGBM
CatBoost
6 问题
6.1 RF和GBDT之间区别
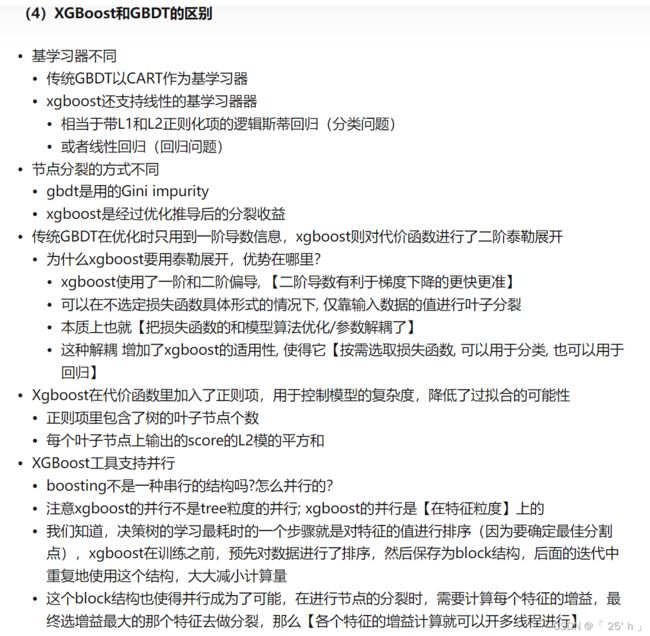
6.2 XGBoost和GBDT之间区别
6.3 XGBoost是如何防止过拟合的
6.4 GBDT中的步长
6.5 boosting和bagging区别
6.6 GBDT优缺点
6.7 XGBoost优缺点
7 超参数优化
内容均来自B站菜菜的机器学习
7.1 网格搜索类
7.1.1 枚举网格搜索
classsklearn.model_selection.GridSearchCV(estimator, param_grid, , scoring=None, n_jobs=None, refit=True, cv=None, verbose=0, pre_dispatch='2n_jobs', error_score=nan, return_train_score=False)
| Name | Description |
|---|---|
| estimator | 调参对象,某评估器 |
| param_grid | 参数空间,可以是字典或者字典构成的列表,稍后介绍参数空间的创建方法 |
| scoring | 评估指标,支持同时输出多个参数 |
| n_jobs | 设置工作时参与计算的线程数 |
| refit | 挑选评估指标和最佳参数,在完整数据集上进行训练 |
| cv | 交叉验证的折数 |
| verbose | 输出工作日志形式 |
| pre_dispatch | 多任务并行时任务划分数量 |
| error_score | 当网格搜索报错时返回结果,选择’raise’时将直接报错并中断训练过程,其他情况会显示警告信息后继续完成训练 |
| return_train_score | 在交叉验证中是否显示训练集中参数得分 |
- 主要是范围合适,枚举网格搜索能完成最优解的搜索,就是太费时间
import time #计时模块time
import pandas as pd
from sklearn.ensemble import RandomForestRegressor as RFR
from sklearn.model_selection import KFold, GridSearchCV
def RMSE(cvresult,key):
    return (abs(cvresult[key])**0.5).mean()

data = pd.read_csv( r"D:\学习资料\sklearn课件\AutoML与超参数优化——菜菜\train_encode.csv", index_col=0)
X = data.iloc[:,:-1]
y = data.iloc[:,-1]
param_grid_simple = {'n_estimators': [*range(5,100,5)]
                     , 'max_depth': [*range(25,36,2)]
                     , "max_features": ["log2","sqrt","auto"]
                    }

reg = RFR(random_state=1412,verbose=True,n_jobs=-1)

cv = KFold(n_splits=5,shuffle=True,random_state=1412)

search = GridSearchCV(estimator=reg
                     ,param_grid=param_grid_simple
                     ,scoring = "neg_mean_squared_error" #MSE
                     ,verbose = True
                     ,cv = cv
                     ,n_jobs=12)

#=====【TIME WARNING: 5~10min】=====#
start = time.time()
search.fit(X,y)
print(time.time() - start)

search.best_estimator_
"""
RandomForestRegressor(max_depth=33, max_features='log2', n_estimators=45,
                      n_jobs=-1, random_state=1412, verbose=True)
"""

abs(search.best_score_)**0.5
# 29840.676988215626
7.1.2 随机网格搜索
决定枚举网格搜索运算速度的因子一共有两个:
- 参数空间的大小:参数空间越大,需要建模的次数越多
- 数据量的大小:数据量越大,每次建模时需要的算力和时间越多
所以解决方式就俩:
- 调整搜索空间
- 每次训练的数据。
在sklearn中,随机抽取参数子空间并在子空间中进行搜索的方法叫做随机网格搜索RandomizedSearchCV。
随机网格搜索在实际运行时,并不是先抽样出子空间,再对子空间进行搜索,而是逐个的,这种随机抽样是不放回的。我们可以控制随机网格搜索的迭代次数。
class sklearn.model_selection.RandomizedSearchCV(estimator, param_distributions, *, n_iter=10, scoring=None, n_jobs=None, refit=True, cv=None, verbose=0, pre_dispatch='2*n_jobs', random_state=None, error_score=nan, return_train_score=False)
| Name | Description |
|---|---|
| estimator | 调参对象,某评估器 |
| param_distributions | 全域参数空间,可以是字典或者字典构成的列表 |
| n_iter | 迭代次数,迭代次数越多,抽取的子参数空间越大 |
| scoring | 评估指标,支持同时输出多个参数 |
| n_jobs | 设置工作时参与计算的线程数 |
| refit | 挑选评估指标和最佳参数,在完整数据集上进行训练 |
| cv | 交叉验证的折数 |
| verbose | 输出工作日志形式 |
| pre_dispatch | 多任务并行时任务划分数量 |
| random_state | 随机数种子 |
| error_score | 当网格搜索报错时返回结果,选择’raise’时将直接报错并中断训练过程,其他情况会显示警告信息后继续完成训练 |
| return_train_score | 在交叉验证中是否显示训练集中参数得分 |
import time #计时模块time
import pandas as pd
from sklearn.ensemble import RandomForestRegressor as RFR
from sklearn.model_selection import KFold, RandomizedSearchCV

#创造参数空间 - 使用与网格搜索时完全一致的空间
param_grid_simple = {'n_estimators': [*range(5,100,5)]
                     , 'max_depth': [*range(25,36,2)]
                     , "max_features": ["log2","sqrt","auto"]
                    }

#建立回归器、交叉验证
reg = RFR(random_state=1412,verbose=True,n_jobs=12)
cv = KFold(n_splits=5,shuffle=True,random_state=1412)

#计算全域参数空间大小,因为要是不知道全域大小,就不知道在随机网格搜索中的迭代量
len([*range(5,100,5)]) * len([*range(25,36,2)]) * 3
# 342

search = RandomizedSearchCV(estimator=reg
                            ,param_distributions=param_grid_simple
                            ,n_iter = 170 #子空间的大小是全域空间的约一半
                            ,scoring = "neg_mean_squared_error"
                            ,verbose = True
                            ,cv = cv
                            ,n_jobs=12)

#训练随机搜索评估器
#=====【TIME WARNING: 2~5min】=====#
start = time.time()
search.fit(X,y)
print(time.time() - start)

#查看模型结果
search.best_estimator_
"""
RandomForestRegressor(max_depth=35, max_features='log2', n_estimators=45,
                      n_jobs=12, random_state=1412, verbose=True)
"""

abs(search.best_score_)**0.5
# 29840.676988215626
# 居然和枚举网格搜索一模一样。
随机网格搜索能够有效的根本原因在于:
- 抽样出的子空间反馈出与全域空间相似的分布
- 子空间越大,子空间与全域空间越相似
- 在与全域空间相似的空间中,随机搜索即便不能找到真正的最小值,也能找到与最小值高度接近的某一个次小值
7.1.3 对半网格搜索(Halving Grid Search)
对于对半网格搜索应用来说,最困难的部分就是决定搜索本身复杂的参数组合。在调参时,如果我们希望参数空间中的备选组合都能够被充分验证,则迭代次数不能太少(例如,只迭代3次),因此factor不能太大。但如果factor太小,又会加大迭代次数,同时拉长整个搜索的运行时间。因此,我们一般考虑以下两个点:
1、min_resources的值不能太小,且迭代过程中使用尽量多的数据
2、迭代完毕之后,剩余的验证参数组合不能太多,10~20之间即可接受
class sklearn.model_selection.HalvingGridSearchCV(estimator, param_grid, *, factor=3, resource='n_samples', max_resources='auto', min_resources='exhaust', aggressive_elimination=False, cv=5, scoring=None, refit=True, error_score=nan, return_train_score=True, random_state=None, n_jobs=None, verbose=0)
| Name | Description |
|---|---|
| estimator | 调参对象,某评估器 |
| param_grid | 参数空间,可以是字典或者字典构成的列表 |
| factor | 每轮迭代中新增的样本量的比例,同时也是每轮迭代后留下的参数组合的比例 |
| resource | 设置每轮迭代中增加的验证资源的类型 |
| max_resources | 在一次迭代中,允许被用来验证任意参数组合的最大样本量 |
| min_resources | 首次迭代时,用于验证参数组合的样本量r0 |
| aggressive_elimination | 是否以全部数被使用完成作为停止搜索的指标,如果不是,则采取措施 |
| cv | 交叉验证的折数 |
| scoring | 评估指标,支持同时输出多个参数 |
| refit | 挑选评估指标和最佳参数,在完整数据集上进行训练 |
| error_score | 当网格搜索报错时返回结果,选择’raise’时将直接报错并中断训练过程 其他情况会显示警告信息后继续完成训练 |
| return_train_score | 在交叉验证中是否显示训练集中参数得分 |
| random_state | 控制随机抽样数据集的随机性 |
| n_jobs | 设置工作时参与计算的线程数 |
| verbose | 输出工作日志形式 |
在sklearn当中,我们可以使用HalvingGridSearchCV类来实现对半网格搜索。Halving搜索是sklearn 1.0.1版本才新增的功能,因此现在该功能还处于实验阶段,在导入该类的时候需要同时导入用以开启对半网格搜索的辅助功能enable_halving_search_cv。当且仅当该功能被导入时,HalvingGridSearchCV才能够被导入和使用。
import re
import sklearn
import numpy as np
import pandas as pd
import matplotlib as mlp
import matplotlib.pyplot as plt
import time
from sklearn.ensemble import RandomForestRegressor as RFR
from sklearn.experimental import enable_halving_search_cv
from sklearn.model_selection import KFold, HalvingGridSearchCV


param_grid_simple = {'n_estimators': [*range(5,100,5)]
                     , 'max_depth': [*range(25,36,2)]
                     , "max_features": ["log2","sqrt",16,32,64,"auto"]
                    }
#建立回归器、交叉验证
reg = RFR(random_state=1412,verbose=True,n_jobs=12)
cv = KFold(n_splits=5,shuffle=True,random_state=1412)

"""
对半网格搜索(Halving Grid Search)参数的确定:
(需要多尝试)
factor = 1.3 # 每次变化量
n_samples = X.shape[0]
n_splits = 5
min_resources = 100 # 初始样本量
space = 342 # 这时param_grid_simple中每一项参数的个数乘积

for i in range(100):
    if (min_resources*factor**i > n_samples) or (space/factor**i < 1):
        break
    print(i,"本轮迭代样本:{}".format(min_resources*factor**i)
          ,"本轮验证参数组合:{}".format(space//factor**i + 1))

# 通常最后一次剩下的情况不能太大或太小10~20就差不多了。
# 另外最后一次样本进行和训练集大小差不多
"""
#定义随机搜索
search = HalvingGridSearchCV(estimator=reg
                            ,param_grid=param_grid_simple
                            ,factor=1.3
                            ,min_resources=100
                            ,scoring = "neg_mean_squared_error"
                            ,verbose = True
                            ,random_state=1412
                            ,cv = cv
                            ,n_jobs=12)

start = time.time()
search.fit(X,y)
print(time.time() - start)

#查看最佳评估器
search.best_estimator_
"""
RandomForestRegressor(max_depth=31, max_features='sqrt', n_estimators=95,
                      n_jobs=12, random_state=1412, verbose=True)
"""

#查看最佳评估器
abs(search.best_score_)**0.5
# 30915.40250783341
7.2 贝叶斯超参数优化(推荐)
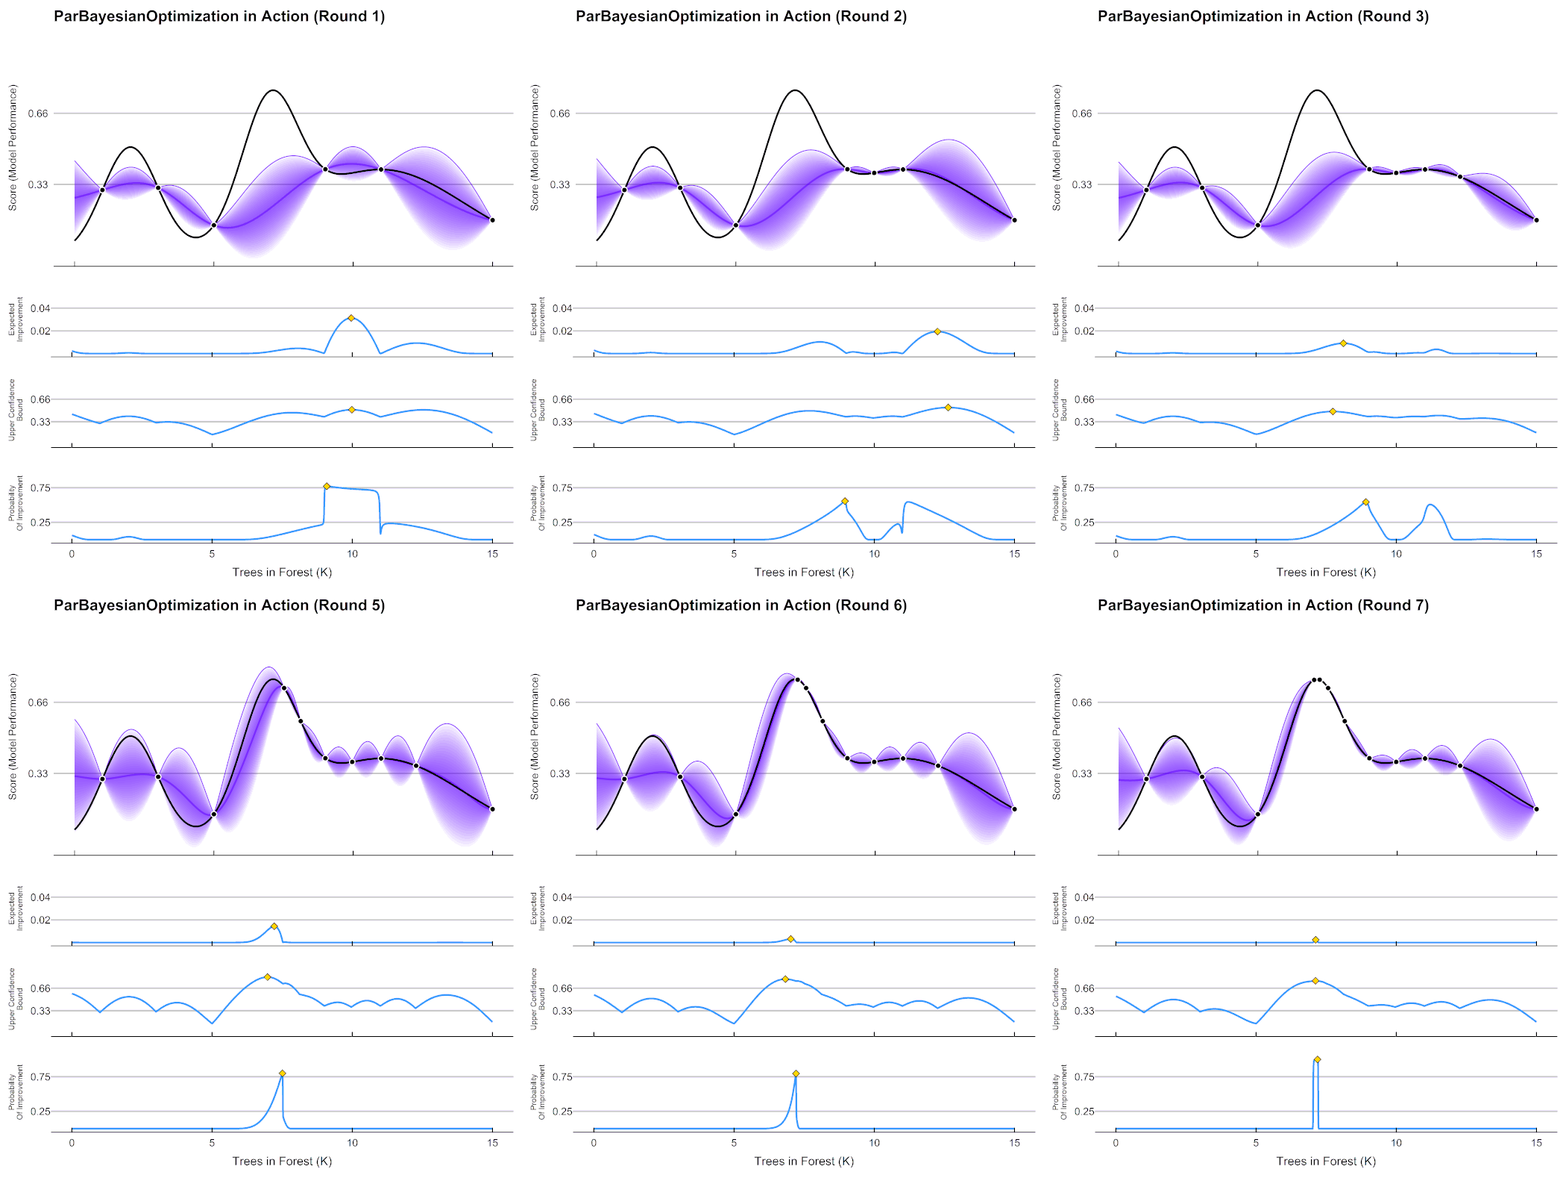
这个方法的基本思想还是通过计算一些点的情况,通过这些确定的点的情况判断附近的点的情况,将可能产生最小值得地方附近计算这里的模型值,通过这里的值进一步判断,(若我们计算了情况A,那么A附近的情况能大致模拟出来,离确定点越近判断结果越可靠,越远波动越大,越不可信。)
在贝叶斯优化的数学过程当中,我们需要有以下步骤:
- 定义需要估计的 f ( x ) f(x) f(x)以及 x x x的定义域。
- 取出有线的 N 个 x N个x N个x上的值,求出这些值对应的 f ( x ) f(x) f(x)也就是求出观测模型的预测值。
- 根据有限的观测值对于函数进行估计,该假设被称为贝叶斯优化中的先验假设,通过该估计 f ∗ f* f∗上的目标值最大值或最小值。
- 定义某种规则以确定下一个需要计算的的观测点。
并持续在 2 − 4 2-4 2−4 步中进行循环,直到假设分布上的目标值达到我们的标准,或者说所有计算资源被用完为止,例如最多观测 M M M 次或者最多运行 t t t 分钟。
7.2.1 BayesOpt实现高斯过程GP(较慢)
from bayes_opt import BayesianOptimization
这个开源比较早,代码简单,不过处理方式较为原始,缺乏阶的提效监控能力,对于算力要求比较高,但是当我们必须要实现基于高斯过程的贝叶斯优化算法的参数空间时并且带有大量的连续性参数时,我们才会考虑使用。
- 过程无法复现,结果可以
- 效率不足,无法提前停止,有时会出现训练相同的参数组合的情况
7.2.1.1 定义目标函数
就是我们首先需要定义一个函数我们给这个函数,一组超参数它会返回给我们该超参数下模型的效果,这个效果可以用损失或者得分来表示。但是有三个影响目标函数定义的规则。
- 目标函数的输入必须是具体的超参数而不能是整个超参数空间,更不能是数据算法等超三数以外的元素。
- 超参数的输入值只能是fud数不支持整数或字符串。
- 只支持寻找 f ( x ) f(x) f(x)最大值,不寻找最小值
通俗点说就是贝叶斯优化会通过这个函数进行判断该参数模型的优劣程度
def bayesopt_objective(n_estimators, max_depth, max_features, min_impurity_decrease):

    # 定义评估器
    # 需要调整的超参数等于目标函数的输入,不需要调整的超参数则直接等于固定值
    # 默认参数输入一定是浮点数,因此需要套上int做强制类型转换成整数
    reg = RFR(n_estimators=int(n_estimators),
              max_depth=int(max_depth),
              max_features=int(max_features),
              min_impurity_decrease=min_impurity_decrease,
              random_state=1412,
              verbose=False,
              n_jobs=-1)
    # 定义损失的输出,5折交叉验证的结果,输出为负根均方误差(-RMSE)
    # 注意,交叉验证需要使用数据,但是我们不能够让数据X,y成为目标函数的输入。
    cv = KFold(n_splits=5, shuffle=True, random_state=1412)
    validation_loss = cross_validate(reg, X, y,
                                     scoring="neg_root_mean_squared_error",
                                     cv=cv,
                                     verbose=False,
                                     n_jobs=-1,
                                     error_score="raise"
                                     # 如果交叉验证出错了。就会显示错误理由
                                     )
    # 交叉验证输出的评估指标是负均方误差,因此本来就是负的失误
    # 目标函数可直接输出该损失的均值
    return np.mean(validation_loss["test_score"])
7.2.1.2 定义参数空间
在任意超参数优化期中优化器中,将参数空格中的超参数组合作为备选组合,一组一组输入到算法中进行训练,在贝叶斯优化中,超参数组合会被输入到我们定义好的目标函数 f ( x ) f(x) f(x)中,在 b a y e s − o p t bayes-opt bayes−opt中我们使用字典方式来定义参数空间,其中参数的名称为键,参数的值为范围值(元组),范围均为双向闭区间。
就是我们网格搜索的范围
# 注意是元组
param_grid_simple = {
    "n_estimators": (80, 100),
    "max_depth": (10, 25),
    "max_feature": (10, 20),
    "min_impurity_decrease": (0, 1)
}
因为参数只支持参数,中间的上界和下界,不支持写步长等参数,所以会直接取闭区间任意的浮点数作为备选参数,因此在填入模型参数中是整数时,我们要强制类型转化成int类型。
7.2.1.3 定义优化目标函数和具体流程
在任意贝叶斯优化算法的实践过程中,一定都会有设计随机性的过程,例如随机抽取点作为观测点,随机抽取部分观测点进行采集函数的计算,在大部分的优化过程中,这种随机性无法控制。即使我们填写了随机种子,优化算法也不能够固定下来,因此我们可以尝试填写随机种子,但需要记住优化算法,每一次运行时都不会一样。
虽然优化算法无法被复现,但是优化算法得出来的最佳超参数结果确实可以复现的,只要优化完毕之后,可以从优化算法的实例化对象中取出最佳参数组合以及最佳分数,该最佳分数组合被输入到交叉验证中是一定可以复现其最佳分数的,如果没有复现,最佳分数则交叉,验证过程的随机种子设置存在问题或者优化算法迭代流程存在问题。
就是通过给定一个初始点量和迭代次数调用目标函数判断优劣程度并作出判断如何进行下一次迭代,最后返回最优值,实际上这部分不一定写成函数形式,不过函数形式好看。
# 定义优化目标函数和具体流程
def param_bayes_opt(param_grid_simple,init_points, n_iter):

    # 定义优化器,先实例化优化器
    opt = BayesianOptimization(f=bayes_objective,  # 需要优化的目标函数
                               pbounds=param_grid_simple,  # 备选参数空间
                               random_state=1412)  # 随机种子,但是从根本上来说无法控制

    # 使用优化器,记住bayes_opt只支持最大化
    opt.maximize(init_points=init_points,  # 抽取多少个初始观测值
                 n_iter=n_iter)  # 一共观测/迭代次数

    # 优化完成,取出最佳参数和最佳分数
    params_best = opt.max["params"]
    score_best = opt.max["target"]
    # 打印最佳参数和最佳分数
    print("\n", "\n", "best params :", params_best)
    print("\n", "\n", "best cvscore :", score_best)
    # 返回最佳参数和最佳分数
    return params_best, score_best
7.2.1.4 验证(非必要)
我们刚才提到最优化方法的最优化参数可以被复现,所以我们定一个函数取出最优化结果观察我们的结果通过结果来判断是否存在问题。
就是将最有参数组复现出来,这个就特别简单
def bayes_opt_validation(params_best):
    reg = RFR(n_estimators=int(params_best["n_estimators"]),
              max_depth=int(params_best["max_depth"]),
              max_features=int(params_best["max_features"]),
              min_impurity_decrease=params_best["min_impurity_decrease"],
              random_state=1412,
              verbose=False,
              n_jobs=-1)
    cv = KFold(n_splits=5, shuffle=True, random_state=1412)
    validation_loss = cross_validate(reg, X, y,
                                     scoring="neg_root_mean_squared_error",
                                     cv=cv,
                                     verbose=False,
                                     n_jobs=-1,
                                     error_score="raise"
                                     # 如果交叉验证出错了。就会显示错误理由
                                     )
    return np.mean(validation_loss["test_score"])
7.2.1.5 执行
import sklearn
import numpy as np
import pandas as pd
from sklearn.model_selection import KFold, cross_validate
from sklearn.ensemble import RandomForestRegressor as RFR
from bayes_opt import BayesianOptimization
import hyperopt
from hyperopt.early_stop import no_progress_loss
import optuna

data = pd.read_csv(
    r"D:\学习资料\sklearn课件\AutoML与超参数优化——菜菜\train_encode.csv", index_col=0)
X = data.iloc[:, :-1]
y = data.iloc[:, -1]

start = time.time()
# 运行贝叶斯
params_best, score_best = param_bayes_opt(
    param_grid_simple, 20, 280)  # 初始化看了20个,观测值后面替代280次
# 记录并计算时间
print("训练时间:%s 分钟" % ((time.time()-start)/60))
# 验证模型结果
validation_score = bayes_opt_validation(params_best)
# 显示最优化模型参数结果
print("\n", "\n", "validation_score: ", validation_score)

"""
 best params : {'max_depth': 22.754861061950113,
 				'max_features': 14.020522796997795,
 			    'min_impurity_decrease': 0.0,
 			    'n_estimators': 88.70408461644216}


 best cvscore : -28385.755008050553
  训练时间:7.725130772590637 分钟

 validation_score:  -28385.755008050553
"""
7.2.2 hyperopt贝叶斯方法(推荐)
使用GBDT进行调参,先根据之前对数据的训练确定GBDT参数大致范围:
7.2.2.1 导包–导入数据–init初始学习器的建立
import sklearn
import numpy as np
import pandas as pd
from sklearn.model_selection import KFold, cross_validate
from sklearn.ensemble import RandomForestRegressor as RFR, GradientBoostingRegressor as GBR
import hyperopt
from hyperopt import hp, tpe, Trials, partial, fmin
from hyperopt.early_stop import no_progress_loss
import optuna

data = pd.read_csv(
    r"D:\学习资料\sklearn课件\AutoML与超参数优化——菜菜\train_encode.csv", index_col=0)
X = data.iloc[:, :-1]
y = data.iloc[:, -1]

# init初始学习器的建立
rf = RFR(n_estimators=22, max_depth=22, max_features=14,
         min_impurity_decrease=0, random_state=1412, verbose=False)
7.2.2.2 定义目标函数
# 这个和BayersOpt相同均是浮点数,若是整型数就要强制类型转换,若需要字符串或者浮点数就不用管
# params是特定的参数空间字典格式,在参数空间的确定会提到
# 若参数已经确定,就可直接填入参数
def hyperopt_objective(params):
    reg = GBR(n_estimators=int(params["n_estimators"]),
              learning_rate=params["learning_rate"],
              criterion=params["criterion"],
              loss=params["loss"],
              max_depth=int(params["max_depth"]),
              max_features=params["max_features"],
              subsample=params["subsample"],
              min_impurity_decrease=params["min_impurity_decrease"],
              init=rf,
              random_state=1412,
              verbose=False)

    cv = KFold(n_splits=5, shuffle=True, random_state=1412)
    validation_loss = cross_validate(reg, X, y,
                                     scoring="neg_root_mean_squared_error",
                                     cv=cv,
                                     verbose=False,
                                     n_jobs=-1,
                                     error_score="raise")
    return np.mean(abs(validation_loss["test_score"]))# 这里和BayesOpt不同,这里使用了绝对值,因为hyperopt支持fmin,最小化
7.2.2.3 参数空间的确定
# 若是整数或者浮点数,并且是需要确定步长使用hp.quniform格式
# 若是字符串形式,用hp.choice格式数据
# hp.quniform("参数名", 起始位置, 结束位置, 步长)
# hp.choice("参数名",参数列表)
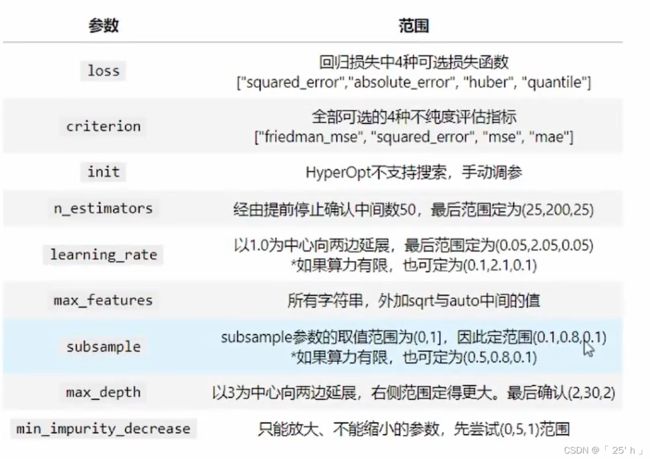
param_grid_simple = {'n_estimators': hp.quniform("n_estimators", 60, 140, 5),
                     "learning_rate": hp.quniform("learning_rate", 0.05, 1.05, 0.02),
                     "criterion": hp.choice("criterion", ["friedman_mse", "squared_error", "mse", "mae"]),
                     "loss": hp.choice("loss", ["squared_error"]),
                     "max_depth": hp.quniform("max_depth", 2, 12, 1),
                     "subsample": hp.quniform("subsample", 0.1, 0.6, 0.05),
                     "max_features": hp.choice("max_features", ["log2", "sqrt", 16,  17, 18, 19, 15, 14, "auto"]),
                     "min_impurity_decrease": hp.quniform("min_impurity_decrease", 0, 10, 0.5)
                     }
7.2.2.4 定义优化目标函数
def param_hyperopt(max_evals=100):
    # 保存迭代过程的对象
    trials = Trials()
    # 设置提前停止,100次迭代,结果都没有减小就停止
    early_stop_fn = no_progress_loss(100)
    # 定义代理模型
    params_best = fmin(hyperopt_objective,  # 目标函数
                       space=param_grid_simple,  # 参数空间
                       algo=tpe.suggest,  # 最优化代理模型
                       max_evals=max_evals,  # 最大迭代次数,默认100
                       verbose=True,  # 显示过程
                       trials=trials,  # 保存迭代过程
                       early_stop_fn=early_stop_fn  # 设置提前停止
                       )
    # 打印最优参数,fmin会自动打印最佳分数
    print("\n", "\n", "best params: ", params_best, "\n")
    # 返回最优参数和迭代过程
    return params_best, trials
7.2.2.5 验证函数(非必要)
def hyperopt_validation(params):
    reg = GBR(n_estimators=int(params["n_estimators"]),
              learning_rate=params["learning_rate"],
              criterion=params["criterion"],
              loss=params["loss"],
              max_depth=int(params["max_depth"]),
              max_features=params["max_features"],
              subsample=params["subsample"],
              min_impurity_decrease=params["min_impurity_decrease"],
              init=rf,
              random_state=1412)  # GBR中的random_state只能够控制特征抽样,不能控制样本抽样, verbose=False
    cv = KFold(n_splits=5, shuffle=True, random_state=1412)
    validation_loss = cross_validate(reg, x, y,
                                     scoring="neg_root_mean_squared_error",
                                     cv=cv,
                                     verbose=False,
                                     n_jobs=-1)
    return np.mean(abs(validation_loss["test_score"]))
7.2.2.6 执行和建议
params_best,trials = param_hyperopt(100)
# 一般使用小于0.1%的空间进行训练
# 在多次调整模型参数范围时,获取最优参数值组时,若有些参数一直未发生变化,可能说明就是最优值,可以将对应参数值下的选项只保留最优的那一个,以缩小参数空间范围,提高效率
# 注意,在经过上面的调整后,需要将目标函数hyperopt_objective中的模型进行调整,将模型参数设置成固定的值
# 根据每一次结果调整参数范围,保证参数空间包含最优值
# 再确定范围后,可以进一步缩小参数空间范围,减小步长或增大迭代次数以确定更加精细的参数范围

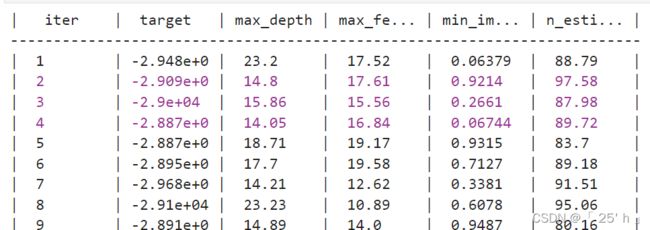
结果:
#损失 best loss: 27549.81165947049
#最优参数:best params:  {'criterion': 3, 'learning_rate': 0.14, 'loss': 0, 'max_depth': 7.0, 'max_features': 0, 'min_impurity_decrease': 3.5, 'n_estimators': 220.0, 'subsample': 0.5}
#注意:若之前定义参数空间使用的是hp.choice,那么最优参数中的取值为索引(主要是整型,定是索引)


# 将参数对应过后,调用验证函数 获取验证结果
hyperopt_validation({'criterion': "mae",
                     'learning_rate': 0.14,
                     'loss': "squared_error",
                     'max_depth': 7,
                     'max_features': "log2",
                     'min_impurity_decrease': 3.5,
                     'n_estimators': 220,
                     'subsample': 0.5})
# 27549.81165947049 和 之前一样
模型存储和读取
import joblib # 导入库函数

# 存储在本地文件,后缀dat,二进制文件
joblib.dump(xgb_model, "D:\\code_management\\xgb_model.dat")
# 读取文件
load_model = joblib.load("D:\\code_management\\xgb_model.dat")


