Opencv-python学习笔记---直方图(histogram)
直方图是一种针对图片像素值的统计工具,通过直方图,你可以对图片像素值的分布有一个直观的了解。
生成直方图
opencv中生成直方图使用cv2.calcHist()函数,函数原型是:
hist = cv.calcHist(images, channels, mask, histSize, ranges[, hist[, accumulate]])
参数解读:
- Images:输入图片集合,如果是单张图片,写为
[img]。 - channels:图片的颜色通道。输入图片是灰度图,则该参数设置为
[0];输入图片是彩色图,该参数可设置为[0]/[1]/[2],分别表示B/G/R通道。 - mask:如果想要对整张图片生成直方图,该参数设置为
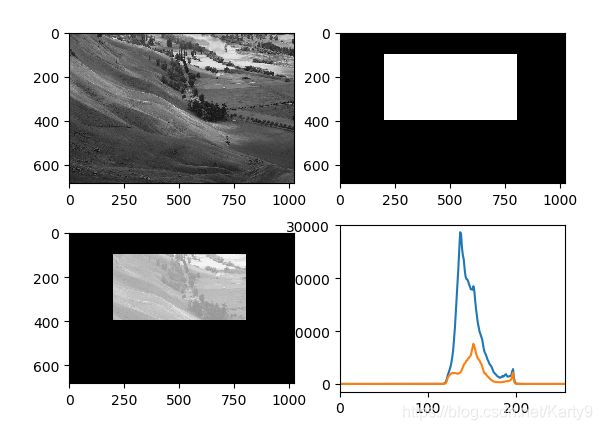
None;如果想要对图片的某一区域生成直方图,则需要传入一数组作为遮罩,后续会解释。 - histSize:直方图切片尺寸,默认值为
[256],表示直方图采样范围是[0,255]。如果设置为16,直方图采样范围是[0,15]∪[16,31]∪……[240,255]。 - ranges:像素值范围,一般设置为
[0,256]。 - hist:输出直方图。
- accumulate:如果该参数设置为
TRUE,直方图在分配的时候不会被清零,可用于动态生成直方图或使用多张图片生成一张直方图。
函数文档:cv2.calcHist()
Numpy中也提供了生成直方图的函数,示例:
hist,bins = np.histogram(img.ravel(),256,[0,256])
绘制直方图
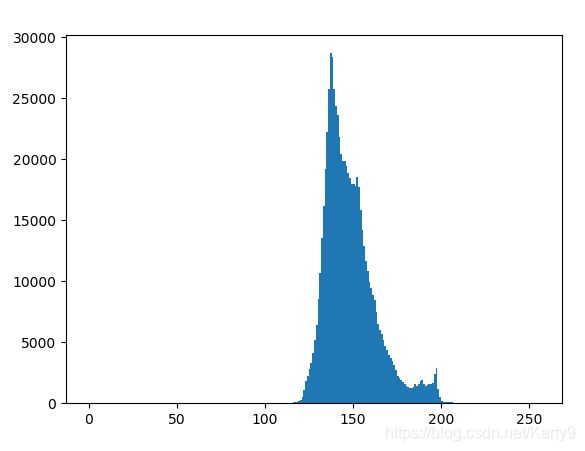
绘制直方图一般使用matplotlib函数,虽然opencv也可以实现,但是太麻烦了。对于以下图片生成直方图。
plt.hist(img.ravel(),256,[0,256])
plt.show()
hist = cv2.calcHist([img],[0],None,[256],[0,256])
plt.plot(hist)
plt.show()
img = cv2.imread('hist.jpg',0)
mask = np.zeros(img.shape,np.uint8)
mask[100:400,200:800] = 255
mask_img = cv2.bitwise_and(img,img,mask=mask)

hist_mask = cv2.calcHist([img],[0],mask,[256],[0,256])
hist_full = cv2.calcHist([img],[0],None,[256],[0,256])
plt.subplot(221),plt.imshow(img,'gray')
plt.subplot(222),plt.imshow(mask,'gray')
plt.subplot(223),plt.imshow(mask_img,'gray')
plt.subplot(224),plt.plot(hist_full),plt.plot(hist_mask)
plt.xlim([0,256])
plt.show()
直方图均衡化
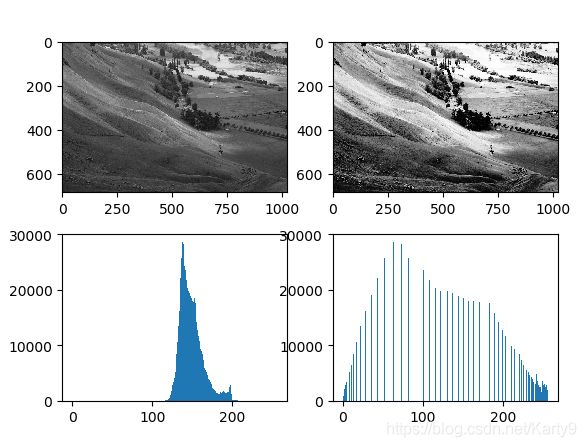
对于以下直方图,像素值分布集中于某个区间,可通过直方图均衡化改善像素值分布。直方图均衡化的知识参考:直方图均衡化

代码示例:
res = cv2.equalizeHist(img)

上面介绍的是针对全图的直方图均衡化,缺点是容易丢失图像细节,还有一种称为自适应均衡化的方法,针对图片中的每一分块进行直方图均衡化,在OpenCV中用到的函数是cv2.createCLAHE(),代码示例:
clahe = cv2.createCLAHE(clipLimit=2.0, tileGridSize=(8, 8))
cl1 = clahe.apply(img)

