吴恩达机器学习作业二:利用逻辑回归模型预测一个学生是否被学校录取 ,二分类问题(python实现)
吴恩达机器学习作业二:利用逻辑回归模型预测一个学生是否被学校录取(python实现)
该文是针对吴恩达机器学习逻辑回归章节作业任务一,利用逻辑回归模型预测一个学生是否被学校录取,区别于任务二中利用正则化逻辑回归模型预测来自制造工厂的微芯片是否通过质量保证见博客:传送门
文章目录
-
- 吴恩达机器学习作业二:利用逻辑回归模型预测一个学生是否被学校录取(python实现)
-
- 任务
-
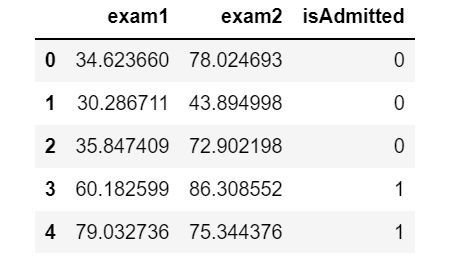
- 读取数据
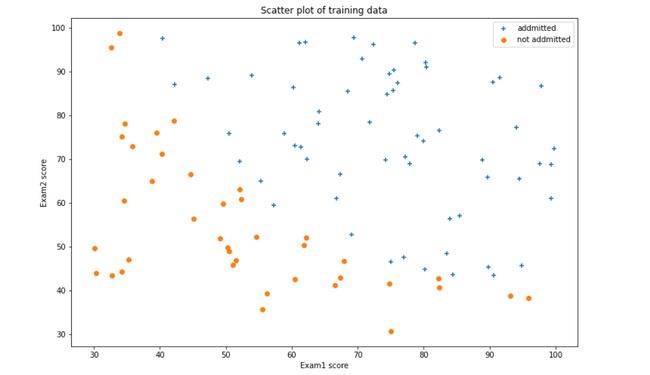
- 绘制数据,看下数据分布情况
- 数据预处理
- Sigmod函数
- 代价函数(Cost function)
- 梯度函数
- 寻找最优化参数(scipy.opt.fmin_tnc()函数)
- 模型评估(准确率计算)
- 决策边界
- 全部代码
- 训练数据链接
任务
In this part of the exercise, you will build a logistic regression model to predict whether a student gets admitted into a university. Suppose that you are the administrator of a university department and you want to determine each applicant’s chance of admission based on their results on two exams. You have historical data from previous applicants that you can use as a training set for logistic regression. For each training example, you have the applicant’s scores on two exams and the admissions decision. Your task is to build a classification model that estimates an applicant’s probability of admission based the scores from those two exams.
建立一个逻辑回归模型来预测一个学生是否会被大学录取。
假设您是大学部门的管理员,您想根据申请人的两次考试成绩来确定他们的入学机会。
您有来自以前申请人的历史数据,可以用作逻辑回归的训练集。对于每个培训示例,都有申请人的两次考试成绩和录取决定。
您的任务是建立一个分类模型,根据这两门考试的分数估计申请人被录取的概率。
import numpy as np
import pandas as pd
import matplotlib.pyplot as plt
读取数据
#读取数据
data=pd.read_csv("../code/ex2-logistic regression/ex2data1.txt",delimiter=',',header=None,names=['exam1','exam2','isAdmitted'])
print(data)
data.head()
绘制数据,看下数据分布情况
#数据可视化
admittedData=data[data['isAdmitted'].isin([1])]
noAdmittedData=data[data['isAdmitted'].isin([0])]
fig,ax=plt.subplots(figsize=(12,8))
ax.scatter(admittedData['exam1'],admittedData['exam2'],marker='+',label='addmitted')
ax.scatter(noAdmittedData['exam1'],noAdmittedData['exam2'],marker='o',label="not addmitted")
ax.legend(loc=1)
ax.set_xlabel('Exam1 score')
ax.set_ylabel('Exam2 score')
ax.set_title("Scatter plot of training data")
plt.show()
数据预处理
#在逻辑回归模型中,x0=1,即训练数据应该添加一列,值为1
data.insert(0, 'ones',1)
loc=data.shape[1]
X=np.array(data.iloc[:,0:loc-1])
Y=np.array(data.iloc[:,loc-1:loc])
theta=np.zeros(X.shape[1])
X.shape,Y.shape,theta.shape
((100, 3), (100, 1), (3,))
值得注意的是此处theta初始化值为0,并且使用的是一维数组,这是因为在后面求解最优化theta值时采用的scipy.opt.fmin_tnc()函数传入的参数theta必须是一维数组
Sigmod函数
def sigmoid(z):
    return 1/(1+np.exp(-z))
代价函数(Cost function)
def computeCost(theta,X,Y):
    theta = np.matrix(theta) #不能缺少,因为参数theta是一维数组,进行矩阵想乘时要把theta先转换为矩阵
    h=sigmoid(np.dot(X,(theta.T)))
    a=np.multiply(-Y,np.log(h))
    b=np.multiply((1-Y),np.log(1-h))
    return np.sum(a-b)/len(X)
computeCost(theta,X,Y)  #当theta值为0时,计算此时的代价值
0.6931471805599453
梯度函数
def gradient(theta,X,Y):
    theta = np.matrix(theta) #要先把theta转化为矩阵
    h=sigmoid(np.dot(X,(theta.T)))
    grad=np.dot(((h-Y).T),X)/len(X)
    return np.array(grad).flatten()  #因为下面寻找最优化参数的函数(opt.fmin_tnc())要求传入的gradient函返回值需要是一维数组,因此需要利用flatten()将grad进行转换以下

gradient(theta,X,Y) #测试一下,当theta值都为为0时,计算一下此时的梯度为多少
array([ -0.1 , -12.00921659, -11.26284221])
寻找最优化参数(scipy.opt.fmin_tnc()函数)
在实现线性回归时,是利用梯度下降的方式来寻找最优参数。
在此处使用scipy.optimize包下的fmin_tnc函数来求解最优参数,该函数利用截断牛顿算法中的梯度信息,最小化具有受边界约束的变量的函数。
import scipy.optimize as opt
result = opt.fmin_tnc(func=computeCost, x0=theta, fprime=gradient, args=(X, Y))
print(result)
theta=result[0]
(array([-25.16131853, 0.20623159, 0.20147149]), 36, 0)
scipy.opt.fmin_tnc()函数
函数常用参数值解释:
func:优化的目标函数 (在这里要优化的是代价函数)
x0:初始值,必须是一维数组 (在这里传的是一维的theta)
fprime:提供优化函数func的梯度函数,不然优化函数func必须返回函数值和梯度,或者设置approx_grad=True (在这里梯度函数是gradient函数,并且要求返回的是一维数组)
args:元组,是传递给优化函数的参数
函数返回值解释:
x : 数组,返回的优化问题目标值 (在这里即优化后,theta的最终取值)
nfeval:整数,功能评估的数量。在进行优化的时候,每当目标优化函数被调用一次,就算一个function evaluation。在一次迭代过程中会有多次function evaluation。这个参数不等同于迭代次数,而往往大于迭代次数。
rc: int,返回码
模型评估(准确率计算)
在求得最优theta值后,利用得到的模型在训练数据中进行预测,并求准确率。
由逻辑回归的假设模型可知:
当hθ(x)>=0.5时,预测y=1;
当hθ(x)<0.5时,预测y=0;
predict函数:通过训练数据以及theta值进行预测,并且把预测结果使用列表返回;
hypothesis=[1 if a==b else 0 for (a,b)in zip(predictValues,Y)] 目的是将预测值与实际值进行比较,如果二者相等,则为1,否则为0;
accuracy=hypothesis.count(1)/len(hypothesis) 计算hypothesis中1的个数然后除以总的长度,得到准确率
def predict(theta, X):
    theta = np.matrix(theta)
    temp = sigmoid(X * theta.T)
    #print(temp)
    return [1 if x >= 0.5 else 0 for x in temp]

predictValues=predict(theta,X)
hypothesis=[1 if a==b else 0 for (a,b)in zip(predictValues,Y)]
accuracy=hypothesis.count(1)/len(hypothesis)
print ('accuracy = {0}%'.format(accuracy*100))
accuracy = 89.0%
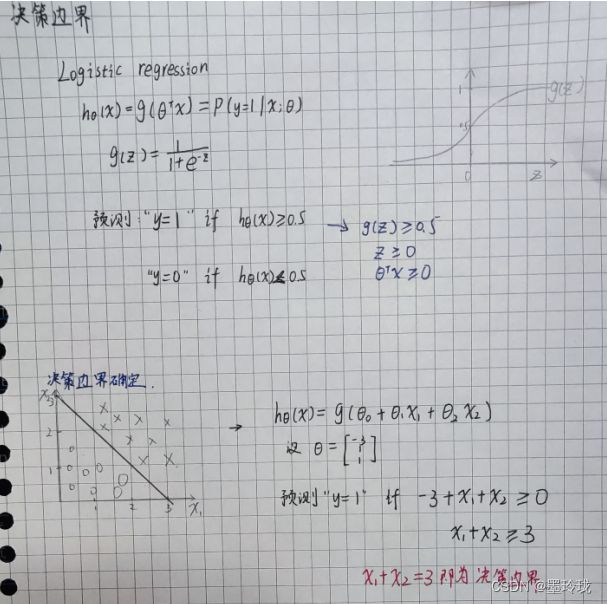
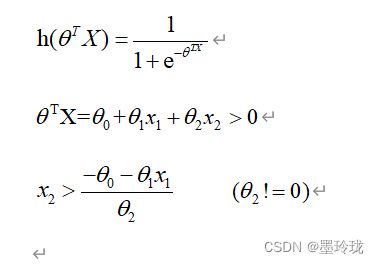
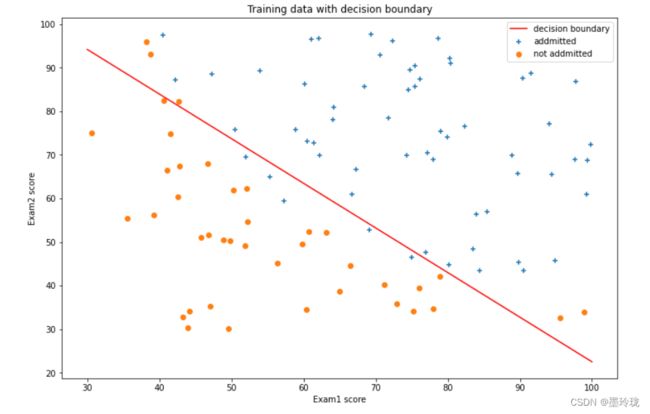
决策边界
#决策边界
def find_x2(x1,theta):
    return [(-theta[0]-theta[1]*x_1)/theta[2] for x_1 in x1]
x1 = np.linspace(30, 100, 1000)
x2=find_x2(x1,theta)

#数据可视化
#数据可视化
admittedData=data[data['isAdmitted'].isin([1])]
noAdmittedData=data[data['isAdmitted'].isin([0])]
fig,ax=plt.subplots(figsize=(12,8))
ax.scatter(admittedData['exam1'],admittedData['exam2'],marker='+',label='addmitted')
ax.scatter(noAdmittedData['exam2'],noAdmittedData['exam1'],marker='o',label="not addmitted")
ax.plot(x1,x2,color='r',label="decision boundary")
ax.legend(loc=1)
ax.set_xlabel('Exam1 score')
ax.set_ylabel('Exam2 score')
ax.set_title("Training data with decision boundary")
plt.show()
全部代码
import numpy as np
import pandas as pd
import matplotlib.pyplot as plt
import scipy.optimize as opt

#sigmoid函数
def sigmoid(z):
    return 1/(1+np.exp(-z))

#代价函数
def computeCost(theta,X,Y):
    theta = np.matrix(theta) #不能缺少,因为参数theta是一维数组,进行矩阵想乘时要把theta先转换为矩阵
    h=sigmoid(np.dot(X,(theta.T)))
    a=np.multiply(-Y,np.log(h))
    b=np.multiply((1-Y),np.log(1-h))
    return np.sum(a-b)/len(X)

#梯度函数
def gradient(theta,X,Y):
    theta = np.matrix(theta) #要先把theta转化为矩阵
    h=sigmoid(np.dot(X,(theta.T)))
    grad=np.dot(((h-Y).T),X)/len(X)
    return np.array(grad).flatten()  #因为下面寻找最优化参数的函数(opt.fmin_tnc())要求传入的gradient函返回值需要是一维数组,因此需要利用flatten()将grad进行转换以下

#模型预测
def predict(theta, X):
    theta = np.matrix(theta)
    temp = sigmoid(X * theta.T)
    #print(temp)
    return [1 if x >= 0.5 else 0 for x in temp]

#决策边界
def find_x2(x1,theta):
    return [(-theta[0]-theta[1]*x_1)/theta[2] for x_1 in x1]

#读取数据
data=pd.read_csv("../code/ex2-logistic regression/ex2data1.txt",delimiter=',',header=None,names=['exam1','exam2','isAdmitted'])

#数据可视化,看一下数据分布情况
admittedData=data[data['isAdmitted'].isin([1])]
noAdmittedData=data[data['isAdmitted'].isin([0])]
fig,ax=plt.subplots(figsize=(12,8))
ax.scatter(admittedData['exam1'],admittedData['exam2'],marker='+',label='addmitted')
ax.scatter(noAdmittedData['exam1'],noAdmittedData['exam2'],marker='o',label="not addmitted")
ax.legend(loc=1)
ax.set_xlabel('Exam1 score')
ax.set_ylabel('Exam2 score')
ax.set_title("Scatter plot of training data")
plt.show()

#数据预处理
data.insert(0, 'ones',1)
loc=data.shape[1]
X=np.array(data.iloc[:,0:loc-1])
Y=np.array(data.iloc[:,loc-1:loc])
theta=np.zeros(X.shape[1])
X.shape,Y.shape,theta.shape

#寻找最优化参数theta
result = opt.fmin_tnc(func=computeCost, x0=theta, fprime=gradient, args=(X, Y))
theta=result[0]

#模型评估(准确率计算)
predictValues=predict(theta,X)
hypothesis=[1 if a==b else 0 for (a,b)in zip(predictValues,Y)]
accuracy=hypothesis.count(1)/len(hypothesis)
print ('accuracy = {0}%'.format(accuracy*100))

#决策边界,数据可视化
x1 = np.linspace(30, 100, 1000)
x2=find_x2(x1,theta)
admittedData=data[data['isAdmitted'].isin([1])]
noAdmittedData=data[data['isAdmitted'].isin([0])]
fig,ax=plt.subplots(figsize=(12,8))
ax.scatter(admittedData['exam1'],admittedData['exam2'],marker='+',label='addmitted')
ax.scatter(noAdmittedData['exam2'],noAdmittedData['exam1'],marker='o',label="not addmitted")
ax.plot(x1,x2,color='r',label="decision boundary")
ax.legend(loc=1)
ax.set_xlabel('Exam1 score')
ax.set_ylabel('Exam2 score')
ax.set_title("Training data with decision boundary")
plt.show()
训练数据链接
链接:https://pan.baidu.com/s/1kwQjf8cEa7b8H7EpARszjg
提取码:dghs
