【金融系列】【statsmodels】如何用Python做实证研究?介绍一个功能和STATA很像的Python包,最小二乘,虚拟变量
博主本科接触的研究主要是公司金融方向的研究,在公司金融的实证研究中,我们的终极目标是建立变量间的因果关系。我们需要识别因果关系,来检验理论、评价政策效果、或作出预测。目前该领域的研究大部分是使用了STATA和R这两种工具来开展研究的,其实作为开放性极强、实现更为快速的Python也可用于这方面的研究,并且我自认为使用Python还具有以下有点(或许还有更多):1、数据预处理更方便;2、模型建立逻辑更清晰;3、代码可重用性更强;4、可以更方便使用面向对象思想对研究模型进行封装;6、结合matplotlib等工具使得对数据、实证结果的展示可以更加丰富多彩;5、在教学中使用Python更能帮助学生理解模型建立的逻辑(STATA的“懒人式”命令往往会让学生不去理解模型构建逻辑,只去记忆命令)。本文就将介绍一下statsmodels这一实现了很多STATA中的功能的模块。并且对一篇《金融研究》的论文进行部分结果的复现。
求三连!数据、代码和论文地址:
链接:https://pan.baidu.com/s/1Khy6-jZDTn9DMoz267NfFA?pwd=sv4i
提取码:sv4i
目录
1.statsmodels安装与模块功能简介
Regression¶回归
Imputation¶插值处理
Generalized Estimating Equations¶广义估计方程
Generalized Linear Models¶广义线性模型
Discrete and Count Models¶离散模型
Multivariate Models¶多元模型
Other Models¶其他模型
Graphics¶画图
Statistics¶描述性统计
Tools
2.示例:论文复现
2.1 论文情况简介
2.2 代际流动性时间趋势图绘制
2.3 基准回归及实现
1.statsmodels安装与模块功能简介
pip install statsmodelsstatsmodels的API文档链接:
API Reference — statsmodels
Statsmodels库是Python中一个强大的统计分析库,包含假设检验、回归分析、时间序列分析等功能,能够很好的和Numpy和Pandas等库结合起来,提高工作效率。
Regression¶回归
| 函数 | 功能 | 解释 |
| OLS(endog[, exog, missing, hasconst]) |
Ordinary Least Squares |
普通最小二乘 |
| WLS(endog, exog[, weights, missing, hasconst]) |
Weighted Least Squares |
带权重的最小二乘(用于解决异方差性) |
| GLS(endog, exog[, sigma, missing, hasconst]) |
Generalized Least Squares |
广义最小二乘(放弃残差平稳假设,残差带噪声时使用) |
| GLSAR(endog[, exog, rho, missing, hasconst]) |
Generalized Least Squares with AR covariance structure |
带AR (p)协方差结构的广义最小二乘 |
| RecursiveLS(endog, exog[, constraints]) |
Recursive least squares |
递归最小二乘,参考: Durbin, James, and Siem Jan Koopman. 2012. Time Series Analysis by State Space Methods: Second Edition. Oxford University Press. |
| RollingOLS(endog, exog[, window, min_nobs, ...]) |
Rolling Ordinary Least Squares |
|
| RollingWLS(endog, exog[, window, weights, ...]) |
Rolling Weighted Least Squares |
Imputation¶插值处理
数据缺失值处理可分两类。一类是删除缺失数据,一类是进行数据插补。进行有效的数据差补能够简历更好的回归。
| BayesGaussMI(data[, mean_prior, cov_prior, ...]) |
Bayesian Imputation using a Gaussian model. |
| MI(imp, model[, model_args_fn, ...]) |
MI performs multiple imputation using a provided imputer object. |
| MICE(model_formula, model_class, data[, ...]) |
Multiple Imputation with Chained Equations. |
| MICEData(data[, perturbation_method, k_pmm, ...]) |
Wrap a data set to allow missing data handling with MICE. |
Generalized Estimating Equations¶广义估计方程
广义估计方程是一种研究纵向数据(比如重复测量数据,面板数据)的方法。
同一测量对象的多次测量数据结果之间很可能有着相关关系,如果不考虑数据之间的相关性会造成信息损失。常见的研究模型(比如线性回归)都要求数据之间独立,此时可使用广义估计方程进行研究。
| GEE(endog, exog, groups[, time, family, ...]) |
Marginal Regression Model using Generalized Estimating Equations. |
| NominalGEE(endog, exog, groups[, time, ...]) |
Nominal Response Marginal Regression Model using GEE. |
| OrdinalGEE(endog, exog, groups[, time, ...]) |
Ordinal Response Marginal Regression Model using GEE |
Generalized Linear Models¶广义线性模型
在广义线性模型中,相比简单线性模型,这是对因变量Y进行了变换,使变换后的Y和X呈线性关系
| GLM(endog, exog[, family, offset, exposure, ...]) |
Generalized Linear Models |
| GLMGam(endog[, exog, smoother, alpha, ...]) |
Generalized Additive Models (GAM) |
| BinomialBayesMixedGLM(endog, exog, exog_vc, ...) |
Generalized Linear Mixed Model with Bayesian estimation |
| PoissonBayesMixedGLM(endog, exog, exog_vc, ident) |
Generalized Linear Mixed Model with Bayesian estimation |
Discrete and Count Models¶离散模型
| Logit(endog, exog[, check_rank]) |
Logit Model |
| Probit(endog, exog[, check_rank]) |
Probit Model |
| MNLogit(endog, exog[, check_rank]) |
Multinomial Logit Model |
| OrderedModel(endog, exog[, offset, distr]) |
Ordinal Model based on logistic or normal distribution |
| Poisson(endog, exog[, offset, exposure, ...]) |
Poisson Model |
| NegativeBinomial(endog, exog[, ...]) |
Negative Binomial Model |
| NegativeBinomialP(endog, exog[, p, offset, ...]) |
Generalized Negative Binomial (NB-P) Model |
| GeneralizedPoisson(endog, exog[, p, offset, ...]) |
Generalized Poisson Model |
| ZeroInflatedPoisson(endog, exog[, ...]) |
Poisson Zero Inflated Model |
| ZeroInflatedNegativeBinomialP(endog, exog[, ...]) |
Zero Inflated Generalized Negative Binomial Model |
| ZeroInflatedGeneralizedPoisson(endog, exog) |
Zero Inflated Generalized Poisson Model |
Multivariate Models¶多元模型
| Factor([endog, n_factor, corr, method, smc, ...]) |
Factor analysis |
| MANOVA(endog, exog[, missing, hasconst]) |
Multivariate Analysis of Variance |
| PCA(data[, ncomp, standardize, demean, ...]) |
Principal Component Analysis |
Other Models¶其他模型
MixedLM线性混合效应模型Linear Mixed Effects Model,这种模型结合了固定效应和随机效应。当使用存在内部聚集效应和重复测量数据时采用。研究中用的比较多。
SurvfuncRight和PHReg不太懂,貌似跟生存分析有关系,医学上用的比较多?
Quantile Regression分位数回归,金融的研究中用的也比较多,对于截尾拖尾数据很有效,有时候OLS无法探究的关系可以靠分位数回归搞定。
Robust Linear Model稳健线性模型,是能够较好应对数据中的极端值的模型,能够削弱偶然出现的极端值对模型的影响,在量化投资中应用较多,用于削弱有些极端变化但是对股价影响并不大的因子。
| MixedLM(endog, exog, groups[, exog_re, ...]) |
Linear Mixed Effects Model |
| SurvfuncRight(time, status[, entry, title, ...]) |
Estimation and inference for a survival function. |
| PHReg(endog, exog[, status, entry, strata, ...]) |
Cox Proportional Hazards Regression Model |
| QuantReg(endog, exog, **kwargs) |
Quantile Regression |
| RLM(endog, exog[, M, missing]) |
Robust Linear Model |
| BetaModel(endog, exog[, exog_precision, ...]) |
Beta Regression. |
Graphics¶画图
| ProbPlot(data[, dist, fit, distargs, a, ...]) |
Q-Q and P-P Probability Plots |
|
| qqline(ax, line[, x, y, dist, fmt]) |
Plot a reference line for a qqplot. |
|
| qqplot qqplot(data[, dist, distargs, a, loc, ...]) |
Q-Q plot of the quantiles of x versus the quantiles/ppf of a distribution. |
|
| qqplot_2samples(data1, data2[, xlabel, ...]) |
Q-Q Plot of two samples' quantiles. |
Statistics¶描述性统计
| Description(data[, stats, numeric, ...]) |
Extended descriptive statistics for data |
| describe(data[, stats, numeric, ...]) |
Extended descriptive statistics for data |
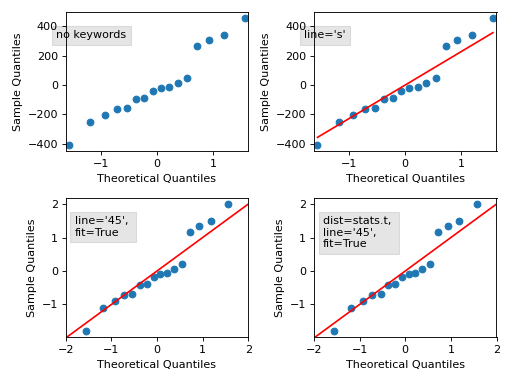
例子:
Tools
add_constant很有用,为数据添加一列1进行截距项的回归。
| test([extra_args, exit]) |
Run the test suite |
| add_constant(data[, prepend, has_constant]) |
Add a column of ones to an array. |
| load_pickle(fname) |
Load a previously saved object |
| show_versions([show_dirs]) |
List the versions of statsmodels and any installed dependencies |
| webdoc([func, stable]) |
Opens a browser and displays online documentation其他 |
除了上述功能外,还有诸如Univariate Time-Series Analysis(单变量时间序列分析)、Multivariate Time Series Models(多元时间序列模型)、Filters and Decompositions(过滤降维算法)、Markov Regime Switching Models(马尔科夫机制转换模型)等等。
2.示例:论文复现
为了给出一个实际的例子,加深学习印象,选择了一篇发表在《金融研究》上的论文对其进行部分复现。
2.1 论文情况简介
义务教育能提高代际流动性吗? - 中国知网![]() https://kns.cnki.net/kcms/detail/detail.aspx?dbcode=CJFD&dbname=CJFDLAST2021&filename=JRYJ202106005&uniplatform=NZKPT&v=Dy2OTtraPRzoUOo03HDEpf09y-Qrk1KRueN9Eqk7cqjes2XjVzLZJ9e_ywxmTen1
https://kns.cnki.net/kcms/detail/detail.aspx?dbcode=CJFD&dbname=CJFDLAST2021&filename=JRYJ202106005&uniplatform=NZKPT&v=Dy2OTtraPRzoUOo03HDEpf09y-Qrk1KRueN9Eqk7cqjes2XjVzLZJ9e_ywxmTen1
[1]陈斌开,张淑娟,申广军.义务教育能提高代际流动性吗?[J].金融研究,2021(06):76-94.
依赖包导入:
import matplotlib.pyplot as plt
import numpy as np
import pandas as pd
import statsmodels.api as sm
import statsmodels
np.random.seed(2022)
数据导入:
data = pd.read_excel(r'data_merge2.xlsx')#这里改成你的数据所在文件的路径数据预览:
data| hhcode | coun | househead | gender | birthyear | nationality | siblings | hukou | education | ChildEdu | ... | Educorr1 | Educorr2 | Educorr3 | Educorr4 | Educorr5 | PY | x | Eligibility | fa_work | birthyear_groupby5 | |||||||||
|---|---|---|---|---|---|---|---|---|---|---|---|---|---|---|---|---|---|---|---|---|---|---|---|---|---|---|---|---|---|
| 家庭编码 | 县区编码 | 是否是户主 | 性别 | 出生年份 | 民族 | 子女个数 | 户口 | 受教育程度 | 受教育年限 | 父亲受教育程度 | 母亲受教育程度 | 父亲职业 | 母亲职业 | 父亲受教育年限 | 母亲受教育年限 | 父母平均受教育年限 | 省份 | 父母最高受教育年限 | 父母最低受教育年限 | 相关系数:衡量代际流动性 | 义务教育政策开始年份 | 义务教育开始时年龄 | 受义务教育影响程度大小 | 父亲职业分组 | |||||
| 0 | 1101065303202 | 110106 | 1 | 2 | 1976 | 1.0 | 0.0 | 1.0 | 3.0 | 9.0 | ... | 0.214808 | 0.503370 | 0.349154 | 0.245640 | 0.554755 | 1986 | 10 | 0.666667 | NaN | 0 | ||||||||
| 1 | 1101065306101 | 110106 | 1 | 1 | 1957 | 1.0 | 2.0 | 1.0 | 2.0 | 5.0 | ... | 0.276842 | 0.123774 | 0.207662 | 0.276842 | 0.137444 | 1986 | 29 | 0.000000 | NaN | 1 | ||||||||
| 2 | 1101065309001 | 110106 | 1 | 1 | 1960 | 1.0 | 2.0 | 1.0 | 3.0 | 8.0 | ... | 0.146180 | 0.355535 | 0.267936 | 0.190255 | 0.311783 | 1986 | 26 | 0.000000 | NaN | 2 | ||||||||
| 3 | 1101065311101 | 110106 | 1 | 2 | 1936 | 1.0 | 1.0 | 1.0 | 1.0 | NaN | ... | 0.790569 | 0.607143 | 0.852116 | 0.790569 | 0.607143 | 1986 | 50 | 0.000000 | NaN | 3 | ||||||||
| 4 | 1101066100401 | 110106 | 1 | 1 | 1976 | 1.0 | 1.0 | 1.0 | 3.0 | 9.0 | ... | 0.214808 | 0.503370 | 0.349154 | 0.245640 | 0.554755 | 1986 | 10 | 0.666667 | NaN | 4 | ||||||||
| ... | ... | ... | ... | ... | ... | ... | ... | ... | ... | ... | ... | ... | ... | ... | ... | ... | ... | ... | ... | ... | ... | ||||||||
| 32917 | 6210210205901 | 621021 | 2 | 2 | 1975 | 1.0 | 2.0 | 1.0 | 2.0 | 5.0 | ... | 0.359305 | 0.449707 | 0.471492 | 0.354519 | 0.483449 | 1991 | 16 | 0.000000 | 11.0 | 5 | ||||||||
| 32918 | 6210210209201 | 621021 | 2 | 2 | 1959 | 1.0 | 3.0 | 1.0 | 2.0 | 5.0 | ... | 0.501423 | 0.196046 | 0.467181 | 0.501423 | 0.196046 | 1991 | 32 | 0.000000 | 11.0 | 6 | ||||||||
| 32919 | 6210210210501 | 621021 | 2 | 1 | 1977 | 1.0 | 2.0 | 1.0 | 2.0 | 5.0 | ... | 0.443866 | 0.404331 | 0.498954 | 0.434100 | 0.432057 | 1991 | 14 | 0.222222 | 11.0 | 7 | ||||||||
| 32920 | 6210210211801 | 621021 | 2 | 2 | 1984 | 1.0 | 0.0 | 1.0 | 3.0 | 8.0 | ... | -0.018009 | 0.337699 | 0.167929 | 0.147695 | 0.144852 | 1991 | 7 | 1.000000 | 11.0 | 8 | ||||||||
| 32921 | 6210220110401 | 621022 | 2 | 2 | 1979 | 1.0 | 1.0 | 1.0 | 3.0 | 8.0 | ... | 0.611632 | 0.232354 | 0.528778 | 0.610094 | 0.306826 | 1991 | 12 | 0.444444 | 11.0 | |||||||||
32922 rows × 30 columns
描述性统计:
data.describe()| coun | househead | gender | birthyear | nationality | siblings | hukou | education | ChildEdu | father_edu | ... | Educorr1 | Educorr2 | Educorr3 | Educorr4 | Educorr5 | PY | x | Eligibility | fa_work | birthyear_groupby5 | |
|---|---|---|---|---|---|---|---|---|---|---|---|---|---|---|---|---|---|---|---|---|---|
| count | 32922.000000 | 32922.000000 | 32922.000000 | 32922.000000 | 32916.000000 | 32785.000000 | 32914.000000 | 32911.000000 | 31999.000000 | 31195.000000 | ... | 32575.000000 | 31706.000000 | 32586.000000 | 32578.000000 | 31578.000000 | 32922.000000 | 32922.000000 | 32922.000000 | 25588.000000 | 32922.000000 |
| mean | 382013.629549 | 1.478677 | 1.506105 | 1962.923881 | 1.339318 | 2.870581 | 1.552956 | 3.342196 | 8.255899 | 1.858856 | ... | 0.329442 | 0.307071 | 0.357607 | 0.337348 | 0.306641 | 1987.269273 | 24.345392 | 0.145553 | 11.286931 | 7.998937 |
| std | 135042.465042 | 0.499553 | 0.499970 | 11.895852 | 1.406428 | 1.754655 | 0.686343 | 1.781469 | 3.639925 | 1.210058 | ... | 0.177946 | 0.178255 | 0.181399 | 0.177930 | 0.175811 | 1.726825 | 11.973904 | 0.308486 | 0.521000 | 4.898945 |
| min | 110101.000000 | 1.000000 | 1.000000 | 1916.000000 | 1.000000 | -1.000000 | 1.000000 | -1.000000 | 0.000000 | 1.000000 | ... | -1.000000 | -1.000000 | -1.000000 | -1.000000 | -1.000000 | 1986.000000 | -12.000000 | 0.000000 | 9.000000 | 0.000000 |
| 25% | 321002.000000 | 1.000000 | 1.000000 | 1955.000000 | 1.000000 | 2.000000 | 1.000000 | 2.000000 | 6.000000 | 1.000000 | ... | 0.234758 | 0.198073 | 0.257497 | 0.241156 | 0.210418 | 1986.000000 | 16.000000 | 0.000000 | 11.000000 | 4.000000 |
| 50% | 411421.000000 | 1.000000 | 2.000000 | 1964.000000 | 1.000000 | 3.000000 | 1.000000 | 3.000000 | 8.000000 | 2.000000 | ... | 0.340944 | 0.322726 | 0.366655 | 0.343839 | 0.315769 | 1987.000000 | 23.000000 | 0.000000 | 11.000000 | 8.000000 |
| 75% | 445381.000000 | 2.000000 | 2.000000 | 1971.000000 | 1.000000 | 4.000000 | 2.000000 | 4.000000 | 10.000000 | 2.000000 | ... | 0.426330 | 0.414291 | 0.466546 | 0.438355 | 0.418991 | 1987.000000 | 33.000000 | 0.000000 | 12.000000 | 12.000000 |
| max | 621121.000000 | 2.000000 | 2.000000 | 1999.000000 | 8.000000 | 12.000000 | 4.000000 | 9.000000 | 21.000000 | 9.000000 | ... | 1.000000 | 1.000000 | 1.000000 | 1.000000 | 1.000000 | 1992.000000 | 72.000000 | 1.000000 | 13.000000 | 16.000000 |
8 rows × 29 columns
2.2 代际流动性时间趋势图绘制
import matplotlib as mpl
import matplotlib.pyplot as plt
data_draw = data.loc[data["Educorr1"] >0]
data_draw = data_draw.loc[data_draw["Educorr2"] >0]
data_draw = data_draw.loc[data_draw["Educorr3"] >0]
data_draw = data_draw.loc[data_draw["Educorr4"] >0]
#设置字体
plt.rcParams['font.family'] = 'FangSong'   # 设置字体为仿宋
plt.figure()

# 绘制一个子图,其中row=2,co1=2,该子图占第1个位置
plt.subplot(2, 2, 1)
plt.scatter(data_draw['birthyear'], data_draw['Educorr1'], color="black", s=10, zorder=1)
z = np.polyfit(data_draw.dropna()['birthyear'], data_draw.dropna()['Educorr1'], 1)
p = np.poly1d(z)
plt.plot(data_draw.dropna()['birthyear'],p(data_draw.dropna()['birthyear']),"r--")

plt.ylabel("教育流动性", fontsize=12)
# 绘制一个子图,其中row=2,col=2,该子图占第2个位置
plt.subplot(2, 2, 2)
plt.scatter(data_draw['birthyear'], data_draw['Educorr2'], color="blue", s=10, zorder=1)
z = np.polyfit(data_draw.dropna()['birthyear'], data_draw.dropna()['Educorr2'], 1)
p = np.poly1d(z)
plt.plot(data_draw.dropna()['birthyear'],p(data_draw.dropna()['birthyear']),"r--")


plt.subplot(2, 2, 3)
plt.scatter(data_draw['birthyear'], data_draw['Educorr3'], color="green", s=10, zorder=1)
z = np.polyfit(data_draw.dropna()['birthyear'], data_draw.dropna()['Educorr3'], 1)
p = np.poly1d(z)
plt.plot(data_draw.dropna()['birthyear'],p(data_draw.dropna()['birthyear']),"r--")
plt.xlabel("出生年份", fontsize=12)
plt.ylabel("教育流动性", fontsize=12)

plt.subplot(2, 2, 4)
plt.scatter(data_draw['birthyear'], data_draw['Educorr4'], color="yellow", s=10, zorder=1)
z = np.polyfit(data_draw.dropna()['birthyear'], data_draw.dropna()['Educorr4'], 1)
p = np.poly1d(z)
plt.plot(data_draw.dropna()['birthyear'],p(data_draw.dropna()['birthyear']),"r--")
plt.suptitle("代际流动性的时间趋势图", fontsize=15)    #默认字体大小为12
plt.xlabel("出生年份", fontsize=12)


plt.show()
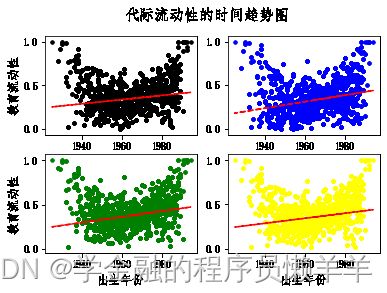
输出:
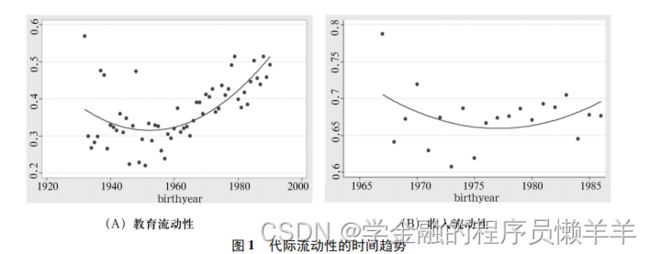
原论文:
2.3 基准回归及实现
模型定义(见论文第5页)
模型需要为出生年份和省份控制固定效应(不知道这个说法是否准确,按理说应该面板数据才好控制固定效应,但这是截面数据,貌似是控制组间固定效应),控制方法是为每一个出生年份档位和省份都生成一个虚拟变量,并加入回归方程中。
由于出生年份是每五年一个档位,原数据为具体每年的数据,因此构建一个新的变量存储样本的出生年份档位。
首先对出生年份数据进行描述性统计:
data['birthyear'].describe()结果:
count    32922.000000
mean      1962.923881
std         11.895852
min       1916.000000
25%       1955.000000
50%       1964.000000
75%       1971.000000
max       1999.000000
Name: birthyear, dtype: float64
最小1916年,最大1999年,因此共有17个分组 ,生成变量birthyear_groupby5过程如下:
a = list(range(1916,1999,5))
b = list(range(1921,2002,5))
birthyear_groupby5 = []
for year in data['birthyear']:
    for i in range(0,17):
        if(year>=a[i] & year
将模型中要用到的变量保存到data1中:
data1 = data[['coun','Educorr1','Eligibility','birthyear_groupby5','province']].dropna()定义my_OLS函数(基于statsmodels.api.OLS()):
*注意函数里面实现了虚拟变量的生成和截距项的生成(更多内容见【机器学习】 Statsmodels 统计包之 OLS 回归 - -零 - 博客园)
def my_OLS(data):
    data = data.dropna()
    nsample = len(data['coun'])
    x = data['Eligibility']
    dummy_birthyear_groupby5 = sm.categorical(data['birthyear_groupby5'].values,drop = True)
    dummy_province = sm.categorical(data['province'].values,drop = True)
    X = np.column_stack((x, dummy_birthyear_groupby5,dummy_province))
    X = sm.add_constant(X)
    #beta = np.ones( 2 + len(dummy_birthyear_groupby5[0]) + len(dummy_province[0]))
    e = np.random.normal(size=nsample)
    y = data['Educorr1']
    result = sm.OLS(y,X).fit()
    print(result.summary())
    return result
****关注点:summary()输出回归表非常方便****
回归:
OLS1 = my_OLS(data1)回归结果:
                           OLS Regression Results
==============================================================================
Dep. Variable:               Educorr1   R-squared:                       0.061
Model:                            OLS   Adj. R-squared:                  0.060
Method:                 Least Squares   F-statistic:                     70.28
Date:                Thu, 05 May 2022   Prob (F-statistic):               0.00
Time:                        15:38:21   Log-Likelihood:                 11034.
No. Observations:               32575   AIC:                        -2.201e+04
Df Residuals:                   32544   BIC:                        -2.175e+04
Df Model:                          30
Covariance Type:            nonrobust
==============================================================================
                 coef    std err          t      P>|t|      [0.025      0.975]
------------------------------------------------------------------------------
const          0.2818      0.001    297.766      0.000       0.280       0.284
x1             0.0989      0.003     31.634      0.000       0.093       0.105
x2             0.0130      0.004      3.412      0.001       0.006       0.021
x3             0.0181      0.004      4.738      0.000       0.011       0.026
x4             0.0231      0.004      6.042      0.000       0.016       0.031
x5             0.0178      0.004      4.658      0.000       0.010       0.025
x6             0.0143      0.004      3.753      0.000       0.007       0.022
x7             0.0180      0.004      4.699      0.000       0.010       0.025
x8             0.0189      0.004      4.945      0.000       0.011       0.026
x9             0.0193      0.004      5.056      0.000       0.012       0.027
x10            0.0128      0.004      3.351      0.001       0.005       0.020
x11            0.0102      0.004      2.668      0.008       0.003       0.018
x12            0.0171      0.004      4.477      0.000       0.010       0.025
x13            0.0154      0.004      4.033      0.000       0.008       0.023
x14            0.0133      0.004      3.482      0.000       0.006       0.021
x15            0.0203      0.004      5.318      0.000       0.013       0.028
x16            0.0158      0.004      4.128      0.000       0.008       0.023
x17            0.0143      0.004      3.734      0.000       0.007       0.022
x18            0.0199      0.004      5.194      0.000       0.012       0.027
x19            0.0165      0.004      4.477      0.000       0.009       0.024
x20            0.0072      0.003      2.053      0.040       0.000       0.014
x21            0.0270      0.004      7.287      0.000       0.020       0.034
x22            0.0178      0.003      5.577      0.000       0.012       0.024
x23            0.0134      0.004      3.766      0.000       0.006       0.020
x24           -0.0216      0.003     -6.896      0.000      -0.028      -0.015
x25            0.0106      0.003      3.421      0.001       0.005       0.017
x26           -0.0148      0.003     -4.281      0.000      -0.022      -0.008
x27           -0.0107      0.003     -3.129      0.002      -0.017      -0.004
x28            0.0200      0.003      6.269      0.000       0.014       0.026
x29            0.0855      0.004     21.846      0.000       0.078       0.093
x30           -0.0136      0.003     -4.036      0.000      -0.020      -0.007
x31            0.0515      0.004     13.913      0.000       0.044       0.059
x32            0.0931      0.004     24.275      0.000       0.086       0.101
==============================================================================
Omnibus:                     4647.437   Durbin-Watson:                   1.976
Prob(Omnibus):                  0.000   Jarque-Bera (JB):            19392.273
Skew:                          -0.658   Prob(JB):                         0.00
Kurtosis:                       6.544   Cond. No.                     2.77e+15
==============================================================================

Notes:
[1] Standard Errors assume that the covariance matrix of the errors is correctly specified.
[2] The smallest eigenvalue is 4.92e-27. This might indicate that there are
strong multicollinearity problems or that the design matrix is singular.
更多statsmodels内容等待以后探索
参考文献
[1]陈斌开,张淑娟,申广军.义务教育能提高代际流动性吗?[J].金融研究,2021(06):76-94.


