前言
风玫瑰是由气象学家用于给出如何风速和风向在特定位置通常分布的简明视图的图形工具。它也可以用来描述空气质量污染源。风玫瑰工具使用Matplotlib作为后端。
安装方式直接使用:
pip install windrose
导入模块
import pandas as pd
import numpy as np
from matplotlib import pyplot as plt
import matplotlib.cm as cm
from math import pi
import windrose
from windrose import WindroseAxes, WindAxes, plot_windrose
from mpl_toolkits.axes_grid1.inset_locator import inset_axes
import cartopy.crs as ccrs
import cartopy.io.img_tiles as cimgt
读取数据
df = pd.read_csv("./sample_wind_poitiers.csv", parse_dates=['Timestamp'])
df = df.set_index('Timestamp')
计算风速的u、v分量
df['speed_x'] = df['speed'] * np.sin(df['direction'] * pi / 180.0)
df['speed_y'] = df['speed'] * np.cos(df['direction'] * pi / 180.0)
uv风速散点图(含透明度)
fig, ax = plt.subplots(figsize=(8, 8), dpi=80)
x0, x1 = ax.get_xlim()
y0, y1 = ax.get_ylim()
ax.set_aspect(abs(x1-x0)/abs(y1-y0))
ax.set_aspect('equal')
ax.scatter(df['speed_x'], df['speed_y'], alpha=0.25)
df.plot(kind='scatter', x='speed_x', y='speed_y', alpha=0.05, ax=ax)
Vw = 80
ax.set_xlim([-Vw, Vw])
ax.set_ylim([-Vw, Vw])
风玫瑰图(多种形式)
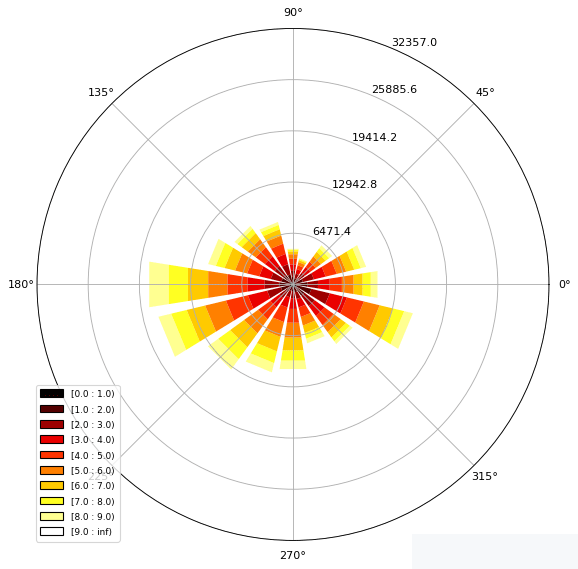
ax = WindroseAxes.from_ax()
ax.bar(df.direction.values, df.speed.values, bins=np.arange(0.01,10,1), cmap=cm.hot, lw=3)
ax.set_legend()
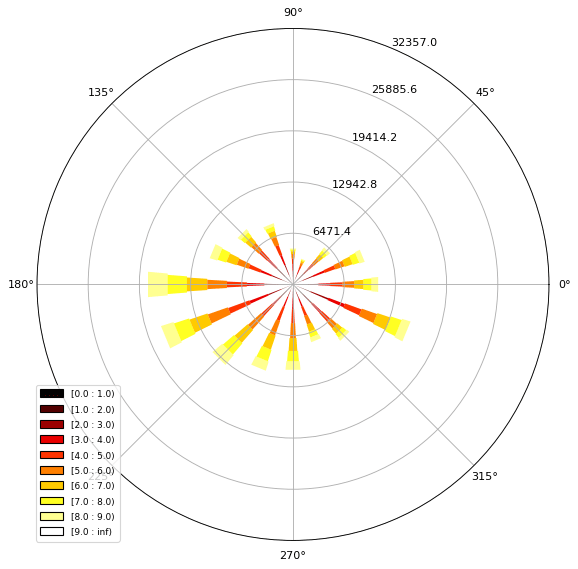
ax = WindroseAxes.from_ax()
ax.box(df.direction.values, df.speed.values, bins=np.arange(0.01,10,1), cmap=cm.hot, lw=3)
ax.set_legend()
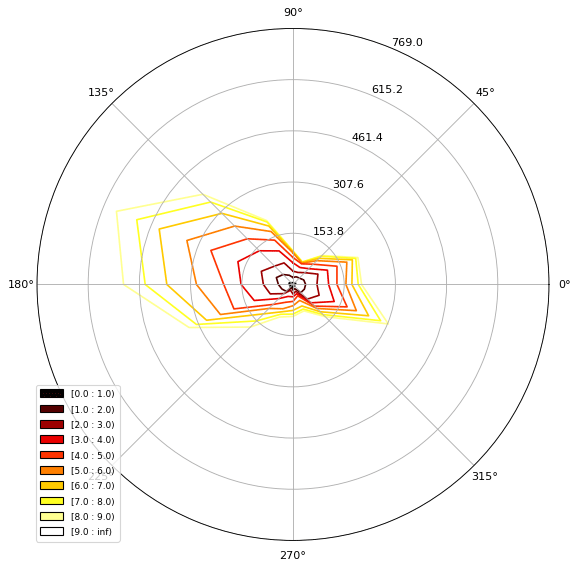
plot_windrose(df, kind='contour', bins=np.arange(0.01,8,1), cmap=cm.hot, lw=3)
绘制特定月份风玫瑰图
def plot_month(df, t_year_month, *args, **kwargs):
    by = 'year_month'
    df[by] = df.index.map(lambda dt: (dt.year, dt.month))
    df_month = df[df[by] == t_year_month]
    ax = plot_windrose(df_month, *args, **kwargs)
    return ax
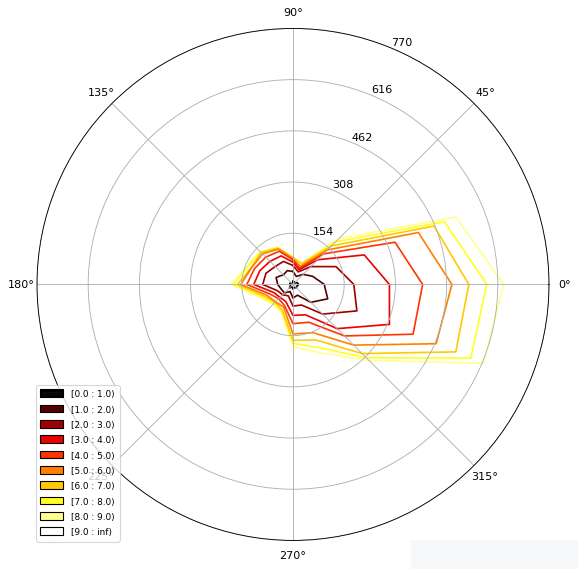
plot_month(df, (2014, 7), kind='contour', bins=np.arange(0, 10, 1), cmap=cm.hot)
plot_month(df, (2014, 8), kind='contour', bins=np.arange(0, 10, 1), cmap=cm.hot)
plot_month(df, (2014, 9), kind='contour', bins=np.arange(0, 10, 1), cmap=cm.hot)
绘制风速频率直方图
bins = np.arange(0,30+1,1)
bins = bins[1:]
plot_windrose(df, kind='pdf', bins=np.arange(0.01,30,1),normed=True)
在地图上绘制风玫瑰图
proj = ccrs.PlateCarree()
fig = plt.figure(figsize=(12, 6))
minlon, maxlon, minlat, maxlat = (6.5, 7.0, 45.85, 46.05)
main_ax = fig.add_subplot(1, 1, 1, projection=proj)
main_ax.set_extent([minlon, maxlon, minlat, maxlat], crs=proj)
main_ax.gridlines(draw_labels=True)
main_ax.add_wms(wms='http://vmap0.tiles.osgeo.org/wms/vmap0',layers=['basic'])
cham_lon, cham_lat = (6.8599, 45.9259)
passy_lon, passy_lat = (6.7, 45.9159)
wrax_cham = inset_axes(main_ax,
        width=1,
        height=1,
        loc='center',
        bbox_to_anchor=(cham_lon, cham_lat),
        bbox_transform=main_ax.transData,
        axes_class=windrose.WindroseAxes,

height_deg = 0.1
wrax_passy = inset_axes(main_ax,
        width="100%",
        height="100%",
        bbox_to_anchor=(passy_lon-height_deg/2, passy_lat-height_deg/2, height_deg, height_deg),
        bbox_transform=main_ax.transData,
        axes_class=windrose.WindroseAxes,
        )
wrax_cham.bar(df.direction.values, df.speed.values,bins=np.arange(0.01,10,1), lw=3)
wrax_passy.bar(df.direction.values, df.speed.values,bins=np.arange(0.01,10,1), lw=3)

for ax in [wrax_cham, wrax_passy]:
        ax.tick_params(labelleft=False, labelbottom=False)
最后:
这样绘制出来的风玫瑰看起来还是很漂亮的,并且也能够大大提高工作效率,对于那些科研人员是很有帮助的。代码以及图片效果就放在上面了。


