pyecharts 结合 Pandas (mtcars)
pyecharts 结合 Pandas
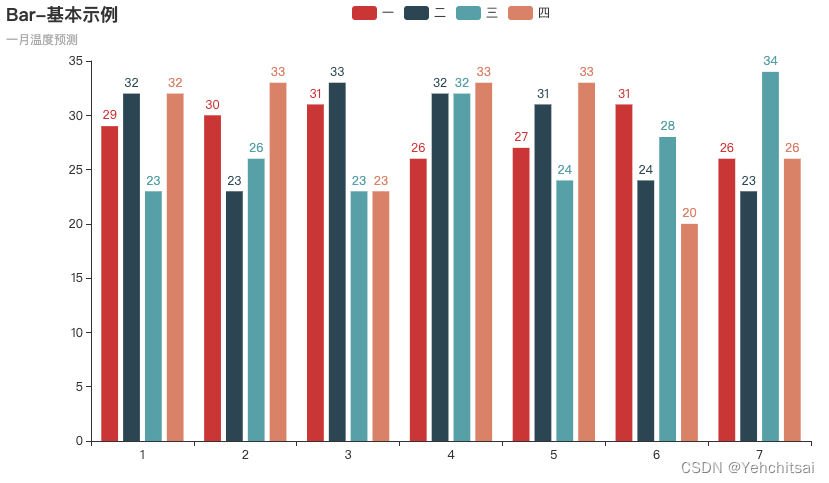
本例用来展示 Pandas 读取四周的温度信息,使用随机生成的数据源,开发者使用 pyecharts 的 Bar 模块,画出四周的温度预测柱状图。
使用随机数据
from pyecharts import options as opts
from pyecharts.charts import Bar
import numpy as np
import pandas as pd

# 产生随机四周的气温预测
df = pd.DataFrame(np.random.randint(20, high = 35, size=(7,4)),columns=list('一二三四'),index=list('1234567'))

c = Bar()
c.add_xaxis(df.index.tolist())
for i, col in enumerate(df.keys()):
    c.add_yaxis(col, df.iloc[:,i].tolist())
c.set_global_opts(title_opts=opts.TitleOpts(title="Bar-基本示例", subtitle="一月温度预测"))
c.render_notebook()
使用 mtcars 数据集
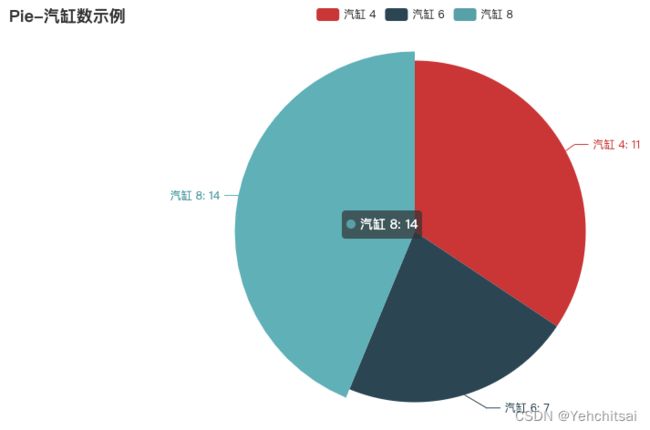
本例用来展示 Pandas 读取网络上的 mtcars 汽车信息,开发者使用 pyecharts 的 Pie 模块,画出依据汽缸数目来统计车辆数目的饼图。
mtcars 数据集说明
| 栏位 | 说明 |
|---|---|
| mpg | 每加仑开几英里 |
| cyl | 汽缸数目 |
| disp | 排气量 (以立方英吋为单位) |
| hp | 总马力 |
| drat | 后轴比 |
| wt | 重量 (1000 lbs) |
| qsec | 乘以 1/4 英里或 400 米 |
| vs | 引擎类型 (0 = V-shaped, 1 = straight) |
| am | 变速器 (0 = automatic, 1 = manual) |
| gear | 前进齿轮数 |
| carb | 化油器的数量 |
| cars | 汽车型号 |
| carname | 汽车型号 |
from pyecharts import options as opts
from pyecharts.charts import Pie
import pandas as pd

# 读取汽车信息
df_raw = pd.read_csv("https://github.com/selva86/datasets/raw/master/mtcars.csv")
# Prepare Data
df = df_raw.groupby('cyl').size().reset_index(name='counts')

labels = []
for cyl in df.iloc[:,0]:
    labels.append("%s %d" % ('汽缸',cyl))

pie = Pie()
pie.add("", [list(z) for z in zip(labels, list(df.iloc[:,1]))])
pie.set_global_opts(title_opts=opts.TitleOpts(title="Pie-汽缸数示例"))
pie.set_series_opts(label_opts=opts.LabelOpts(formatter="{b}: {c}"))
pie.render_notebook()
参考来源
- pyechart 简介, https://pyecharts.org/#/zh-cn/intro
- Apache ECharts 一个基于 JavaScript 的开源可视化图表库, https://echarts.apache.org/zh/index.html

