【唐宇迪】opencv实战学习
图像基本操作
数据读取-图像
- cv2.IMREAD_COLOR:彩色图像
- cv2.IMREAD_GRAYSCALE:灰度图像
opencv对于读进来的图片的通道排列是BGR,而不是主流的RGB!谨记!
#opencv读入的矩阵是BGR,如果想转为RGB,可以这么转
img = cv2.imread('1.jpg')
img = cv2.cvtColor(img4,cv2.COLOR_BGR2RGB)
import cv2
import matplotlib.pyplot as plt
import numpy as np
%matplotlib inline
# 由于 %matplotlib inline 的存在,当输入plt.plot(x,y_1)后,不必再输入 plt.show(),图像将自动显示出来

img = cv2.imread('pic/cat.jpg')
img # 值都是在0~255之间,0是白色,255是黑色。共有3个维度,[h, w, c]
array([[[161, 166, 169],
        [110, 115, 118],
        [110, 115, 118],
        ...,
        [ 93, 103, 113],
        [101, 111, 121],
        [106, 116, 126]],

       [[162, 167, 170],
        [130, 135, 138],
        [114, 119, 122],
        ...,
        [ 92, 102, 112],
        [ 98, 108, 118],
        [103, 113, 123]],

       [[165, 170, 173],
        [158, 163, 166],
        [138, 143, 146],
        ...,
        [ 95, 105, 115],
        [ 98, 108, 118],
        [102, 112, 122]],

       ...,

       [[200, 209, 218],
        [178, 187, 196],
        [147, 156, 165],
        ...,
        [178, 187, 200],
        [151, 160, 173],
        [104, 113, 126]],

       [[234, 243, 252],
        [197, 206, 215],
        [151, 160, 169],
        ...,
        [167, 176, 189],
        [182, 193, 207],
        [159, 170, 184]],

       [[151, 160, 169],
        [130, 139, 148],
        [111, 120, 129],
        ...,
        [133, 142, 155],
        [184, 195, 209],
        [184, 195, 209]]], dtype=uint8)
# 图像的显示,也可以创建多个窗口
cv2.imshow('img', img)
# 等待时间,毫秒级,0表示任意键终止
cv2.waitKey(0)
cv2.destroyAllWindows()
def cv_show(name, img): # 定义一个函数,使得可以显示图片并且任意键关闭
    cv2.imshow(name, img)
    cv2.waitKey(0)
    cv2.destroyAllWindows()
cv_show('img',img)
img.shape # 查看图像的大小,3表示是RGB这3个颜色通道
(720, 720, 3)
# 以灰度图读取进来
gray_img = cv2.imread('pic/cat2.jpg', cv2.IMREAD_GRAYSCALE)
gray_img
array([[ 62, 125, 105, ..., 242, 168, 173],
       [192, 128,  83, ..., 234, 214, 171],
       [ 88, 124, 127, ..., 228, 211, 170],
       ...,
       [126, 145, 118, ...,  96,  95, 122],
       [133, 160, 152, ...,  94,  98, 154],
       [157, 173, 170, ..., 120, 119, 135]], dtype=uint8)
cv_show('gray_img', gray_img)
gray_img.shape # 只有两个维度,只有1个颜色通道
(720, 720)
cv2.imwrite('pic/gray_cat.jpg', gray_img) # 保存图片
True
type(gray_img) # 是numpy中ndarray类型
numpy.ndarray
gray_img.size # 像素点个数=720*720*1
518400
gray_img.dtype # 元素数据类型
dtype('uint8')
# 批量读取并保存

import os

def convert(input_dir, output_dir):
    for filename in os.listdir(input_dir):
        path = input_dir + "/" + filename # 获取文件路径
        print("doing... ", path)

        file_name, file_extension = os.path.splitext(filename)
        img = cv2.imread(path)
        img = cv2.resize(img, (0,0), fx=0.8, fy=0.8)

        cv2.imwrite(output_dir+file_name+'_small'+file_extension, img )
        print('saving',output_dir+file_name+'_small'+file_extension)

input_dir = "pic/resize"    # 输入数据文件夹
output_dir = "pic/" # 输出数据文件夹
convert(input_dir, output_dir)
doing...  pic/resize/cat2_small.jpg
saving pic/cat2_small_small.jpg
doing...  pic/resize/cat3_small.jpg
saving pic/cat3_small_small.jpg
doing...  pic/resize/cat_small.jpg
saving pic/cat_small_small.jpg
doing...  pic/resize/dog2_small.jpg
saving pic/dog2_small_small.jpg
doing...  pic/resize/dog3_small.jpg
saving pic/dog3_small_small.jpg
doing...  pic/resize/dog_small.jpg
saving pic/dog_small_small.jpg
doing...  pic/resize/Lenna_small.png
saving pic/Lenna_small_small.png
数据读取-视频
- cv2.VideoCapture可以捕获摄像头有,用数字来控制不同的设备,例如0,1
- 如果是视频文件,直接指定好路径即可。
基本上1s内30帧,人眼就看不出来卡顿了。
人脸识别不是对于视频去做的,也是对于图像去做的。
read函数返回2个类型,第一个是bool类型,第二个是图像,第一个open随便改名都可以
vc = cv2.VideoCapture(r'D:\SoftWareInstallMenu\EVCapture\A_EVsavefile\Latex使用方法.mp4')

# 检查是否打开正确
if vc.isOpened():
    open, frame = vc.read() # open表示是否正确打开,frame是第一帧的图像
else:
    open = False
while open:
    ret, frame = vc.read()
    if frame is None:
        break
    if ret == True:
        gray = cv2.cvtColor(frame, cv2.COLOR_BGR2GRAY)  # 转成一个灰度图
        cv2.imshow('result', gray)
        if cv2.waitKey(10) & 0xFF == 27: # 10表示切换到下一帧的时间,27表示退出键
            break
vc.release()
cv2.destroyAllWindows()
截取部分图像数据
ROI:感兴趣的区域
切分:b, g, r = img.split(img)
组合:img = cv2.merge((b, g, r))
只保留一种颜色通道
img = cv2.imread('pic/cat.jpg') # 原图的shape是(720, 720, 3)
cat = img[200:400, 200:400]
cv_show('cat',cat)
颜色通道提取
b, g, r = cv2.split(img) # 把3个颜色通道单独切分出来
b
array([[161, 110, 110, ...,  93, 101, 106],
       [162, 130, 114, ...,  92,  98, 103],
       [165, 158, 138, ...,  95,  98, 102],
       ...,
       [200, 178, 147, ..., 178, 151, 104],
       [234, 197, 151, ..., 167, 182, 159],
       [151, 130, 111, ..., 133, 184, 184]], dtype=uint8)
# 或者写成这样,效果也是一样的
b = img[:, :, 0]
b
array([[161, 110, 110, ...,  93, 101, 106],
       [162, 130, 114, ...,  92,  98, 103],
       [165, 158, 138, ...,  95,  98, 102],
       ...,
       [200, 178, 147, ..., 178, 151, 104],
       [234, 197, 151, ..., 167, 182, 159],
       [151, 130, 111, ..., 133, 184, 184]], dtype=uint8)
b.shape # b, g, r 的shape都是一样的,跟图像大小,切分出来不会发生改变
(720, 720)
img2 = cv2.merge((b, g, r))
cv_show('img2',img2)
# 只保留B通道颜色,其余通道颜色置为0
cur_img = img.copy()
cur_img[:, :, 1] = 0
cur_img[:, :, 2] = 0
cv_show('cur_img.png', cur_img)
边界填充
import matplotlib.pyplot as plt
img = cv2.imread('pic/cat.jpg')
img = cv2.cvtColor(img,cv2.COLOR_BGR2RGB) # 因为cv2读取的图片是BGR的,所以这里转成RGB才为真实颜色
plt.imshow(img)
[外链图片转存失败,源站可能有防盗链机制,建议将图片保存下来直接上传(img-KXF63my6-1647232784475)(output_31_1.png)]
top_size, bottom_size, left_size, right_size = (50, 50, 50, 50)
replicate = cv2.copyMakeBorder(img, top_size, bottom_size, left_size, right_size, borderType = cv2.BORDER_REPLICATE)
reflect = cv2.copyMakeBorder(img, top_size, bottom_size, left_size, right_size, cv2.BORDER_REFLECT)
reflect101 = cv2.copyMakeBorder(img, top_size, bottom_size, left_size, right_size, cv2.BORDER_REFLECT_101)
wrap = cv2.copyMakeBorder(img, top_size, bottom_size, left_size, right_size, cv2.BORDER_WRAP)
constant = cv2.copyMakeBorder(img, top_size, bottom_size, left_size, right_size, cv2.BORDER_CONSTANT, value=0) #常量设为0,边界全为黑色
import matplotlib.pyplot as plt
plt.subplot(2,3,1), plt.imshow(img), plt.title('ORIGINAL')
plt.subplot(232), plt.imshow(replicate), plt.title('REPLICATE')
plt.subplot(233), plt.imshow(reflect), plt.title('REFLECT')
plt.subplot(234), plt.imshow(reflect101), plt.title('REFLECT_101')
plt.subplot(235), plt.imshow(wrap), plt.title('WRAP')
plt.subplot(236), plt.imshow(constant), plt.title('CONSTANT')
(,
 ,
 Text(0.5, 1.0, 'CONSTANT'))
[外链图片转存失败,源站可能有防盗链机制,建议将图片保存下来直接上传(img-RZhSMq58-1647232784476)(output_33_1.png)]
- BORDER_REFLICATE:复制法,也就是赋值最边缘像素
- BORDER_REFLECT:反射法,对感兴趣的图像中的像素在两边进行复制,例如fedcba|abcdefgh|hgfedcb
- BORDER_REFLECT_101:反射法,也就是以最边缘像素为轴,对称,gfedcb|abcdefgh|gfedcba
- BORDER_WRAP:外包装法cdefgh|abcdefgh|abcdefg
- BORDER_CONSTANT:常量法,常数值填充。
数值计算
- cv2中的add加法,当越界0~255时,就取最大值255
img_cat = cv2.imread('pic/cat.jpg')
img_dog = cv2.imread('pic/dog3.jpg')

img_cat[:5, :, 0] # 只打印前5行,B通道的数据进行查看
array([[161, 110, 110, ...,  93, 101, 106],
       [162, 130, 114, ...,  92,  98, 103],
       [165, 158, 138, ...,  95,  98, 102],
       [154, 156, 144, ...,  96,  98, 101],
       [119, 134, 136, ...,  94,  99, 103]], dtype=uint8)
img_cat2 = img_cat + 10 # 所有位置的元素值都+10,但是shape没有发生变化
img_cat2[:5, :, 0]
array([[171, 120, 120, ..., 103, 111, 116],
       [172, 140, 124, ..., 102, 108, 113],
       [175, 168, 148, ..., 105, 108, 112],
       [164, 166, 154, ..., 106, 108, 111],
       [129, 144, 146, ..., 104, 109, 113]], dtype=uint8)
cv_show('img_cat2',img_cat2)
# 相当于%256,numpy的加法
(img_cat + img_cat2)[:5, :, 0]
array([[ 76, 230, 230, ..., 196, 212, 222],
       [ 78,  14, 238, ..., 194, 206, 216],
       [ 84,  70,  30, ..., 200, 206, 214],
       [ 62,  66,  42, ..., 202, 206, 212],
       [248,  22,  26, ..., 198, 208, 216]], dtype=uint8)
# cv2中的add加法,当越界0~255时,就取最大值255
cv2.add(img_cat, img_cat2)[:5, : ,0]
array([[255, 230, 230, ..., 196, 212, 222],
       [255, 255, 238, ..., 194, 206, 216],
       [255, 255, 255, ..., 200, 206, 214],
       [255, 255, 255, ..., 202, 206, 212],
       [248, 255, 255, ..., 198, 208, 216]], dtype=uint8)
一些不严谨的理解
- 当有的参数写成
-1时,就默认是保留所有信息。 - 颜色值区间是0-255,也就是黑-白,中间值127就代表是灰色。
- cv2.imread(filepath,flags),参考博客:cv2 imread()函数。flags=0表示读入灰度图像,等价于cv2.IMREAD_GRAYSCALE;默认flags=1,表示读入彩色图像,等价于cv2.IMREAD_COLOR;flags=-1,读入包括alpha通道(又称A通道)的完整图片,等价于cv2.IMREAD_UNCHANGED。
- 好像只要是坐标,都是先表示的列号,再表示的行。
图像处理
图像融合
- shape值必须相同,不同的话,就需要进行resize,resize中有点奇怪,高宽的位置是变换的
- cv2.AddWeighted(src1,a,src2,b,c) 表示“结果图像=图像1×系数1+图像2×系数2+亮度调节量”,c一定要写,至少写成0
img_cat + img_dog
---------------------------------------------------------------------------

ValueError                                Traceback (most recent call last)

~\AppData\Local\Temp/ipykernel_18220/4029550109.py in
----> 1 img_cat + img_dog


ValueError: operands could not be broadcast together with shapes (720,720,3) (638,563,3)
img_cat = cv2.resize(img_cat, (563,638))
img_cat.shape
plt.imshow((img_cat + img_dog))
res = cv2.addWeighted(img_cat, 0.4, img_dog, 0.6, 0) # 最后面那个0是指偏置,再另外加的值,应该是有一种调亮的效果
plt.imshow(res)
res = cv2.resize(img_cat, (0, 0), fx=3, fy=3) # resize时,没有指定具体大小,而是指定变长变宽的倍数
plt.imshow(res)
图像阈值
ret, dst = cv2.threshold(src, thresh, maxval, type)
ret:输入的阈值thresh,通常没用,可以用_代替;dst:二值化后的图像。
等价于:_ , dst = cv2.threshold (源图片, 阈值, 填充色, 阈值类型)
- src:输入图,只能输入单通道图像,通常来说为灰度图
- dst:输出图
- thresh:阈值,通常为127
- maxval:当像素值超过了阈值(或者小于阈值,根据type来决定),所赋予的值
- type:二值化操作的类型,包含以下5种类型:
- cv2.THRESH_BINARY 超过阈值部分取maxval(最大值),否则取0
- cv2.THRESH_BINARY_INV 是THRESH_BINARY的反转
- cv2.THRESH_TRUNC 大于阈值部分设为阈值,否则不变
- cv2.THRESH_TOZERO 大于阈值部分不改变,否则设为0
- cv2.THRESH_TOZERO_INV 是THRESH_TOZERO的反转
可以再看一下这个链接:图像阈值处理cv2.threshold()函数(python)
cv2.THRESH_BINARY将一个灰色的图片,变成要么是白色要么就是黑色。(大于规定thresh值就是设置的最大值(常为255,也就是白色))
还有这个链接也不错:opencv: 阈值处理(cv2.threshold) 探究(图示+源码)
img_gray = cv2.imread('pic/cat.jpg', cv2.IMREAD_GRAYSCALE) # 以灰度图读进来
ret, thresh1 = cv2.threshold(img_gray, 127, 255, cv2.THRESH_BINARY)
ret, thresh2 = cv2.threshold(img_gray, 127, 255, cv2.THRESH_BINARY_INV)
ret, thresh3 = cv2.threshold(img_gray, 127, 255, cv2.THRESH_TRUNC)
ret, thresh4 = cv2.threshold(img_gray, 127, 255, cv2.THRESH_TOZERO)
ret, thresh5 = cv2.threshold(img_gray, 127, 255, cv2.THRESH_TOZERO_INV)
cmap的知识可以参考一下这个博客:Matplotlib的imshow()函数颜色映射(cmap的取值)
常用的应该就是’gray’吧
这是官网地址:Choosing Colormaps in Matplotlib
import matplotlib.pyplot as plt
titles = ['Original Image', 'Binary', 'Binary_inv', 'Trunc', 'Tozero', 'Tozero_inv']
images = [img_gray, thresh1, thresh2, thresh3, thresh4, thresh5]

for i in range(6):
    plt.subplot(2,3,i+1)
    plt.imshow(images[i], cmap = 'gray') # cmap加上这个'gray'参数,是为了显示灰色图,cmap是颜色散射值
    plt.title(titles[i])
    plt.xticks([]) # 数组类型,用于设置X轴刻度间隔.这里设置为空,则表示不显示刻度
    plt.yticks([])
plt.show()
图像平滑处理
没有找到噪声图片,就只有手动做添加照片了
- 经典的lena照片下载地址:wiki-Lenna-512×512.png
- csdn上添加椒盐噪声、高斯噪声、随机噪声的教程:Python+OpenCV批量给图片加噪声
random.randint(0,3) 表示返回0~3之间的任意整数,左闭右闭
np.arange(0,3) 表示生成[ 0 1 2 ]数组,左闭右开
range(0,3) 表示范围0~2之间的数据
添加噪声
# 导入头文件
import os
import cv2
import numpy as np
import random
# 添加椒盐噪声
def sp_noise(noise_img, proportion):
    '''
    添加椒盐噪声
    proportion的值表示加入噪声的量,可根据需要自行调整
    return: img_noise
    '''
    height, width = noise_img.shape[0], noise_img.shape[1]#获取高度宽度像素值
    num = int(height * width * proportion) #一个准备加入多少噪声小点
    for i in range(num):
        w = random.randint(0, width - 1) # 任意地方添加的0黑点,255白点
        h = random.randint(0, height - 1)
        if random.randint(0, 1) == 0:
            noise_img[h, w] = 0
        else:
            noise_img[h, w] = 255
    return noise_img
# 添加高斯噪声
def gaussian_noise(img, mean, sigma):
    '''
    此函数用将产生的高斯噪声加到图片上
    传入:
        img   :  原图
        mean  :  均值
        sigma :  标准差
    返回:
        gaussian_out : 噪声处理后的图片
    '''
    # 将图片灰度标准化
    img = img / 255
    # 产生高斯 noise
    noise = np.random.normal(mean, sigma, img.shape)
    # 将噪声和图片叠加
    gaussian_out = img + noise
    # 将超过 1 的置 1,低于 0 的置 0
    gaussian_out = np.clip(gaussian_out, 0, 1)
    # 将图片灰度范围的恢复为 0-255
    gaussian_out = np.uint8(gaussian_out*255)
    # 将噪声范围搞为 0-255
    # noise = np.uint8(noise*255)
    return gaussian_out# 这里也会返回噪声,注意返回值
# 添加随机噪声
def random_noise(image,noise_num):
    '''
    添加随机噪点(实际上就是随机在图像上将像素点的灰度值变为255即白色)
    param image: 需要加噪的图片
    param noise_num: 添加的噪音点数目
    return: img_noise
    '''
    # 参数image:,noise_num:
    img_noise = image
    # cv2.imshow("src", img)
    rows, cols, chn = img_noise.shape
    # 加噪声
    for i in range(noise_num):
        x = np.random.randint(0, rows)#随机生成指定范围的整数
        y = np.random.randint(0, cols)
        img_noise[x, y, :] = 255
    return img_noise
# 读取并保存
def convert(input_dir, output_dir):
    for filename in os.listdir(input_dir):
        path = input_dir + "/" + filename # 获取文件路径
        print("doing... ", path)
        noise_img = cv2.imread(path)#读取图片

        img_noise = gaussian_noise(noise_img, 0, 0.12) # 高斯噪声
        cv2.imwrite(output_dir+'/gaussian_'+filename,img_noise )

        img_noise = sp_noise(noise_img, 0.025)# 椒盐噪声
        cv2.imwrite(output_dir+'/sp_'+filename,img_noise )

        img_noise  = random_noise(img_noise, 500)# 随机噪声
        cv2.imwrite(output_dir+'/random_'+filename,img_noise )
input_dir = "pic/input"    # 输入数据文件夹
output_dir = "pic/picout" # 输出数据文件夹
convert(input_dir, output_dir)
平滑处理
卷积核会与图像中相应大小的像素点依次做内积。例如3×3的卷积核,则会与图像中3×3个像素点依次做内积操作,然后再做求均值、中位数等操作。
通常情况下,卷积核的大小是一个奇数,例如3,5等。
- 均值滤波,简单的平均卷积操作
- 方框滤波,基本和均值一样,可以选择归一化,当归一化为true时,则效果与blur相同
import cv2
import numpy as np
import matplotlib.pyplot as plt

img = cv2.imread('pic/picout/sp_Lenna.png')
# img = cv2.cvtColor(img, cv2.COLOR_BGR2RGB) # 将BGR图像转为RGB图像

def cv_show(name, img):
    cv2.imshow(name, img)
    cv2.waitKey(0)
    cv2.destroyAllWindows()

cv_show('img',img)
# 均值滤波
# 简单的平均卷积操作
blur = cv2.blur(img, (3,3)) # 采用3×3的卷积核
cv_show('blur', blur)

# 就是大小为3*3且元素全为1的矩阵与图像的9个像素点做内积,相当于就是把选中的9个值加起来,再÷9,求得均值
# 方框滤波
# 基本和均值一样,可以选择归一化,当归一化为true时,则效果与blur相同;当为False时,就少了÷9的步骤,所以值就会越界(0~255)
# 越界值就直接取最大值255,所以会有很多地方为白色(255)
box = cv2.boxFilter(img, -1, (3,3), normalize=False) # -1表示颜色通道数与图像一致,通常情况下不要更改
cv_show('box', box)
# 高斯滤波(好像是有点类似于0-1正态分布)
# 高斯模糊的卷积核里的数值是满足高斯分布,相当于更重视中间的,离自己越近的影响越大,相当于给自己构造了一个权重矩阵
# (5,5)为滤波器的大小;1为滤波器的标准差,如果标准差这个参数设置为0,则程序会根据滤波器大小自动计算得到标准差。
# 高斯滤波器模板的生成最重要的参数就是高斯分布的标准差σ
# σ较大,则生成的模板的各个系数相差就不是很大,比较类似均值模板,对图像的平滑效果比较明显
gaussian = cv2.GaussianBlur(img, (3,3), 1)
cv_show('gaussian', gaussian)
# 中值滤波
# 相当于用中值替代
median = cv2.medianBlur(img, 5)
cv_show('median', median)
# 展示所有的
res = np.hstack((img, blur, gaussian, median))
res = cv2.resize(res, (0,0), fx=0.5, fy=0.5)
cv_show('all pics', res)
形态学
腐蚀操作
拿erosion.png举例,背景都是黑色,爱心是白色的,且毛刺也是白色的。
腐蚀 cv2.erode():当卷积核圈住的范围内有黑色,就将该范围内的全变为黑色,所以会缩小一圈。(有不想要的像素就全不要)
膨胀 cv2.dilate():相反,只要卷积核圈住的范围内有白色,就将该范围内全置为白色,所以会变大一圈。(有想要的像素就全要)
去掉毛刺,往里面缩小,腐蚀次数越多,图像变得越小。跟滤波很像。
kernel的设置还是挺重要的,设置得太大的化,形态会发生改变。
img = cv2.imread('pic/erosion.png') # 大爱心

kernel = np.ones((3,3), np.uint8)

erosion1 = cv2.erode(img, kernel, iterations = 1) # iterations腐蚀次数
erosion2 = cv2.erode(img, kernel, iterations = 2) # iterations腐蚀次数
erosion3 = cv2.erode(img, kernel, iterations = 3) # iterations腐蚀次数

res = np.hstack((img, erosion1, erosion2, erosion3))
res = cv2.resize(res, (0,0), fx=0.6, fy= 0.6)
cv_show('res', res)
img = cv2.imread('pic/erosion2.png') # 线条字母

kernel = np.ones((3,3), np.uint8)

erosion1 = cv2.erode(img, kernel, iterations = 1) # iterations腐蚀次数
erosion2 = cv2.erode(img, kernel, iterations = 2) # iterations腐蚀次数
erosion3 = cv2.erode(img, kernel, iterations = 3) # iterations腐蚀次数

res = np.hstack((img, erosion1, erosion2, erosion3))
res = cv2.resize(res, (0,0), fx=0.6, fy= 0.6)
cv_show('res', res)
膨胀操作
图像会变得越来越大
当图像中是一些线条数据时,为了消去不必要的毛刺,先进行腐蚀操作消去毛刺,但是数据会受到一些损害变得很细。所以还需要再进行膨胀操作。
img = cv2.imread('pic/erosion2.png') # 线条字母

kernel = np.ones((3,3), np.uint8)

# 腐蚀+膨胀
erosion1 = cv2.erode(img, kernel, iterations = 1)
dilate1 = cv2.dilate(erosion1, kernel, iterations = 1)

erosion2 = cv2.erode(img, kernel, iterations = 2)
dilate2 = cv2.dilate(erosion2, kernel, iterations = 2)

erosion3 = cv2.erode(img, kernel, iterations = 1)
dilate3 = cv2.dilate(erosion3, kernel, iterations = 3)

res = np.hstack((img, dilate1, dilate2, dilate3))
res = cv2.resize(res, (0,0), fx=0.6, fy= 0.6)
cv_show('res', res)
开运算和闭运算
其实就是将上面的腐蚀和膨胀结合在一起了
cv2.morphologyEx(img, cv2.MORPH_OPEN, kernel) # 开运算,先腐蚀再膨胀
cv2.morphologyEx(img, cv2.MORPH_CLOSE, kernel) # 闭运算,先膨胀再腐蚀
# 开运算
img = cv2.imread('pic/erosion2.png')
kernel = np.ones((5,5), dtype = np.uint8)

opening = cv2.morphologyEx(img, cv2.MORPH_OPEN, kernel)

cv_show('opening', cv2.resize(opening, (0,0), fx=0.6, fy=0.6))
# 闭运算
img = cv2.imread('pic/erosion2.png')
kernel = np.ones((5,5), dtype = np.uint8)

closing = cv2.morphologyEx(img, cv2.MORPH_CLOSE, kernel)

cv_show('closing', cv2.resize(closing, (0,0), fx=0.6, fy=0.6))
梯度运算
梯度=膨胀-腐蚀
cv2.morphologyEx(img, cv2.MORPH_GRADIENT, kernel)
# 梯度=膨胀-腐蚀
img = cv2.imread('pic/erosion.png')
kernel = np.ones((5,5), dtype = np.uint8)

dilate = cv2.dilate(img, kernel, iterations = 5) # 膨胀
erosion = cv2.erode(img, kernel, iterations = 5) # 腐蚀
gradient = cv2.morphologyEx(img, cv2.MORPH_GRADIENT, kernel) # 梯度运算

res = np.hstack((img, dilate, erosion, gradient))
cv_show('res', cv2.resize(res,(0,0),fx=0.6,fy=0.6))
礼帽与黑帽
- 礼帽 = 原始输入 - 开运算结果 ,也就是只剩下那些毛刺了。cv2.morphologyEx(img, cv2.MORPH_TOPHAT, kernel)
- 黑帽 = 闭运算 - 原始输入,剩下毛刺的轮廓(感觉是出现毛刺的位置点)。cv2.morphologyEx(img, cv2.MORPH_BLACKHAT, kernel)
# 礼帽
img = cv2.imread('pic/erosion2.png')
kernel = np.ones((5,5), dtype=np.uint8)

tophat = cv2.morphologyEx(img, cv2.MORPH_TOPHAT, kernel)
cv_show('tophat', tophat)
# 黑帽
blackhat = cv2.morphologyEx(img, cv2.MORPH_BLACKHAT, kernel)
cv_show('blackhat', blackhat)
# 原图、礼帽、黑帽
res = np.hstack((img, tophat, blackhat))
cv_show('res', cv2.resize(res, (0,0), fx=0.6, fy=0.6))
图像梯度
Sobel算子
G x = [ − 1 0 + 1 − 2 0 + 2 − 1 0 + 1 ] ∗ A and G y = [ − 1 − 2 − 1 0 0 0 + 1 + 2 + 1 ] ∗ A \mathbf{G}_{x}=\left[\begin{array}{ccc} -1 & 0 & +1 \\ -2 & 0 & +2 \\ -1 & 0 & +1 \end{array}\right] * \mathbf{A} \quad \text { and } \quad \mathbf{G}_{y}=\left[\begin{array}{ccc} -1 & -2 & -1 \\ 0 & 0 & 0 \\ +1 & +2 & +1 \end{array}\right] * \mathbf{A} Gx=⎣⎡−1−2−1000+1+2+1⎦⎤∗A and Gy=⎣⎡−10+1−20+2−10+1⎦⎤∗A
- 感觉梯度就是边缘的意思,通常是用来进行边缘检测的
- G x G_x Gx表示计算水平方向的像素差值,右 - 左
- G y G_y Gy表示计算竖直方向的像素差值,下 - 上
- 用 cv2.CV_64F 保留负数,再用 取绝对值。不然会出现只有一半的边缘被提取出来。opencv默认范围是0~255,超出范围就设为0或255。
- 不要一次性水平、竖直都去提取边缘,这样提取的效果不好。应该先水平提取再竖直提取,再用 进行图像融合
dst = cv2.Sobel(src, ddepth, dx, dy, ksize)
- ddepth:图像的深度,通常设为-1
- dx和dy分别表示水平和竖直方向,通常设为dx=0,dy=1 或者 dx=1,dy=0,不要设置成dx=1,dy=1
- ksize是Sobel算子的大小,通常设为3
# 先用大爱心提取边缘
img = cv2.imread('pic/erosion.png')
img = cv2.resize(img, (0,0), fx=0.6, fy=0.6)
cv_show('img',img)
白到黑是正数,黑到白就是负数了,所有的负数都会被截断为0,所以要取绝对值
cv2.CV_64F表示64位浮点数,写成cv2.CV_64FC3中的C3表示3通道。好像默认为C1,cv2.CV_64F <==> cv2.CV_64FC1
[图像处理]-Opencv中数据类型CV_8U, CV_16U, CV_16S, CV_32F 以及 CV_64F是什么?
sobelx = cv2.Sobel(img, cv2.CV_64F, 1, 0, ksize=3) # 用cv2.CV_64F保留负数
sobelx = cv2.convertScaleAbs(sobelx) # 取绝对值
cv_show('sobelx', sobelx)
sobely = cv2.Sobel(img, cv2.CV_64F, 0, 1, ksize=3)
sobely = cv2.convertScaleAbs(sobely)
cv_show('sobely', sobely)
分别计算出了x和y,再进行图像融合,得到最终的边缘图
sobelxy = cv2.addWeighted(sobelx, 0.5, sobely, 0.5, 0)
直接用Sobel同时进行水平和竖直边缘提取,不建议!!!
sobelxxyy = cv2.Sobel(img, cv2.CV_64F, 1, 1, ksize=3)
对比展示
res = np.hstack((img, sobelx, sobely, sobelxy, sobelxxyy))
cv_show('res', res)
把代码整合在一起,提取一张复杂图像的边缘
# 以灰度图读取图像
img = cv2.imread('pic/Lenna.png', cv2.IMREAD_GRAYSCALE)
img = cv2.resize(img, (0,0), fx=0.8, fy=0.8)

# 提取sobelx
sobelx = cv2.Sobel(img, cv2.CV_64F, 1, 0, ksize=3)
sobelx = cv2.convertScaleAbs(sobelx)

# 提取sobely
sobely = cv2.Sobel(img, cv2.CV_64F, 0, 1, ksize=3)
sobely = cv2.convertScaleAbs(sobely)

# 融合sobelxy
sobelxy = cv2.addWeighted(sobelx, 0.5, sobely, 0.5, 0)

# 显示查看
res = np.hstack((img, sobelxy))
cv_show('res', res)
Scharr算子
G x = [ − 3 0 3 − 10 0 10 − 3 0 3 ] ∗ A and G y = [ − 3 − 10 − 3 0 0 0 − 3 − 10 − 3 ] ∗ A \mathbf{G}_{x}=\left[\begin{array}{ccc} -3 & 0 & 3 \\ -10 & 0 & 10 \\ -3 & 0 & 3 \end{array}\right] * \mathbf{A} \quad \text { and } \quad \mathbf{G}_{y}=\left[\begin{array}{ccc} -3 & -10 & -3 \\ 0 & 0 & 0 \\ -3 & -10 & -3 \end{array}\right] * \mathbf{A} Gx=⎣⎡−3−10−30003103⎦⎤∗A and Gy=⎣⎡−30−3−100−10−30−3⎦⎤∗A
- 关注得更多,线条更丰富一些
- scharr算子比Sobel算子更敏感一些
- 比起Sobel算子,没有ksize这个参数了
# 提取灰度图
img = cv2.imread('pic/Lenna.png', cv2.IMREAD_GRAYSCALE)
img = cv2.resize(img, (0,0), fx=0.8, fy=0.8)

# scharrx
x = cv2.Scharr(img, cv2.CV_64F, 1, 0)
x = cv2.convertScaleAbs(x)

# scharry
y = cv2.Scharr(img, cv2.CV_64F, 0, 1)
y = cv2.convertScaleAbs(y)

# scharrxy
scharrxy = cv2.addWeighted(x, 0.5, y, 0.5, 0)

# show()
cv_show('scharrxy', scharrxy)
laplacian算子(拉普拉斯算子)
G = [ 0 1 0 1 − 4 1 0 1 0 ] \mathbf{G}=\left[\begin{array}{ccc} 0 & 1 & 0 \\ 1 & -4 & 1 \\ 0 & 1 & 0 \end{array}\right] G=⎣⎡0101−41010⎦⎤
- 像是:中间 - 边缘
- 比起Sobel算子、Scharr算子,没有x、y那种水平、竖直的感觉了
- 是二阶导,对边界更敏感
- 存在的问题:对一些噪音点更敏感
- 一般是与其他算法共同使用,不会单独去使用它
img = cv2.imread('pic/Lenna.png', cv2.IMREAD_GRAYSCALE)
img = cv2.resize(img, (0,0), fx=0.8, fy=0.8)
laplacian = cv2.Laplacian(img, cv2.CV_64F)
laplacian = cv2.convertScaleAbs(laplacian)

cv_show('laplacian', laplacian)
比较3种算法得边缘提取效果
res = np.hstack((sobelxy, scharrxy, laplacian))
cv_show('res', res)
Canny边缘检测
cv2.Canny(img, minval, maxval)
minval或maxval值越小,检测出来的边就越多;反之越少。
- 1)使用高斯滤波器,以平滑图像,滤除噪声。
- 2)使用Sobel算子,计算图像中每个像素点得梯度大小和方向。
- 3)应用非极大值(Non-Maximum Suppression)抑制,以消除边缘检测带来的杂散效应。
- 4)应用双阈值(Double-Threshold)检测来确定真实的和潜在的边缘。
- 5)通过抑制孤立的弱边缘最终完成边缘检测。
1.高斯滤波器
H = [ 0.0924 0.1192 0.0924 0.1192 0.1538 0.1192 0.0924 0.1192 0.0924 ] <–这里还进行是归一化处理 e = H ∗ A = [ h 11 h 12 h 13 h 21 h 22 h 23 h 31 h 32 h 33 ] ∗ [ a b c d e f g h i ] = sum ( [ a × h 11 b × h 12 c × h 13 d × h 21 e × h 22 f × h 23 g × h 31 h × h 32 i × h 33 ] ) \begin{aligned} &H=\left[\begin{array}{lll} 0.0924 & 0.1192 & 0.0924 \\ 0.1192 & 0.1538 & 0.1192 \\ 0.0924 & 0.1192 & 0.0924 \end{array}\right] \text { <--这里还进行是归一化处理 } \\ &e=H * A=\left[\begin{array}{lll} \mathrm{h}_{11} & \mathrm{~h}_{12} & \mathrm{~h}_{13} \\ \mathrm{~h}_{21} & \mathrm{~h}_{22} & \mathrm{~h}_{23} \\ \mathrm{~h}_{31} & \mathrm{~h}_{32} & \mathrm{~h}_{33} \end{array}\right] *\left[\begin{array}{lll} a & b & c \\ d & e & f \\ g & h & i \end{array}\right]=\operatorname{sum}\left(\left[\begin{array}{lll} \mathrm{a} \times \mathrm{h}_{11} & \mathrm{~b} \times \mathrm{h}_{12} & \mathrm{c} \times \mathrm{h}_{13} \\ \mathrm{~d} \times \mathrm{h}_{21} & \mathrm{e} \times \mathrm{h}_{22} & \mathrm{f} \times \mathrm{h}_{23} \\ \mathrm{~g} \times \mathrm{h}_{31} & \mathrm{~h} \times \mathrm{h}_{32} & \mathrm{i} \times \mathrm{h}_{33} \end{array}\right]\right) \end{aligned} H=⎣⎡0.09240.11920.09240.11920.15380.11920.09240.11920.0924⎦⎤ <–这里还进行是归一化处理 e=H∗A=⎣⎡h11 h21 h31 h12 h22 h32 h13 h23 h33⎦⎤∗⎣⎡adgbehcfi⎦⎤=sum⎝⎛⎣⎡a×h11 d×h21 g×h31 b×h12e×h22 h×h32c×h13f×h23i×h33⎦⎤⎠⎞
2.梯度和方向
G = G x 2 + G y 2 θ = arctan ( G y / G x ) S x = [ − 1 0 1 − 2 0 2 − 1 0 1 ] S y = [ 1 2 1 0 0 0 − 1 − 2 − 1 ] G x = S x ∗ A = [ − 1 0 1 − 2 0 2 − 1 0 1 ] ∗ [ a b c d e f g h i ] = sum ( [ − a 0 c − 2 d 0 2 f − g 0 i ] ) G y = S y ∗ A = [ 1 2 1 0 0 0 − 1 − 2 − 1 ] ∗ [ a b c d e f g h i ] = sum ( [ a 2 b c 0 0 0 − g − 2 h − i ] ) \begin{aligned} &\begin{aligned} &G=\sqrt{G_{x}^{2}+G_{y}^{2}} \\ &\theta=\arctan \left(G_{y} / G_{x}\right) \quad S_{x}=\left[\begin{array}{ccc} -1 & 0 & 1 \\ -2 & 0 & 2 \\ -1 & 0 & 1 \end{array}\right] \quad S_{y}=\left[\begin{array}{ccc} 1 & 2 & 1 \\ 0 & 0 & 0 \\ -1 & -2 & -1 \end{array}\right] \end{aligned}\\ &G_{x}=S_{x} * A=\left[\begin{array}{ccc} -1 & 0 & 1 \\ -2 & 0 & 2 \\ -1 & 0 & 1 \end{array}\right] *\left[\begin{array}{ccc} a & b & c \\ d & e & f \\ g & h & i \end{array}\right]=\operatorname{sum}\left(\left[\begin{array}{ccc} -a & 0 & c \\ -2 d & 0 & 2 f \\ -g & 0 & i \end{array}\right]\right)\\ &G_{y}=S_{y} * A=\left[\begin{array}{ccc} 1 & 2 & 1 \\ 0 & 0 & 0 \\ -1 & -2 & -1 \end{array}\right] *\left[\begin{array}{ccc} a & b & c \\ d & e & f \\ g & h & i \end{array}\right]=\operatorname{sum}\left(\left[\begin{array}{ccc} a & 2 b & c \\ 0 & 0 & 0 \\ -g & -2 h & -i \end{array}\right]\right) \end{aligned} G=Gx2+Gy2θ=arctan(Gy/Gx)Sx=⎣⎡−1−2−1000121⎦⎤Sy=⎣⎡10−120−210−1⎦⎤Gx=Sx∗A=⎣⎡−1−2−1000121⎦⎤∗⎣⎡adgbehcfi⎦⎤=sum⎝⎛⎣⎡−a−2d−g000c2fi⎦⎤⎠⎞Gy=Sy∗A=⎣⎡10−120−210−1⎦⎤∗⎣⎡adgbehcfi⎦⎤=sum⎝⎛⎣⎡a0−g2b0−2hc0−i⎦⎤⎠⎞
3.非极大值抑制
- 梯度方向与边界方向应该是一个垂直关系。
- 当前这个值是不是极大值点,应该跟邻近值去比较幅值大小,如果是最大的则保留,不是最大的就抑制掉。
- minval或者maxval越小,则表示条件比较松,检测出来的边比较丰富(杂乱)
- minval或者maxval越大,检测到的边缘就较少
img = cv2.imread('pic/Lenna.png', cv2.IMREAD_GRAYSCALE)
img = cv2.resize(img, (0,0), fx=0.8, fy=0.8)

v1 = cv2.Canny(img, 80, 150) # 都比较大,检测出来的线条就越少
v2 = cv2.Canny(img, 50, 100) # minnval和maxval都比较小,检测出的线条就越多

res = np.hstack((img, v1, v2))
cv_show('res', res)
图像金字塔
目的:进行特征提取
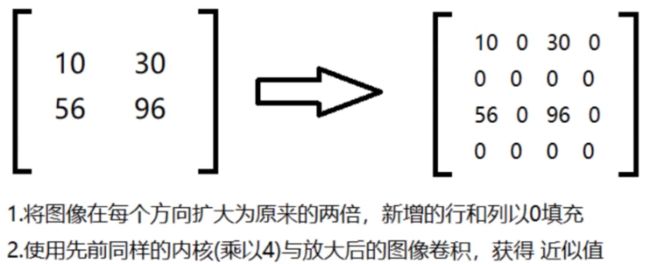
- 高斯金字塔 cv2.pyrUp(img)上采样、cv2.pyrDown(img)下采样,每调用一次就放大或者缩小2倍
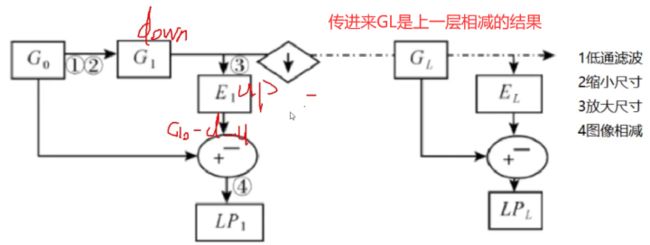
- 拉普拉斯金字塔
一般金字塔4~5层
强烈推荐一下这篇博文,后续要了解的时候再去仔细看看吧!OpenCV中的图像金字塔(高斯金字塔、拉普拉斯金字塔)
注意:通过上面的高斯金字塔上采样和下采样的原理可以知道,当我们先下采样然后再上采样;或者反过来操作,这个时候得到的图像和虽然原图尺寸是一样的,但是图像会有一些模糊(或者说是失真)
下采样downsample,把图片缩小(在上图的方向就应该是由底向上)
高斯金字塔
高斯金字塔:向下采样方法(downsample缩小)

高斯金字塔:向上采样方法(upsample缩小)

img = cv2.imread('pic/dog3_small.jpg')

up = cv2.pyrUp(img) # 先上采样放大2倍
down = cv2.pyrDown(up) # 再下采样缩小2倍,shape变为与原图相同

# 与原图对比,会发现变模糊
res = np.hstack((img, down))
cv_show('res', res)
拉普拉斯金字塔
每一层都是去做:计算出原图 - 先下采样再上采样 的差异,即
L i = G i − P y r U p ( P y r D o w n ( G i ) ) L_i=G_i-PyrUp(PyrDown(G_i)) Li=Gi−PyrUp(PyrDown(Gi))

# 进行一层拉普拉斯金字塔效果
img = cv2.imread('pic/dog3_small.jpg')

down = cv2.pyrDown(img)
down_up = cv2.pyrUp(down)
L_1 = img - down_up  # 1层

down2 = cv2.pyrDown(L_1)
down_up2 = cv2.pyrUp(down2)
L_2 = L_1 - down_up2 # 2层

down3 = cv2.pyrDown(L_2) # 3层
down_up3 = cv2.pyrUp(down3)
L_3 = L_2 - down_up3

# down4 = cv2.pyrDown(L_3) # 4层
# down_up4 = cv2.pyrUp(down4)
# L_4 = L_3 - down_up4

res = np.hstack((img, L_1, L_2, L_3))
cv_show('res', res)
图像轮廓
-
先进行轮廓检测:contours, hierarchy = cv2.findContours(thresh, cv2.RETR_TREE, cv2.CHAIN_APPROX_NONE) # thresh是img进行灰度化再二值化
-
再选择某一个具体轮廓:cnt = contours[0]
-
按照需求绘制原图+边界图,注意:一定要先将原图copy再复制,否则原图会发生更改,即draw_img=img.copy()
-
绘制轮廓图:res = cv2.drawContours(draw_img, contours, -1, (0, 0, 255), 1)
-
绘制轮廓近似图:epsilon = 0.05 * cv2.arcLength(cnt, True) 、approx = cv2.approxPolyDP(cnt, epsilon, True)
-
绘制轮廓矩形外接图:x,y,w,h = cv2.boundingRect(cnt)、res = cv2.rectangle(draw_img, (x,y), (x+w,y+h), (0,255,0), 2)
-
绘制轮廓圆形外接图:(x,y), radius = cv2.minEnclosingCircle(cnt)、res = cv2.circle(draw_img, center, radius, (0,255,0), 2)
轮廓检测
代码:cv2.findContours(img, mode, method)
注意:使用灰度化且二值化图像。
mode:轮廓检索模式
- RETR_EXTERNAL:只检索最外面的轮廓;
- RETR_LIST:检索所有的轮廓,并将其保存到一条链表当中;
- RTR_CCOMP:检索所有的轮廓,并将他们组织为两层:顶层是各部分的外部边界,第二层是空洞的世界;
- RETR_TREE:检索所有的轮廓,并重构嵌套轮廓的整个层次。(最常用)
method:轮廓逼近方法
- CHAIN_APPROX_NONE:以Freeman链码的方式输出轮廓,所有其他方法输出多边形(顶点的序列)。
- CHAIN_APPROX_SIMPLE:压缩水平的、垂直的和斜的部分,也就是,函数只保留他们的终点部分。

参考一下这个博客:opencv:图像轮廓检测 cv2.findContours() 与 cv2.drawContours()
我使用的是opencv2,所以返回的参数只有2个:轮廓点集contours(是一个list,可是为啥我看着是一个tuple,所有元素都是ndarray)、每条轮廓对应的索引hierarchy。
opencv3还会多返回一个img(所处理的图像),作为第一个返回参数,即返回img, contours, hierarchy。
step1:转为灰度化且二值化图像
img = cv2.imread('pic/edge.png')
gray = cv2.cvtColor(img, cv2.COLOR_BGR2GRAY) # 灰度化
ret, thresh = cv2.threshold(gray, 127, 255, cv2.THRESH_BINARY) # 二值化
cv_show('thresh', thresh)
contours, hierarchy = cv2.findContours(thresh, cv2.RETR_TREE, cv2.CHAIN_APPROX_NONE) # 得到轮廓点集
step2:绘制轮廓
注意:一定要先对绘制图像进行copy(),不然原图会发生改变!
# 传入绘制图像(原图)、轮廓,轮廓索引,颜色模式,线条厚度(只能为整数)
draw_img = img.copy()
res = cv2.drawContours(draw_img, contours, -1, (0, 0, 255), 1) # -1表示选择轮廓索引进行绘制,(0,0,255)在BGR模式下表示红色,1表示线条厚度
cv_show('res',res)
轮廓特征
应用:特征分析、轮廓建模
上面轮廓检测得到的contours不能直接拿来做算面积等操作。当要计算轮廓特征时,需要将具体的轮廓(指定索引)拿出来。
cnt = contours[0]
# 面积
area = cv2.contourArea(cnt)
# 周长,True表示闭合的
length = cv2.arcLength(cnt, True)
print(area, length)
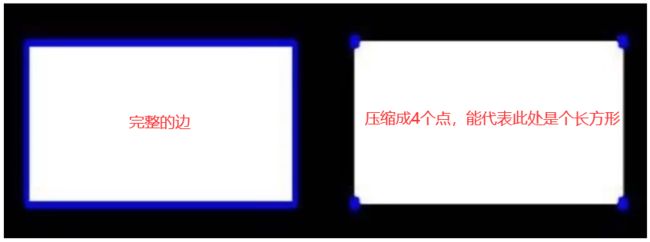
轮廓近似

就是让轮廓比较规整,不那么毛毛刺刺的。对曲线近似成直线。epsilon的值越大,则近似程度越小,毛边轮廓越多(接近于原图的边缘轮廓)。
approx = cv2.approxPolyDP(contour,epsilon,True) 采用Douglas-Peucker算法
- contour:轮廓的点集
- epsilon:epsilon的含义如下所述,滤掉的线段集离新产生的线段集的距离为d,若d小于epsilon,则滤掉,否则保留
- True:指示新产生的轮廓闭合
参考博客:opencv 使用approxPolyDP轮廓近似
还有采用的算法:Douglas-Peucker压缩算法
img = cv2.imread('pic/edgestar.png') # 灰度图
gray = cv2.cvtColor(img, cv2.COLOR_BGR2GRAY)
cv_show('img',gray)
_, thresh = cv2.threshold(gray, 127, 255, cv2.THRESH_BINARY) # 二值化
contours, hierarchy = cv2.findContours(thresh, cv2.RETR_TREE, cv2.CHAIN_APPROX_NONE) # 提取轮廓

cnt = contours[0]
# 显示轮廓和原图
draw_img = img.copy()
res = cv2.drawContours(draw_img, contours[0], -1, (0,0,255), 2)
cv_show('res',res)
epsilon = 0.05*cv2.arcLength(cnt, True)  # 一般是按照周长的百分比设置的
approx = cv2.approxPolyDP(cnt, epsilon, True) # 近似函数:指定的某一个轮廓,给字节指定的比较的长度,得到的结果也是一个轮廓

draw_img = img.copy()
res = cv2.drawContours(draw_img, [approx], -1, (0,0,255), 2)
cv_show('res', res)
外接矩形(边界矩阵)
矩形边框(Bounding Rectangle)是说,用一个最小的矩形,把找到的形状(也就是指定的cnt)包起来。
- cv2.boundingRect(cnt) 返回4个值分别是x,y,w,h。x,y是矩阵左上点的坐标,w,h是矩阵的宽和高。
- 利用cv2.rectangle(img, (x,y), (x+w,y+h), (0,255,0), 2)画出矩形
- img:原图
- (x,y) :矩形的左上点坐标
- (x+w,y+h):矩形的右下点坐标
- (0,255,0):画线对应的rgb颜色,这里表示绿色
- 2是线条宽度
参考博客:opencv-python中 boundingRect(cnt)以及cv2.rectangle用法
img = cv2.imread('pic/edgestar.png')
gray = cv2.cvtColor(img, cv2.COLOR_BGR2GRAY) # 转为灰度图
_, thresh = cv2.threshold(gray, 127, 255, cv2.THRESH_BINARY) #转为二值图
contours, hierarchy = cv2.findContours(thresh, cv2.RETR_TREE, cv2.CHAIN_APPROX_NONE) # 找轮廓

cnt = contours[0]

x,y,w,h = cv2.boundingRect(cnt) # 显示外面的绿框

draw_img = img.copy()
res = cv2.rectangle(draw_img, (x,y), (x+w,y+h), (0,255,0), 2)
cv_show('img', res)
轮廓面积与边界矩形比
area = cv2.contourArea(cnt) # 轮廓面积
x, y, w, h = cv2.boundingRect(cnt) # 边界矩形
rect_area = w * h # 边界矩形面积
extent = float(area) / rect_area
print('轮廓面积与边界矩形比',extent)
外接圆
(x,y), radius = cv2.minEnclosingCircle(cnt)
center = (int(x), int(y)) # 圆心
radius = int(radius) # 半径

draw_img = img.copy()
res = cv2.circle(draw_img, center, radius, (0,255,0), 2)
cv_show('img', res)
模板匹配
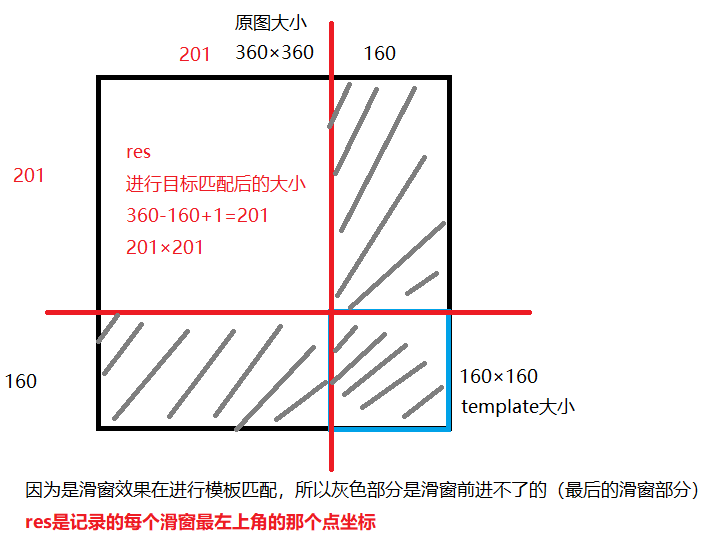
模板匹配和卷积原理很像,模板在原图上从原点开始滑动,计算模板与(图象被模板覆盖的地方)的差别程度,这个差别程度的计算方法在opencv中有6种,然后将每次结算的结果放进一个矩阵里,作为结果输出。加入原图形是A×B大小,而模板是a×b大小,则输出的结果矩阵是(A-a+1)×(B-b+1)。
从左到右,从上到下,跟模板匹配。一个区域一个区域地去进行比较,返回每个窗口匹配的结果。(用平方项去代表像素点之间的损失,或者平方系数)
参考博客:cv2.matchTemplate模板匹配和cv2.minMaxLoc()函数
参考博客:opencv学习笔记十八:模板匹配(cv2.matchTemplate、cv2.minMaxLoc)
- cv2.matchTemplate(image, templ, method, result=None, mask=None),返回的是一个矩阵res,记录所有滑窗的左上角坐标。
- image:待搜索图像
- templ:模板图像
- result:匹配结果
- method:计算匹配程度的方法(使用不同方法产生的结果意义可能不太一样,有些返回值越大匹配程度越好,而有些方法返回值越小匹配程度越好。)
- TM_SQDIFF:平方差匹配法:该方法采用平方差来进行匹配;最好的匹配值为0;匹配越差,匹配值越大。小
- TM_CCORR:相关匹配法:该方法采用乘法操作;数值越大表明匹配程度越好。
- TM_CCOEFF:相关系数匹配法:1表示完美的匹配;-1表示最差的匹配。
- TM_SQDIFF_NORMED:归一化平方差匹配法:计算出来的值越接近于0,越相关。小
- TM_CCORR_NORMED:归一化相关匹配法:计算出来的值越接近于1,越相关
- TM_CCOEFF_NORMED:归一化相关系数匹配:计算出来的值越接近1,越相关
- cv2.minMaxLoc(src, mask=None)
函数功能:返回一个矩阵的最小值,最大值,最小值索引,最大值索引。(min_val,max_val,min_indx,max_indx)
注意:
- 图像img和模板template都需要以灰度图读进来。
- 建议用上面使用最后3个归一化的方法,因为结果会更公平一些。
- 假设min_loc或max_loc的值为(0,2),则表示的是在第1列第3行,也就是说第一个值是宽度,第二个值才是高度。
# 模板匹配
img = cv2.imread('pic/Lenna_small.png', 0) # 读入灰度图像
template = cv2.imread('pic/face.png', 0) # 读入灰度图像
h, w = template.shape[:2]
img.shape
(360, 360)
template.shape
(160, 160)
methods = ['cv2.TM_CCOEFF','cv2.TM_CCOEFF_NORMED','cv2.TM_CCORR','cv2.TM_CCORR_NORMED','cv2.TM_SQDIFF','cv2.TM_SQDIFF_NORMED']
res = cv2.matchTemplate(img, template, 1)
res.shape # 360-160+1,表示每一个窗口左上角的值,或者平方项的损失
(201, 201)
min_val, max_val, min_loc, max_loc = cv2.minMaxLoc(res) # 去定位一下
min_val
0.0
max_val
0.3593710660934448
min_loc
(112, 116)
max_loc
(0, 188)
单个目标匹配
参考博客:python中的eval函数的使用详解
感觉只要记住它的作用就行了,就是把这些已经内定好的方法,例如’cv2.TM_CCOEFF’,'cv2.TM_CCOEFF_NORMED’等,利用eval函数,就可以找到在系统中它的序号标志代表是多少了。
import matplotlib.pyplot as plt

for meth in methods:
    img2 = img.copy() # 原图副本,否则在绘矩形时会发生改变

    # 匹配方法的真值
    method = eval(meth)
    print(method)
    res = cv2.matchTemplate(img, template, method) # 匹配结果(是一个数组)
    min_val, max_val, min_loc, max_loc = cv2.minMaxLoc(res) # 定位

    # 如果是平方差匹配TM_SQDIFF或归一化平方差匹配TM_SQDIFF_NONRMED,取最小值
    if method in [cv2.TM_SQDIFF, cv2.TM_SQDIFF_NORMED]:
        top_left = min_loc
    else:
        top_left = max_loc
    bottom_right = (top_left[0]+w, top_left[1]+h) # 右下角坐标

    # 画矩形
    cv2.rectangle(img2, top_left, bottom_right, 255, 2) # 255表示绘制颜色,白色,等价于(255, 255, 255)

    plt.subplot(121), plt.imshow(res, cmap='gray')
    plt.xticks([]), plt.yticks([]) # 隐藏坐标轴
    plt.subplot(122), plt.imshow(img2, cmap='gray')
    plt.xticks([]), plt.yticks([])
    plt.suptitle(meth)
    plt.show()
4
[外链图片转存失败,源站可能有防盗链机制,建议将图片保存下来直接上传(img-FCKHj7Nx-1647232784478)(output_137_1.png)]
5
[外链图片转存失败,源站可能有防盗链机制,建议将图片保存下来直接上传(img-eQw7Rfyu-1647232784478)(output_137_3.png)]
2
[外链图片转存失败,源站可能有防盗链机制,建议将图片保存下来直接上传(img-VHCzfNlT-1647232784478)(output_137_5.png)]
3
[外链图片转存失败,源站可能有防盗链机制,建议将图片保存下来直接上传(img-5boI8zaK-1647232784479)(output_137_7.png)]
0
[外链图片转存失败,源站可能有防盗链机制,建议将图片保存下来直接上传(img-x3kfnDGQ-1647232784479)(output_137_9.png)]
1
[外链图片转存失败,源站可能有防盗链机制,建议将图片保存下来直接上传(img-iiXEjAxj-1647232784479)(output_137_11.png)]
多个对象匹配


