Vue实战篇二十五:使用ECharts绘制疫情折线图
系列文章目录
Vue基础篇一:编写第一个Vue程序
Vue基础篇二:Vue组件的核心概念
Vue基础篇三:Vue的计算属性与侦听器
Vue基础篇四:Vue的生命周期(秒杀案例实战)
Vue基础篇五:Vue的指令
Vue基础篇六:Vue使用JSX进行动态渲染
Vue提高篇一:使用Vuex进行状态管理
Vue提高篇二:使用vue-router实现静态路由
Vue提高篇三:使用vue-router实现动态路由
Vue提高篇四:使用Element UI组件库
Vue提高篇五:使用Jest进行单元测试
Vue提高篇六: 使用Vetur+ESLint+Prettier插件提升开发效率
Vue实战篇一: 使用Vue搭建注册登录界面
Vue实战篇二: 实现邮件验证码发送
Vue实战篇三:实现用户注册
Vue实战篇四:创建多步骤表单
Vue实战篇五:实现文件上传
Vue实战篇六:表格渲染动态数据
Vue实战篇七:表单校验
Vue实战篇八:实现弹出对话框进行交互
Vue实战篇九:使用省市区级联选择插件
Vue实战篇十:响应式布局
Vue实战篇十一:父组件获取子组件数据的常规方法
Vue实战篇十二:多项选择器的实际运用
Vue实战篇十三:实战分页组件
Vue实战篇十四:前端excel组件实现数据导入
Vue实战篇十五:表格数据多选在实际项目中的技巧
Vue实战篇十六:导航菜单
Vue实战篇十七:用树型组件实现一个知识目录
Vue实战篇十八:搭建一个知识库框架
Vue实战篇十九:使用printjs打印表单
Vue实战篇二十:自定义表格合计
Vue实战篇二十一:实战Prop的双向绑定
Vue实战篇二十二:生成二维码
Vue实战篇二十三:卡片风格与列表风格的切换
Vue实战篇二十四:分页显示
文章目录
- 系列文章目录
- 一、背景
- 二、ECharts
- 三、前端实现
- 3.1 Vue安装ECharts
- 3.2 编写平滑折线图组件
- 3.3 在主页面中加入组件及疫情数据
- 3.4 防抖优化
- 四、源码
一、背景
二、ECharts
ECharts是一款基于JavaScript的数据可视化图表库,提供直观,生动,可交互,可个性化定制的数据可视化图表。
- EChart提供了很多的常用图表类型:
| 常用类型 |
|---|
| 折线图、柱状图 、饼图、散点图、地图、K线图、雷达图、势力图、漏斗图… |
- 今天我们将学习平滑折线图:每个平面折线图,都有一个X轴,一个Y轴,这两个轴都是由轴线、刻度、刻度标签、轴标题四个部分组成。
option = {
    // X轴线
    xAxis: {
        // 轴标题
        name:"月份",
        type: 'category',
        // 刻度标签
        data: ['Mon', 'Tue', 'Wed', 'Thu', 'Fri', 'Sat', 'Sun']
    },
    // Y轴线
    yAxis: {
         // 轴标题
        name:"数量",
        type: 'value'
    },
    series: [{
        // 刻度
        data: [820, 932, 901, 934, 1290, 1330, 1320],
        // 折线类型
        type: 'line',
        // 平滑
        smooth: true
    }]
};
三、前端实现
- 了解了ECharts折线图的基本用法后,我们将按以下几个步骤来实现疫情折线图。
3.1 Vue安装ECharts
- 注意,我们安装5.0以下的版本
npm install echarts@4.9.0 --save
- 安装元素监听组件Resize Detector,用于监听页面大小的调整,当页面大小发生变化时,调用ECharts的resize方法自适应页面大小。
在有些场景下,我们希望当容器大小改变时,图表的大小也相应地改变。
比如,图表容器是一个高度为 400px、宽度为页面 100% 的节点,你希望在浏览器宽度改变的时候,始终保持图表宽度是页面的 100%。
这种情况下,可以监听页面的 resize 事件获取浏览器大小改变的事件,然后调用 echartsInstance.resize 改变图表的大小
npm install --save resize-detector
3.2 编写平滑折线图组件
- MyLineChart.vue
<template>
  <div ref="myChart" :style="{height:height,width:width,margin:margin}" />
template>

<script>
import echarts from 'echarts'
import { addListener, removeListener } from 'resize-detector'

// 用于查看组件resize重绘次数
const Count = 0

export default {
  props: {
    width: {
      type: String,
      default: '100%'
    },
    height: {
      type: String,
      default: '300px'
    },
    margin: {
      type: String,
      default: '0px'
    },
    autoResize: {
      type: Boolean,
      default: true
    },
    option: {
      type: Object,
      default: () => {}
    }
  },
  data() {
    return {
      chart: null,
      resizeCount: Count
    }
  },
  watch: {
    chartData: {
      deep: true,
      handler(val) {
        this.chart.setOption(val)
      }
    }
  },
  mounted() {
    this.$nextTick(() => {
      this.initChart()
    })
  },
  beforeDestroy() {
    if (!this.chart) {
      return
    }
    // 移除监听页面大小调整
    removeListener(this.$refs.myChart, this.resize)
    this.chart.dispose()
    this.chart = null
  },
  methods: {
    initChart() {
      this.chart = echarts.init(this.$refs.myChart)
      // 监听页面大小调整,调用自适应页面大小方法
      addListener(this.$refs.myChart, this.resize)
      this.chart.setOption(this.option)
    },
	// 组件自适应页面大小方法
    resize() {
      console.log('resize', ++this.resizeCount)
      this.chart.resize()
    }
  }
}
script>
3.3 在主页面中加入组件及疫情数据
- dashboard/index.vue
<template>
  <div class="dashboard-container">

    <my-line-chart :option="lineChartOption" />

  div>
template>

<script>
import { mapGetters } from 'vuex'
import MyLineChart from '@/components/Echarts/MyLineChart'

export default {
  name: 'Dashboard',
  components: { MyLineChart },
  data() {
    return {
      lineChartOption: {
        // X轴
        xAxis: {
          name: '日期',
          data: ['4/1', '4/2', '4/3', '4/4', '4/5', '4/6', '4/7', '4/8', '4/9', '4/10', '4/11', '4/12', '4/13', '4/14', '4/15', '4/16'],
          boundaryGap: false,
          axisTick: {
            show: false
          }
        },
        // 提示
        tooltip: {
          trigger: 'axis',
          axisPointer: {
            type: 'cross'
          },
          padding: [5, 10]
        },
        // Y轴
        yAxis: {
          name: '人数',
          axisTick: {
            show: false
          }
        },
        // 图例
        legend: {
          data: ['新增本土']
        },
        // 数据线
        series: [{
          name: '新增本土', itemStyle: {
            normal: {
              color: '#FF005A',
              lineStyle: {
                color: '#FF005A',
                width: 2
              }
            }
          },
          smooth: true,
          type: 'line',
          // 疫情数据
          data: [12, 5, 10, 7, 3, 3, 13, 5, 7, 14, 4, 3, 2, 4, 2, 7],
          // 动画设置
          animationDuration: 2800,
          animationEasing: 'cubicInOut'
        }]
      }
    }
  },
  computed: {
    ...mapGetters([
      'name',
      'roles'
    ])
  }
}
script>

<style lang="scss" scoped>
.dashboard {
  &-container {
    margin: 30px;
  }
  &-text {
    font-size: 30px;
    line-height: 46px;
  }
}
style>
3.4 防抖优化
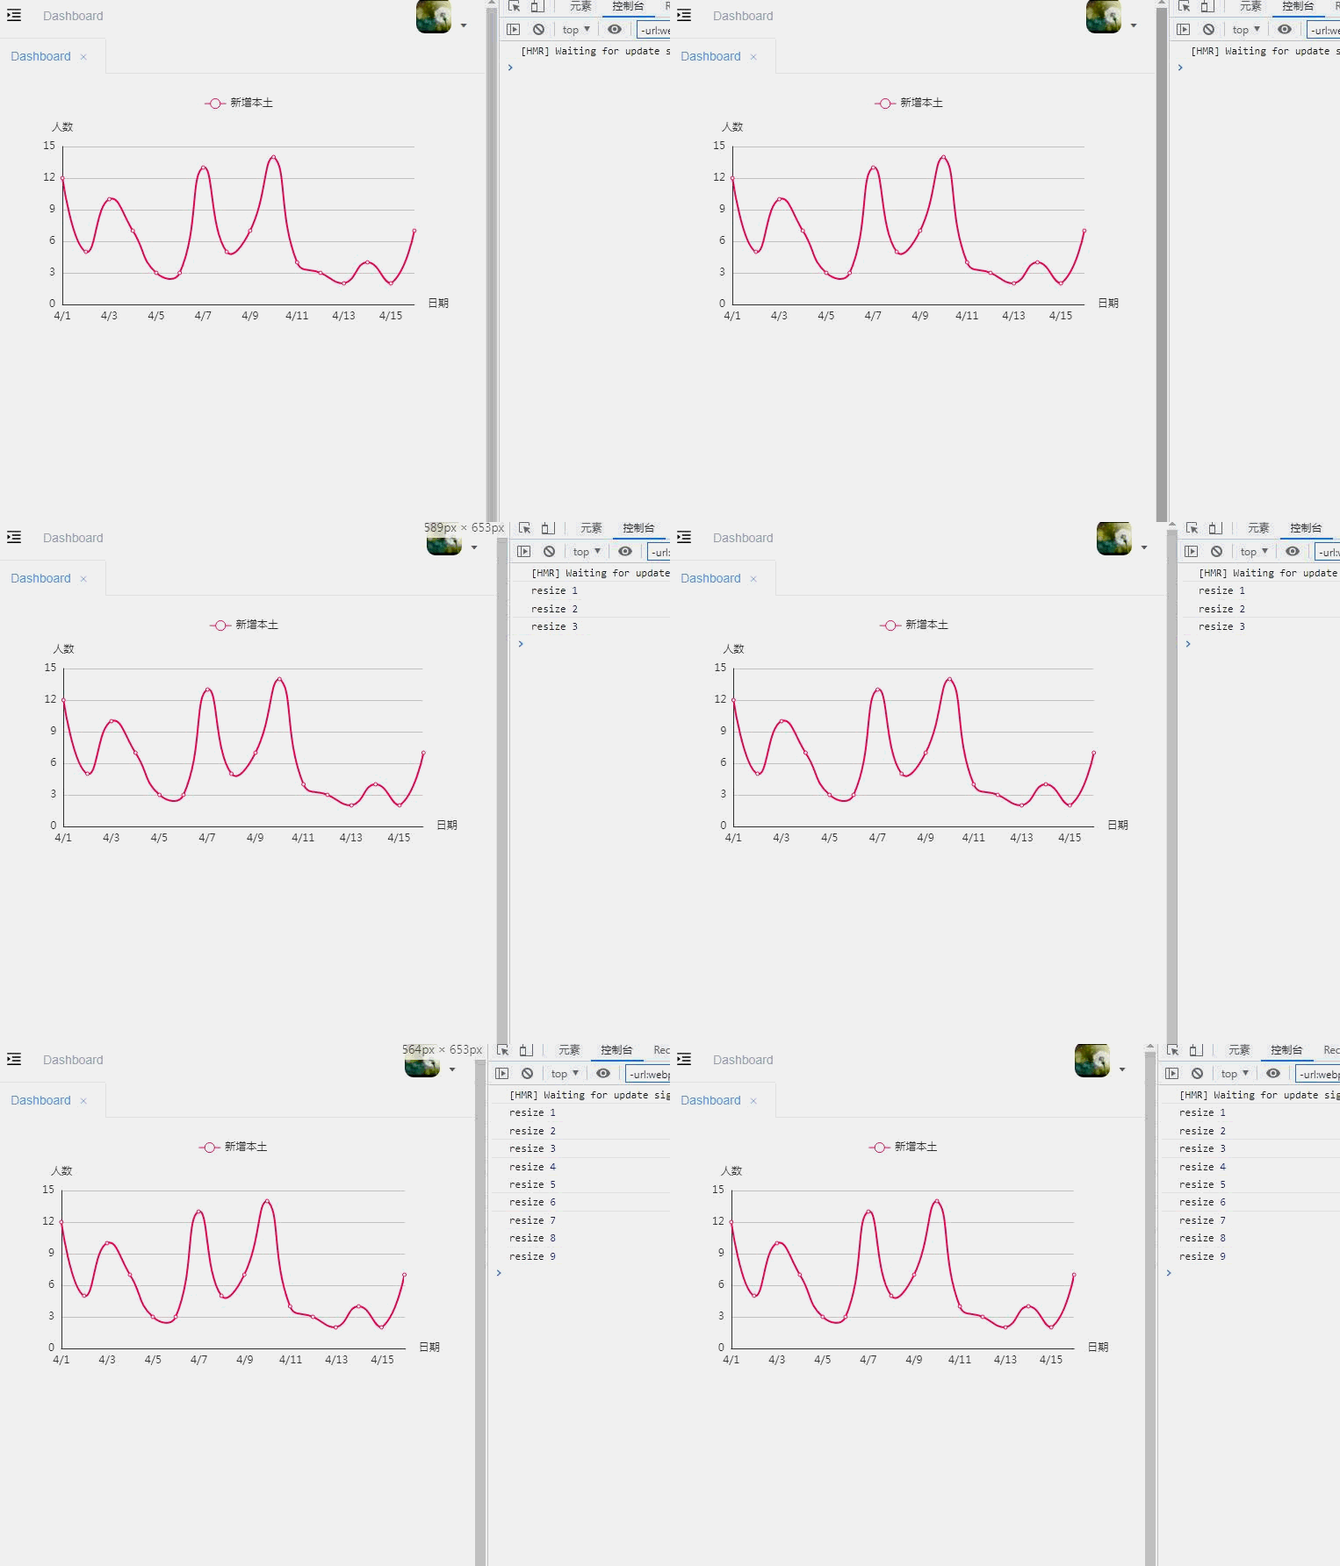
- 是不是已经完成了?还记得我们在组件中定义了一个调整页面大小,记录重绘次数的全局变量resizeCount,我们需要通过它来监听一下组件重绘的次数, 防止调整页面时组件重绘次数过多,性能下降。
- 通过以上动画,我们会发现调整一次页面大小,组件重绘了至少三次,这会给前端性能造成重大影响,我们需要通过防抖技术来进行优化。
所谓防抖,就是如果短时间内大量触发同一事件,只会执行一次函数。防抖的结果是频繁的触发转变为触发一次。
- 我们改造一下组件,加入防抖函数
<template>
  <div ref="myChart" :style="{height:height,width:width,margin:margin}" />
template>

<script>
import echarts from 'echarts'
// 导入防抖函数
import debounce from 'lodash/debounce'
import { addListener, removeListener } from 'resize-detector'

const Count = 0

export default {
  ...
  created() {
    // 防抖处理
    this.resize = debounce(this.resize, 300)
  },
  ...
  methods: {
    ...

    resize() {
      console.log('resize', ++this.resizeCount)
      this.chart.resize()
    }
  }
}
script>
- 观察一下防抖的效果
四、源码
- 前端
https://gitee.com/zhuhuix/startup-frontend
https://github.com/zhuhuix/startup-frontend - 后端
https://gitee.com/zhuhuix/startup-backend
https://github.com/zhuhuix/startup-backend


