在XGBoost中通过Early Stop避免过拟合(练习)
来源:https://www.jianshu.com/p/f0ffa8a93327
1.首先先计算
- 在调用model.fit()函数时,可以指定测试数据集和评价指标,同时设置verbose参数为True,这样就可以在训练过程中输出模型在测试集的表现。
- e.g
- 通过下面的方法在使用XGBoost训练二分类任务时输出分类错误率(通过“error”指定):
eval_set = [(X_test, y_test)]
model.fit(X_train, y_train, eval_metric="error", eval_set=eval_set, verbose=True)
XGBoost提供了一系列的模型评价指标,包括但不限于:

	 - “rmse” 代表均方根误差
	 -  “mae” 代表平均绝对误差
	 -  “logloss” 代表二元对数损失
	 -  “mlogloss” 代表m-元对数损失
	 -  “error” 代表分类错误率
	 -  “auc” 代表ROC曲线下面积
- 完整代码:
import pandas as pd
from xgboost import XGBClassifier
from sklearn.model_selection import train_test_split
from sklearn.metrics import accuracy_score

dataset = pd.read_csv("C:\\Users\\Nihil\\Documents\\pythonlearn\\data\\pima-indians-diabetes.data.csv")

X = dataset.iloc[:,0:8]
y = dataset.iloc[:,8]

X_train,X_test,y_train,y_test = train_test_split(X,y,test_size=0.33,random_state=7)
model = XGBClassifier()
eval_set =[(X_test,y_test)]
model.fit(X_train,y_train,eval_metric='error',eval_set=eval_set,verbose=True)

y_pred = model.predict(X_test)
predictions = [round(value) for value in y_pred]
print(y_pred)
print(predictions)
关于
y_pred = model.predict(X_test)
predictions = [round(value) for value in y_pred]
输出结果一览![]()
输出评分,得到 Accuracy: 77.95%
accuracy = accuracy_score(y_test, predictions)
print("Accuracy: %.2f%%" % (accuracy * 100.0))
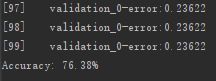
每次迭代都会输出分类错误,最终将会输出最后的分类准确率。
观察所有的输出,我们可以看到,在训练快要结束时测试集上的模型性能的变化是平缓的,甚至变得更差。
2. 使用学习曲线来评估XGBoost模型
我们可以提取出模型在测试数据集上的表现并绘制成图案,从而更好地洞察到在整个训练过程中学习曲线是如何变化的。
在调用XGBoost模型时我们提供了一个数组,数组的每一项是一个X和y的配对。
在测试集之外,我们同时将训练集也作为输入,从而观察在训练过程中模型在训练集和测试集上各自的表现。
eval_set = [(X_train, y_train), (X_test, y_test)]
model.fit(X_train, y_train, eval_metric="error", eval_set=eval_set, verbose=True)
模型在各个数据集上的表现可以在训练结束后通过model.evals_result()函数获取,这个函数返回一个dict包含了评估数据集的代码和对应的分数列表。
results = model.evals_result()
print(results)
输出

“validation_0”和“validation_1”代表了在调用fit()函数时传给eval_set参数的数组中数据集的顺序。
一个特定的结果,比如第一个数据集上的分类错误率,可以通过如下方法获取:
results['validation_0']['error']
另外我们可以指定更多的评价指标,从而同时获取多种评价指标的变化情况。
接着我们可以使用收集到的数据绘制曲线,从而更直观地了解在整个训练过程中模型在训练集和测试集上的表现究竟如何。
Tip:前后设置保持一致谢谢![]()
完整代码
import pandas as pd
from xgboost import XGBClassifier
from sklearn.model_selection import train_test_split
from sklearn.metrics import accuracy_score
from matplotlib import pyplot

dataset = pd.read_csv("C:\\Users\\Nihil\\Documents\\pythonlearn\\data\\pima-indians-diabetes.data.csv")

X = dataset.iloc[:,0:8]
y = dataset.iloc[:,8]

X_train,X_test,y_train,y_test = train_test_split(X,y,test_size=0.33,random_state=7)
model = XGBClassifier()
eval_set = [(X_train, y_train), (X_test, y_test)]
model.fit(X_train,y_train, eval_metric=["error", "logloss"],eval_set=eval_set,verbose=True)

y_pred = model.predict(X_test)
predictions = [round(value) for value in y_pred]
accuracy = accuracy_score(y_test, predictions)
print("Accuracy: %.2f%%" % (accuracy * 100.0))

results = model.evals_result()
epochs = len(results['validation_0']['error'])
x_axis = range(0, epochs)

fig,ax = pyplot.subplots()

ax.plot(x_axis, results['validation_0']['logloss'], label='Train')
ax.plot(x_axis, results['validation_1']['logloss'], label='Test')

ax.legend()
pyplot.ylabel('Log Loss')
pyplot.title('XGBoost Log Loss')
pyplot.show()
# plot classification error
fig,ax = pyplot.subplots()
ax.plot(x_axis, results['validation_0']['error'], label='Train')
ax.plot(x_axis, results['validation_1']['error'], label='Test')
ax.legend()
pyplot.ylabel('Classification Error')
pyplot.title('XGBoost Classification Error')
pyplot.show()
运行这段代码将会在每一次训练迭代中输出模型在训练集和测试集上的分类错误率。我们可以通过设置verbose=False来关闭输出。
我们绘制了两张图,第一张图表示的是模型在每一轮迭代中在两个数据集上的对数损失:

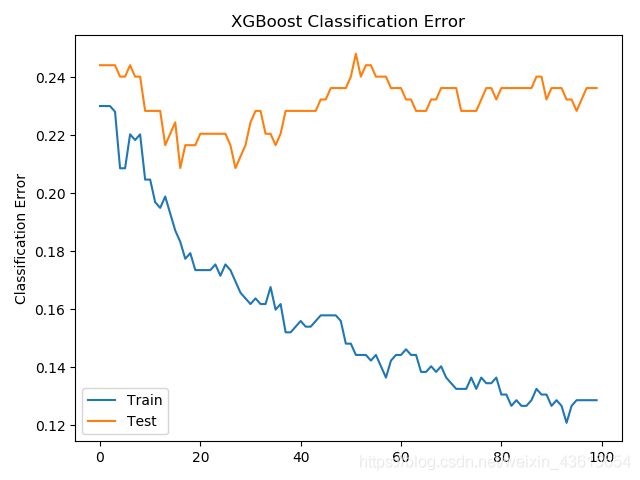
第二张图表示分类错误率:
从第一张图来看,似乎有机会可以进行Early Stop,大约在20到40轮迭代时比较合适。(20后不再下降)
从第二张图可以得到相似的结果,大概在40轮迭代时效果比较理想。
3.在XGBoost中进行Early Stop
XGBoost提供了在指定轮数完成后提前停止训练的功能。
除了提供用于评估每轮迭代中的评价指标和数据集之外,还需要指定一个窗口大小,意味着连续这么多轮迭代中模型的效果没有提升。这是通过early_stopping_rounds参数来设置的。
例如,我们可以像下面这样设置连续10轮中对数损失都没有提升:
eval_set = [(X_test, y_test)]
model.fit(X_train, y_train, early_stopping_rounds=10, eval_metric="logloss", eval_set=eval_set, verbose=True)
代码示例
import pandas as pd
from xgboost import XGBClassifier
from sklearn.model_selection import train_test_split
from sklearn.metrics import accuracy_score
from matplotlib import pyplot

dataset = pd.read_csv("C:\\Users\\Nihil\\Documents\\pythonlearn\\data\\pima-indians-diabetes.data.csv")

X = dataset.iloc[:,0:8]
y = dataset.iloc[:,8]

X_train,X_test,y_train,y_test = train_test_split(X,y,test_size=0.33,random_state=7)
model = XGBClassifier()
eval_set = [(X_train, y_train), (X_test, y_test)]
model.fit(X_train,y_train, early_stopping_rounds=10,eval_metric="logloss",eval_set=eval_set,verbose=True)

y_pred = model.predict(X_test)
predictions = [round(value) for value in y_pred]
accuracy = accuracy_score(y_test, predictions)
print("Accuracy: %.2f%%" % (accuracy * 100.0))
运行结果
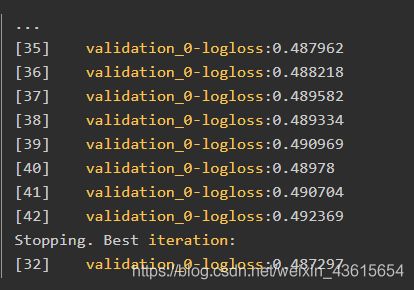
我们可以看到模型在迭代到42轮时停止了训练,在32轮迭代后观察到了最好的效果。
通常将early_stopping_rounds设置为一个与总训练轮数相关的函数(本例中是10%),或者通过观察学习曲线来设置使得训练过程包含拐点,这两种方法都是不错的选择。
4.输出特征重要度
gradient boosting 还有一个优点是可以给出训练好的模型的特征重要性,
这样就可以知道哪些变量需要被保留,哪些可以舍弃
需要引入下面两个类
from xgboost import plot_importance
from matplotlib import pyplot
和前面的代码相比,就是在 fit 后面加入两行画出特征的重要性
model.fit(X, y)
plot_importance(model)
pyplot.show()
输出

5.调参
如何调参呢,下面是三个超参数的一般实践最佳值,可以先将它们设定为这个范围,然后画出 learning curves,再调解参数找到最佳模型:
- learning_rate = 0.1 或更小,越小就需要多加入弱学习器;
- tree_depth = 2~8;
- subsample = 训练集的 30%~80%;
接下来我们用 GridSearchCV 来进行调参会更方便一些:
可以调的超参数组合有:
- 树的个数和大小 (n_estimators and max_depth).
- 学习率和树的个数 (learning_rate and n_estimators).
行列的 subsampling rates (subsample, colsample_bytree and colsample_bylevel).