matplotlib的绘图样式与色彩设置
绘图样式与色彩设置目录
- 一、matplotlib的绘图样式(style)
-
- 1.matplotlib预先定义样式
- 2.用户自定义stylesheet
- 3.设置rcparams
- 4.修改matplotlibrc文件
- 二、matplotlib的色彩设置(color)
-
- 1.RGB或RGBA
- 2.HEX RGB 或 RGBA
- 3.灰度色阶
- 4.单字符基本颜色
- 5.颜色名称
- 6.使用colormap设置一组颜色
一、matplotlib的绘图样式(style)
matplotlib库提供了四种批量修改全局样式的方式, 而不用对每张图一张张修改
1.matplotlib预先定义样式
- matplotlib提供了许多内置的样式供用户使用,在python脚本的最开始输入想使用style的名称即可调用
import matplotlib as mpl
import matplotlib.pyplot as plt
import numpy as np
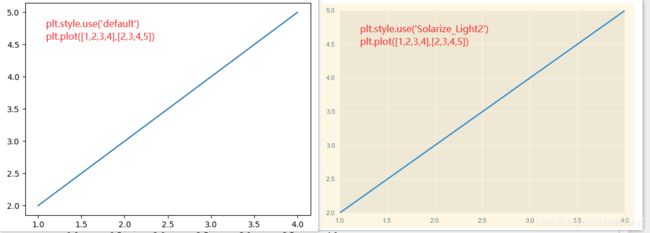
plt.style.use('default')
plt.plot([1,2,3,4],[2,3,4,5])
plt.style.use('Solarize_Light2')
plt.plot([1,2,3,4],[2,3,4,5])
很明显的看出, 两幅图的背景色不一样
- matplotlib总共内置了26种丰富的样式可供选择。
print(plt.style.available)
['Solarize_Light2', '_classic_test_patch', 'bmh', 'classic', 'dark_background', 'fast', 'fivethirtyeight', 'ggplot', 'grayscale', 'seaborn', 'seaborn-bright', 'seaborn-colorblind', 'seaborn-dark', 'seaborn-dark-palette', 'seaborn-darkgrid', 'seaborn-deep', 'seaborn-muted', 'seaborn-notebook', 'seaborn-paper', 'seaborn-pastel', 'seaborn-poster', 'seaborn-talk', 'seaborn-ticks', 'seaborn-white', 'seaborn-whitegrid', 'tableau-colorblind10']
2.用户自定义stylesheet
- 在任意路径下创建一个后缀名为mplstyle的样式清单,编辑文件添加以下样式内容
axes.titlesize : 24
axes.labelsize : 20
lines.linewidth : 3
lines.markersize : 10
xtick.labelsize : 16
ytick.labelsize : 16
- 引用自定义stylesheet
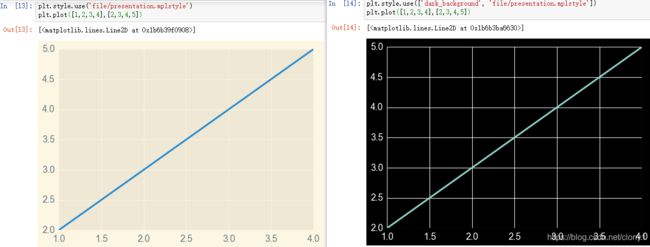
plt.style.use('file/presentation.mplstyle')
plt.plot([1,2,3,4],[2,3,4,5])
plt.style.use(['dark_background', 'file/presentation.mplstyle'])
plt.plot([1,2,3,4],[2,3,4,5])
值得特别注意的是,matplotlib支持混合样式的引用,只需在引用时输入一个样式列表,若是几个样式中涉及到同一个参数,右边的样式表会覆盖左边的值。
3.设置rcparams
- 可以通过修改默认rc设置的方式改变样式,所有rc设置都保存在一个叫做 matplotlib.rcParams的变量中。
之前样式没有修改的图以及修改过后再绘的图,可以看到绘图样式发生了变化。
plt.style.use('default') # 恢复到默认样式
plt.plot([1,2,3,4],[2,3,4,5])

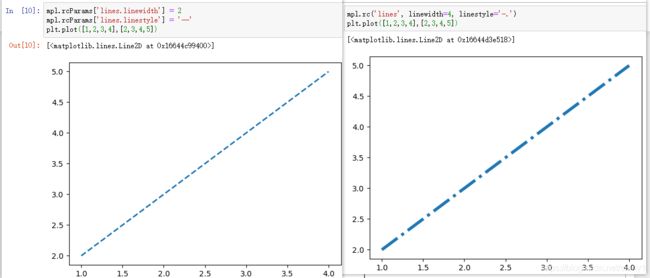
mpl.rcParams['lines.linewidth'] = 2
mpl.rcParams['lines.linestyle'] = '--'
plt.plot([1,2,3,4],[2,3,4,5])
- 另外matplotlib也还提供了了一种更便捷的修改样式方式,可以一次性修改多个样式
mpl.rc('lines', linewidth=4, linestyle='-.')
plt.plot([1,2,3,4],[2,3,4,5])
4.修改matplotlibrc文件
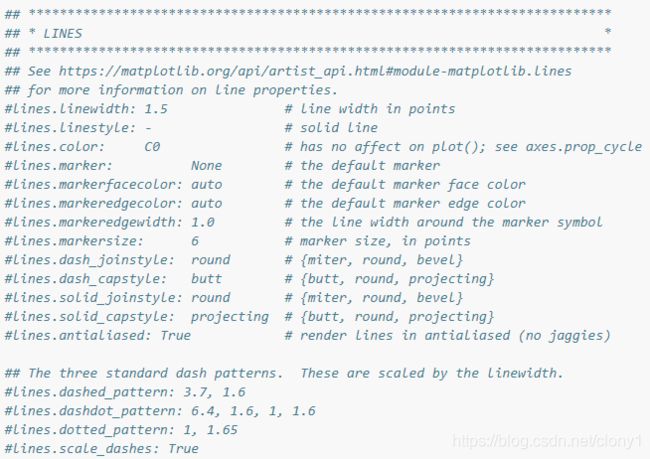
- 由于matplotlib是使用matplotlibrc文件来控制样式的,也就是rc setting,所以我们还可以通过修改matplotlibrc文件的方式改变样式。
# 查找matplotlibrc文件的路径
mpl.matplotlib_fname()  ## 'E:\\Anaconda3\\lib\\site-packages\\matplotlib\\mpl-data\\matplotlibrc'
- 找到路径后,就可以直接编辑样式文件了,打开后看到的文件格式大致是这样的,文件中列举了所有的样式参数,找到想要修改的参数,比如lines.linewidth: 8,并将前面的注释符号去掉,此时再绘图发现样式以及生效了。
二、matplotlib的色彩设置(color)
从可视化编码的角度对颜色进行分析,可以将颜色分为色相、亮度和饱和度三个视觉通道。
通常来说: 色相:没有明显的顺序性、一般不用来表达数据量的高低,而是用来表达数据列的类别。 明度和饱和度:在视觉上很容易区分出优先级的高低、被用作表达顺序或者表达数据量视觉通道。具体关于色彩理论部分的知识, 请参阅有关拓展材料学习。
ECharts数据可视化实验室
学会这6个可视化配色基本技巧,还原数据本身的意义
- 在matplotlib中,设置颜色有以下几种方式:
1.RGB或RGBA
plt.style.use('default')
# 颜色用[0,1]之间的浮点数表示,四个分量按顺序分别为(red, green, blue, alpha),其中alpha透明度可省略
plt.plot([1,2,3],[4,5,6],color=(0.1, 0.2, 0.5))
plt.plot([4,5,6],[1,2,3],color=(0.1, 0.2, 0.5, 0.5))

2.HEX RGB 或 RGBA
# 用十六进制颜色码表示,同样最后两位表示透明度,可省略
plt.plot([1,2,3],[4,5,6],color='#0f0f0f')
plt.plot([4,5,6],[1,2,3],color='#0f0f0f80')

3.灰度色阶
# 当只有一个位于[0,1]的值时,表示灰度色阶
plt.plot([1,2,3],[4,5,6],color='0.5')

4.单字符基本颜色
# matplotlib有八个基本颜色,可以用单字符串来表示,分别是'b', 'g', 'r', 'c', 'm', 'y', 'k', 'w',对应的是blue, green, red, cyan, magenta, yellow, black, and white的英文缩写
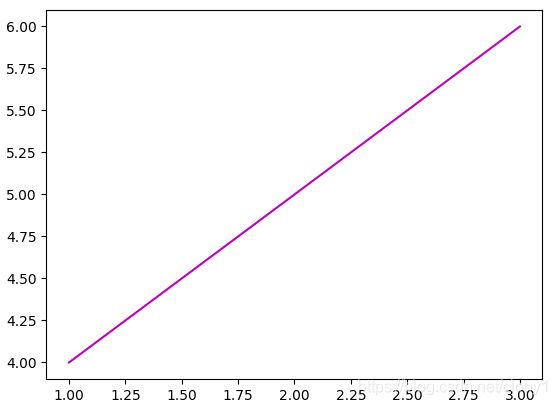
plt.plot([1,2,3],[4,5,6],color='m')
5.颜色名称
# matplotlib提供了颜色对照表,可供查询颜色对应的名称
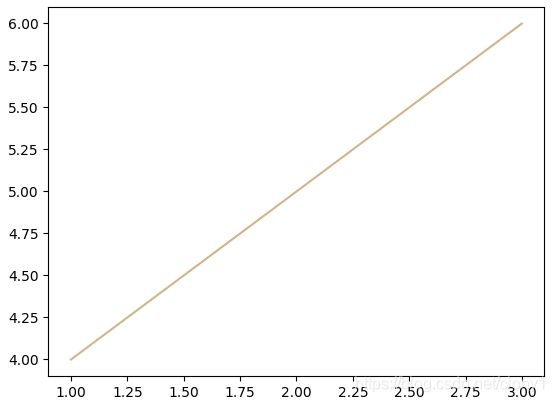
plt.plot([1,2,3],[4,5,6],color='tan')


6.使用colormap设置一组颜色
-
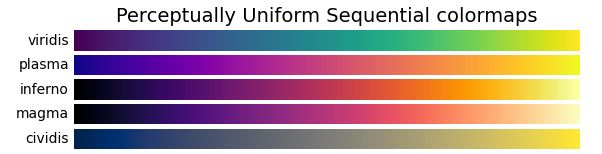
在matplotlib中,colormap共有五种类型:
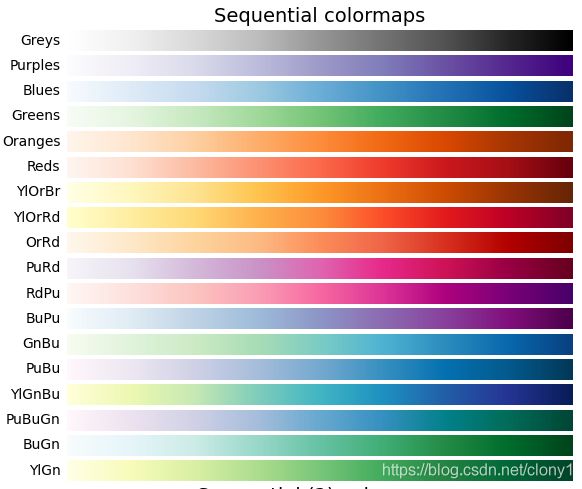
- 顺序(Sequential)。通常使用单一色调,逐渐改变亮度和颜色渐渐增加,用于表示有顺序的信息
- 发散(Diverging)。改变两种不同颜色的亮度和饱和度,这些颜色在中间以不饱和的颜色相遇;当绘制的信息具有关键中间值(例如地形)或数据偏离零时,应使用此值。
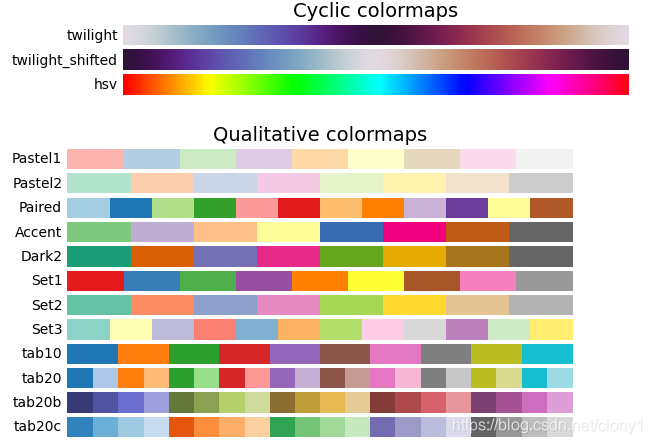
- 循环(Cyclic)。改变两种不同颜色的亮度,在中间和开始/结束时以不饱和的颜色相遇。用于在端点处环绕的值,例如相角,风向或一天中的时间。
- 定性(Qualitative)。常是杂色,用来表示没有排序或关系的信息。
- 杂色(Miscellaneous)。一些在特定场景使用的杂色组合,如彩虹,海洋,地形等。
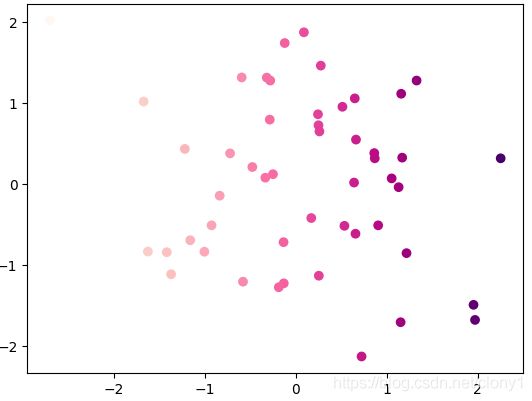
x = np.random.randn(50)
y = np.random.randn(50)
plt.scatter(x,y,c=x,cmap='RdPu')
- 根据matplotlib官网,列举出Sequential,Diverging,Cyclic,Qualitative,Miscellaneous分别有哪些内置的colormap,并以代码绘图的形式展现出来
import numpy as np
import matplotlib.pyplot as plt
cmaps = [('Perceptually Uniform Sequential', [
'viridis', 'plasma', 'inferno', 'magma', 'cividis']),
('Sequential', [
'Greys', 'Purples', 'Blues', 'Greens', 'Oranges', 'Reds',
'YlOrBr', 'YlOrRd', 'OrRd', 'PuRd', 'RdPu', 'BuPu',
'GnBu', 'PuBu', 'YlGnBu', 'PuBuGn', 'BuGn', 'YlGn']),
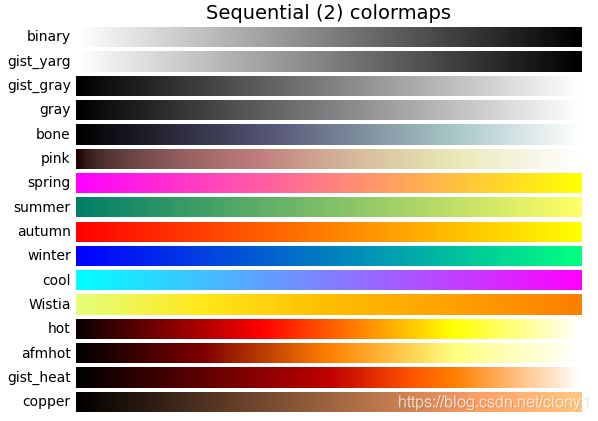
('Sequential (2)', [
'binary', 'gist_yarg', 'gist_gray', 'gray', 'bone', 'pink',
'spring', 'summer', 'autumn', 'winter', 'cool', 'Wistia',
'hot', 'afmhot', 'gist_heat', 'copper']),
('Diverging', [
'PiYG', 'PRGn', 'BrBG', 'PuOr', 'RdGy', 'RdBu',
'RdYlBu', 'RdYlGn', 'Spectral', 'coolwarm', 'bwr', 'seismic']),
('Cyclic', ['twilight', 'twilight_shifted', 'hsv']),
('Qualitative', [
'Pastel1', 'Pastel2', 'Paired', 'Accent',
'Dark2', 'Set1', 'Set2', 'Set3',
'tab10', 'tab20', 'tab20b', 'tab20c']),
('Miscellaneous', [
'flag', 'prism', 'ocean', 'gist_earth', 'terrain', 'gist_stern',
'gnuplot', 'gnuplot2', 'CMRmap', 'cubehelix', 'brg',
'gist_rainbow', 'rainbow', 'jet', 'turbo', 'nipy_spectral',
'gist_ncar'])]
gradient = np.linspace(0, 1, 256)
gradient = np.vstack((gradient, gradient))
def plot_color_gradients(cmap_category, cmap_list):
# Create figure and adjust figure height to number of colormaps
nrows = len(cmap_list)
figh = 0.35 + 0.15 + (nrows + (nrows-1)*0.1)*0.22
fig, axs = plt.subplots(nrows=nrows, figsize=(6.4, figh))
fig.subplots_adjust(top=1-.35/figh, bottom=.15/figh, left=0.2, right=0.99)
axs[0].set_title(cmap_category + ' colormaps', fontsize=14)
for ax, name in zip(axs, cmap_list):
ax.imshow(gradient, aspect='auto', cmap=plt.get_cmap(name))
ax.text(-.01, .5, name, va='center', ha='right', fontsize=10,
transform=ax.transAxes)
# Turn off *all* ticks & spines, not just the ones with colormaps.
for ax in axs:
ax.set_axis_off()
for cmap_category, cmap_list in cmaps:
plot_color_gradients(cmap_category, cmap_list)
plt.show()


参考:
https://matplotlib.org/tutorials/colors/colormaps.html