Covid19, Analysis, Visualization, Prediction
Covid19, Analysis, Visualization, Prediction
Author: ZhuoFei, Zhou
Date: 2020/10/5
Introduction
Covid-19
Novel Coronavirus 2019, on 12 January 2020, WHO officially named it 2019-NCOV. Coronaviruses are a large family of viruses known to cause colds and more serious illnesses such as Middle East Respiratory syndrome (MERS) and severe acute respiratory syndrome (SARS). Novel Coronavirus is a novel coronavirus strain that has never been found in humans before. More information is available.百度百科
data
Data from COVID-19 Data Repository by the Center for Systems Science and Engineering (CSSE) at Johns Hopkins University.link
-
time series covid19 confirmed global.csv.(github link).
-
time series covid19 deaths global.csv.(github link)
-
time serise covid19 recoverd global.csv(github link)
-
cases contry.csv.(github link)
-
cases time.csv. (github link)
download here:
- “time_series_covid19_confirmed_global.csv”
- “time_series_covid19_deaths_global.csv”
- “time_series_covid19_recovered_global.csv”
- “cases_country.csv”
- “cases_time.csv”
import some julia packages.
using DataFrames
using CSV
using DelimitedFiles
using BenchmarkTools
using Queryverse
using Dates
using Plots
pgfplotsx()

using Flux
using Flux: @epochs
using IterTools: ncycle
using Parameters: @with_kw
Analysis
read Global data, and Data-operate
#read data:
dt, Header = readdlm("time_series_covid19_confirmed_global.csv", ',', header=true)
dt_deaths, Header_deaths = readdlm("time_series_covid19_deaths_global.csv", ',', header=true)
dt_recover,Header_recov = readdlm("time_series_covid19_recovered_global.csv",',',header=true)
creat a new dataframe to store data
confirmed_num = []
deaths_num = []
recovered_num = []
for i in 5:259
	push!(confirmed_num, sum(dt[:, i]))
	push!(deaths_num, sum(dt_deaths[:, i]))
	push!(recovered_num, sum(dt_recover[:,i]))
end
dates = Date(2020, 1, 22):Day(1):Date(2020, 10, 2)
Global_num = DataFrame(Date=dates, confirmed_num=confirmed_num, deaths_num=deaths_num, recovered_num=recovered_num)

n, = size(confirmed_num)
new_confirmed = []
new_death = []
new_recovered = []
death_rate = deaths_num ./ confirmed_num
recover_rate = recovered_num ./ confirmed_num
for i in 2:n
	push!(new_confirmed, confirmed_num[i]-confirmed_num[i-1])
	push!(new_death, deaths_num[i] - deaths_num[i-1])
	push!(new_recovered, recovered_num[i]-recovered_num[i-1])
end
Global_num.death_rate = death_rate
Global_num.recover_rate = recover_rate
head(Global_num)
| Date | comfirmed_num | deaths_num | recovered_num | death_rate | recover_rate |
|---|---|---|---|---|---|
| 2020-01-22 | 555 | 17 | 28 | 0.0306306 | 0.0504505 |
| 2020-01-23 | 654 | 18 | 30 | 0.0275229 | 0.0458716 |
| 2020-01-24 | 941 | 26 | 36 | 0.0276302 | 0.0382572 |
| 2020-01-25 | 1434 | 42 | 39 | 0.0292887 | 0.0271967 |
| 2020-01-26 | 2118 | 56 | 52 | 0.02644 | 0.0245515 |
| 2020-01-27 | 2927 | 82 | 61 | 0.028015 | 0.0208405 |
Plots
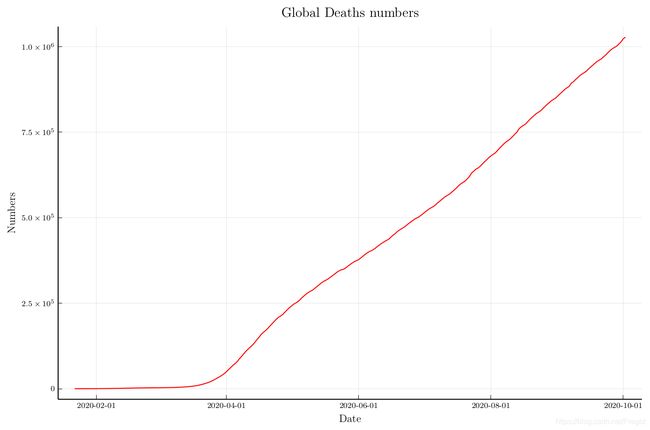
Then I plot the number of confirmed cases and deaths cases over time.
As we can see, the number of confirmed cases continues to increase exponentially. But the number of deaths cases seems to increase linearly.
p1 = plot(dates, confirmed_num,
	legend=:none, ylabel="Numbers", xlabel="Date",
	title="Global comfirmed numbers", size=(900,600))

p2 = plot(dates, deaths_num,
    legend=:none, linecolor=:red, ylabel="Numbers", xlabel="Date",
    title="Global Deaths numbers",
    size=(900,600))
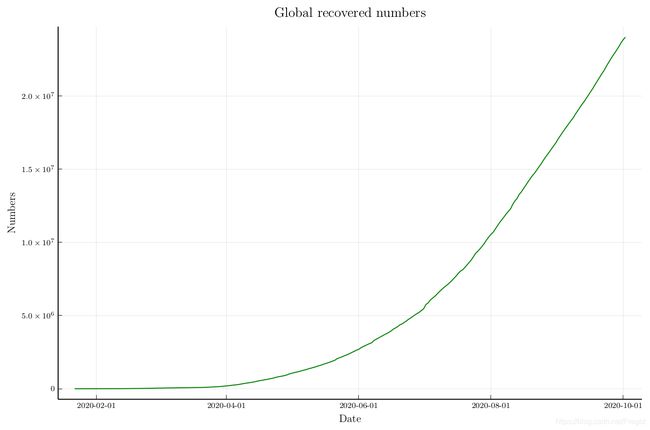
p_re = plot(dates, recovered_num,
    legend=:none, linecolor=:green, ylabel="Numbers", xlabel="Date",
    title="Global recovered numbers",
    size=(900, 600))
p3 = plot(dates, [confirmed_num deaths_num recovered_num],
    label=["Confirmed" "Deaths" "recovered"], legend=:topleft)
l = @layout([a [b;c;d]])
plot(p3, p1, p2, p_re,
    layout=l,xticks = [Date(2020, 1, 22), Date(2020,10,2)],size=(900,600),
    ylabel="Numbers", xlabel="Date", titlefontsize=10, xaxis=(font(8)))

Here show the new case
p5 = plot(Date(2020, 1, 23):Day(1):Date(2020, 10, 2),new_confirmed,
	shape=:circle,
    legend=:topleft, label="new case",
    xlabel="Date", ylabel="Numbers", title="new cases every day", size=(900, 600))

New death case
p6 = plot(Date(2020,1,23):Day(1):Date(2020,10,2), new_death, shape=:circle,
    linecolor=:red, legend=:topleft,
    label="new death", xlabel="Date", ylabel="Numbers", title="New death every day", size=(900, 600))

New recovered
p7 = plot(Date(2020,1,23):Day(1):Date(2020,10,2), new_recovered, shape=:circle,
    linecolor=:green, legend=:topleft,
    label="new recovered", xlabel="Date", ylabel="Numbers", title="New recoverd every day", size=(900, 600))

Max death rate:
Global_num[Global_num.death_rate .== maximum(Global_num.death_rate), :]
| Date | comfirmed_num | deaths_num | recovered_num | death_rate | recover_rate |
|---|---|---|---|---|---|
| 2020-04-29 | 3190735 | 230657 | 948318 | 0.0722896 | 0.29721 |
plot(Date(2020, 1, 22):Day(1):Date(2020, 10, 2),death_rate,
    linecolor=:red, title="Death rate", xlabel="date", ylabel="Numbers", legend=:none, ylims=(0,0.08), size=(900, 600))
plot!([Date(2020,1,22),Date(2020,4,29),Date(2020,4,29)], [maximum(Global_num.death_rate),maximum(Global_num.death_rate), 0],
    line=:dot, linecolor=:black, annotations=[(Date(2020,4,29), 0.075, text("max death rate: 0.0723", 10))])

recover and death
plot(Date(2020, 1, 22):Day(1):Date(2020, 10, 2),[death_rate recover_rate],
    xlabel="date", ylabel="Numbers", legend=:outerright, linecolor=[:red :green],
    title="death rate and recover rate", label=["death" "recover"], size=(900, 600))
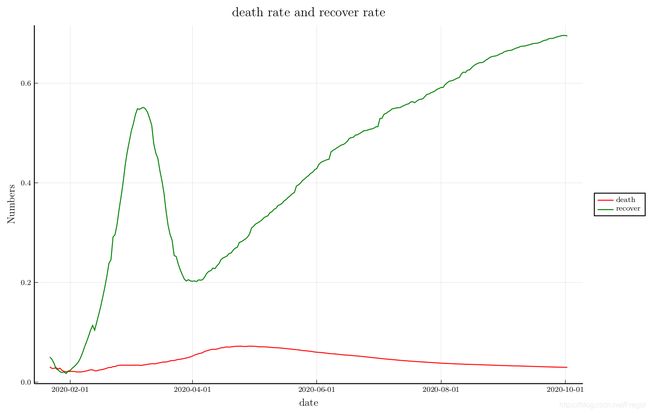
the maximum death rate in 2020-4-29
So, the new confirmed cases continues to rise, the death rate is already falling.
Prediction
Global Trend
It is useful to understand the global trend of an increase in the number of cases over time. There is always a pattern in any data, but the concern is how strongly data follows a pattern. COVID-19 spreads exponentially.
i think of some ways to estimate the curve:
Numerical Analysis- linear regression, after transmission
- Neural Network
So, we focus on comfirmed case:
scatter(sqrt.(Global_num.confirmed_num))
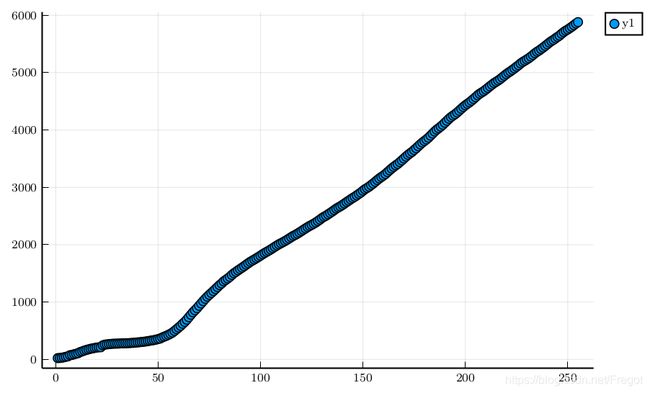
when I use y ′ = y y' = \sqrt{y} y′=y to transition. maybe will get a linea function.
#transition
x = 0:n-1
y = Global_num.confirmed_num
y₁ = sqrt.(y)
X = [x ones(n)]
β = inv(X'*X)*X'*y₁
ŷ = (X*β).^2
plot(dates,Global_num.confirmed_num, label="real", size=(900, 600))
plot!(dates, ŷ, label="predict")

using Neural network to fit the curve.
#Leak relu
Lelu(x, α=100) = (x ≥ 0 ? x : x/α)
#preper data
train_data = Flux.Data.DataLoader((Array(x), Float64.(y)), batchsize=1)

#define model,
m = Chain(
    Dense(1,40,Lelu),
    Dense(40, 40, Lelu),
    Dense(40, 40, Lelu),
    Dense(40,1,Lelu))
#define loss function
loss(x, y) = Flux.mse(m(x), y)
#params
ps = Flux.params(m)
#opti
opt=ADAM(0.001)
#train
Flux.train!(loss, ps, ncycle(train_data, 1000), opt)
flux_y = []
for i in Array(x)
    push!(flux_y, Array(m([i]))[1])
end
flux_y = Float64.(flux_y);
# ncycle(train_data, Args().repeat)

plot(dates, [flux_y Float64.(y)], label=["predict" "real"], xlabel="date", ylabel="Numbers", size=(900, 600))

show all code:
using Flux, Statistics
using Flux.Data: DataLoader
using Flux: throttle
using Parameters: @with_kw
using DelimitedFiles
using IterTools: ncycle
using Dates
using DataFrames
using CSV
using Plots


@with_kw mutable struct Args
    η::Float64 = 0.001
    batchsize::Int = 1
    epochs::Int = 1000
end
cd(@__DIR__)
pwd()
#read data:
dt, Header = readdlm("time_series_covid19_confirmed_global.csv", ',', header=true)
dt_deaths, Header_deaths = readdlm("time_series_covid19_deaths_global.csv", ',', header=true)
dt_recover,Header_recov = readdlm("time_series_covid19_recovered_global.csv",',',header=true)


#create a new datafram to store datum
confirmed_num = []
deaths_num = []
recovered_num = []
for i in 5:259
    push!(confirmed_num, sum(dt[:, i]))
    push!(deaths_num, sum(dt_deaths[:, i]))
    push!(recovered_num, sum(dt_recover[:,i]))
end
dates = Date(2020, 1, 22):Day(1):Date(2020, 10, 2)
Global_num = DataFrame(Date=dates,
    confirmed_num=confirmed_num,
    deaths_num=deaths_num,
    recovered_num=recovered_num)

#read train_data
n, = size(confirmed_num)
x = 0:n-1
y = Global_num.confirmed_num
args = Args()
train_data = DataLoader((Array(x), Float64.(y)), batchsize=args.batchsize)

# define leaky relu
Lelu(x, α=100) = (x ≥ 0 ? x : x/α)

#define Model
m = Chain(
    Dense(1, 40, Lelu),
    Dense(40, 40, Lelu),
    Dense(40, 40, Lelu),
    Dense(40, 1, Lelu)
)

#define loss function
loss(x, y) = Flux.mse(m(x), y)

#define parameters
ps = Flux.params(m)

#define Opt
opt = ADAM(args.η)

#train model
Flux.train!(loss, ps, ncycle(train_data, args.epochs), opt)

#visualize
flux_y = []
for i in Array(x)
    push!(flux_y, Array(m([i]))[1])
end
flux_y = Float64.(flux_y)
plot(dates, [flux_y Float64.(y)],
    label=["predict" "real"], xlabel="date", ylabel="Numbers", size=(900, 600))
write a function to predict the curve:
#write a function
function predict_curve(x, y, η::Float64=0.001, epochs::Int=1000, batchsize::Int=1)
    dates = Date(2020, 1, 22):Day(1):Date(2020, 10, 2)
    train_data = Flux.Data.DataLoader((x, y), batchsize=batchsize)
    Lelu(x, α=100) = (x ≥ 0 ? x : x/α)
    m = Chain(
    Dense(1, 40, Lelu),
    Dense(40, 40, Lelu),
    Dense(40, 40, Lelu),
    Dense(40, 1, Lelu))
    loss(x, y) = Flux.mse(m(x), y)
    ps = Flux.params(m)
    opt = ADAM(η)
    Flux.train!(loss, ps, ncycle(train_data, epochs), opt)
    flux_y = []
    for i in Array(x)
        push!(flux_y, Array(m([i]))[1])
    end
    plot(dates, [Float64.(flux_y) Float64.(y)],label=["predict" "real"], xlabel="date", ylabel="Numbers", size=(900, 600), legend=:topleft)
end
predict_curve(Array(0:254), Float64.(Global_num.deaths_num))

predict_curve(Array(0:254), Float64.(Global_num.recovered_num))
