机器学习线性回归实践,波士顿房价预测,手写梯度下降
波士顿房价预测,手写梯度下降,python实现
数据集介绍
每条数据包含房屋以及房屋周围的详细信息。其中包含城镇犯罪率,一氧化氮浓度,住宅平均房间数,到中心区域的加权距离以及自住房平均房价等等。
CRIM:城镇人均犯罪率。
ZN:住宅用地超过 25000 sq.ft. 的比例。
INDUS:城镇非零售商用土地的比例。
CHAS:查理斯河空变量(如果边界是河流,则为1;否则为0)。
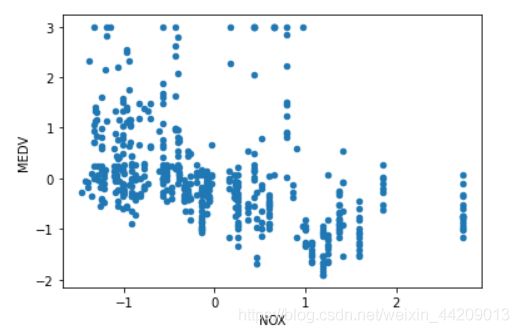
NOX:一氧化氮浓度。
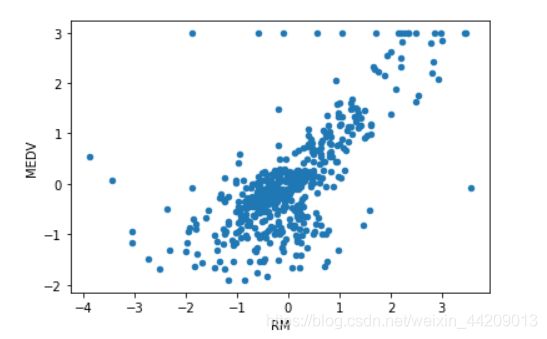
RM:住宅平均房间数。
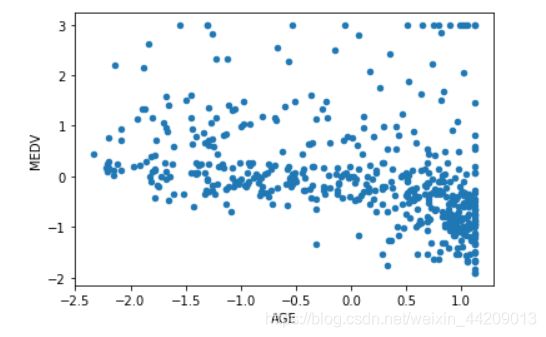
AGE:1940 年之前建成的自用房屋比例。
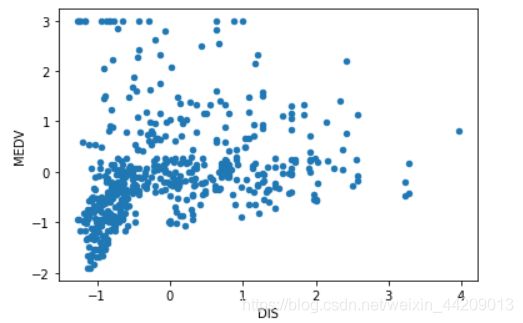
DIS:到波士顿五个中心区域的加权距离。
RAD:辐射性公路的接近指数。
TAX:每 10000 美元的全值财产税率。
PTRATIO:城镇师生比例。
B:1000(Bk-0.63)^ 2,其中 Bk 指代城镇中黑人的比例。
LSTAT:人口中地位低下者的比例。
MEDV:自住房的平均房价,以千美元计。
预测平均值的基准性能的均方根误差(RMSE)是约 9.21 千美元。
代码
# 导入数据处理库
import numpy as np
import pandas as pd
from matplotlib import font_manager as fm, rcParams
import matplotlib.pyplot as plt
from sklearn.model_selection import train_test_split
from sklearn import datasets
数据处理
# 导入数据
path = '../Data/housing.csv'
data = pd.read_csv(path)
# 特征缩放 (x-平均值)/标准差
data = (data - data.mean())/data.std()
# 查看特征缩放后的数据
data.head(10)
# 绘制数据散点图
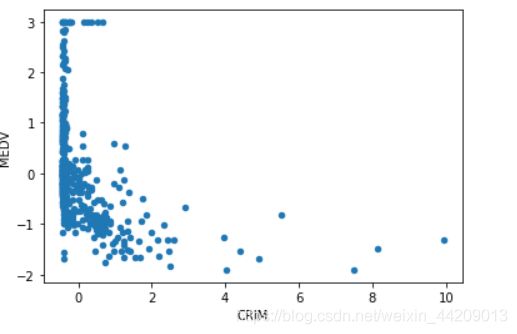
data.plot(kind = 'scatter', x = 'CRIM', y = 'MEDV')
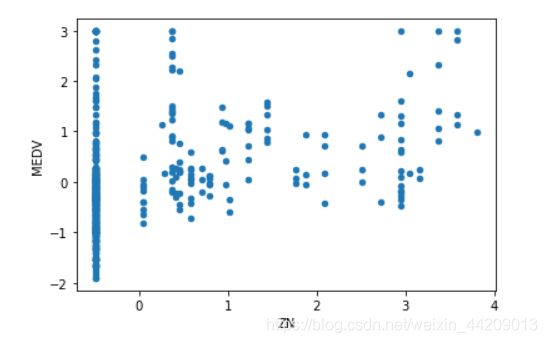
data.plot(kind = 'scatter', x = 'ZN', y = 'MEDV')
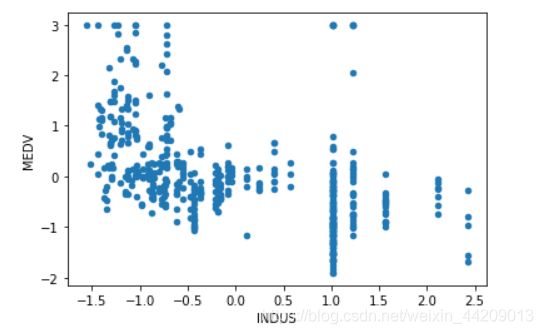
data.plot(kind = 'scatter', x = 'INDUS', y = 'MEDV')
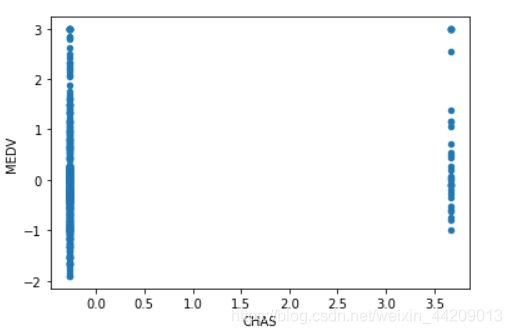
data.plot(kind = 'scatter', x = 'CHAS', y = 'MEDV')
data.plot(kind = 'scatter', x = 'NOX', y = 'MEDV')
data.plot(kind = 'scatter', x = 'RM', y = 'MEDV')
data.plot(kind = 'scatter', x = 'AGE', y = 'MEDV')
data.plot(kind = 'scatter', x = 'DIS', y = 'MEDV')
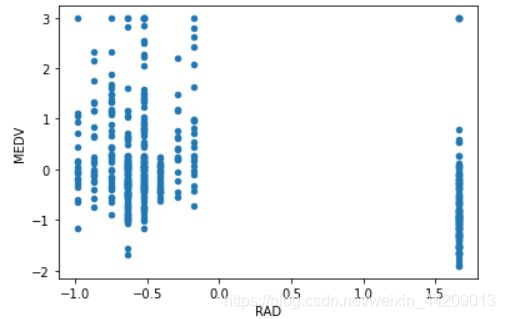
data.plot(kind = 'scatter', x = 'RAD', y = 'MEDV')
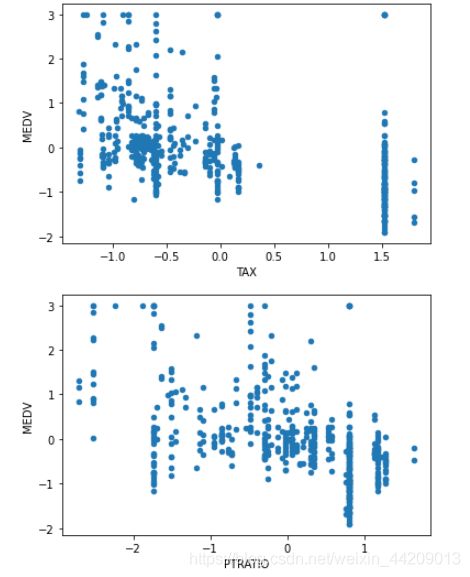
data.plot(kind = 'scatter', x = 'TAX', y = 'MEDV')
data.plot(kind = 'scatter', x = 'PTRATIO', y = 'MEDV')
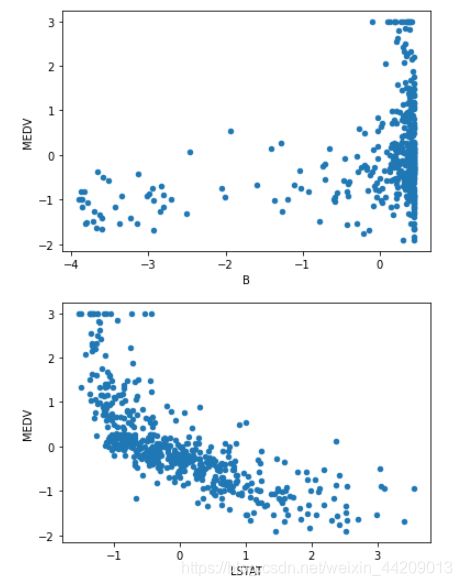
data.plot(kind = 'scatter', x = 'B', y = 'MEDV')
data.plot(kind = 'scatter', x = 'LSTAT', y = 'MEDV')
# 变量初始化
# 最后一列为y,其余为x
cols = data.shape[1] #列数 shape[0]行数 [1]列数
X = data.iloc[:,0:cols-1]       #取前cols-1列,即输入向量
y = data.iloc[:,cols-1:cols]    #取最后一列,即目标变量
X.head(10)
# 划分训练集和测试集
X_train,X_test,y_train,y_test = train_test_split(X,y,test_size=0.2)
# 将数据转换成numpy矩阵
X_train = np.matrix(X_train.values)
y_train = np.matrix(y_train.values)
X_test = np.matrix(X_test.values)
y_test = np.matrix(y_test.values)
# 初始化theta矩阵
theta = np.matrix([0,0,0,0,0,0,0,0,0,0,0,0,0,0])
X_train.shape,X_test.shape,y_train.shape,y_test.shape
((404, 13), (102, 13), (404, 1), (102, 1))
#添加偏置列,值为1,axis = 1 添加列
X_train = np.insert(X_train, 0, 1, axis=1)
X_test = np.insert(X_test,0,1,axis=1)
X_train.shape,X_test.shape,y_train.shape,y_test.shape
((404, 14), (102, 14), (404, 1), (102, 1))
# 代价函数
def CostFunction(X,y,theta):
    inner = np.power(X*theta.T-y, 2)
    return np.sum(inner)/(2*len(X))
# 正则化代价函数
def regularizedcost(X,y,theta,l):
    reg = (l/(2*len(X)))*(np.power(theta, 2).sum())
    return CostFunction(X,y,theta) + reg
# 梯度下降
def GradientDescent(X,y,theta,l,alpha,epoch):
    temp = np.matrix(np.zeros(np.shape(theta)))   # 定义临时矩阵存储tehta
    parameters = int(theta.flatten().shape[1])    # 参数 θ的数量
    cost = np.zeros(epoch)  # 初始化一个ndarray,包含每次epoch的cost
    m = X.shape[0]  # 样本数量m
    for i in range(epoch):
        # 利用向量化一步求解
        temp = theta - (alpha / m) * (X * theta.T - y).T * X - (alpha*l/m)*theta     # 添加了正则项
        theta = temp
        cost[i] = regularizedcost(X, y, theta, l)      # 记录每次迭代后的代价函数值

    return theta,cost
alpha = 0.01  #学习速率
epoch = 1000  #迭代步数
l = 50      #正则化参数
#运行梯度下降算法 并得出最终拟合的theta值 代价函数J(theta)
final_theta, cost = GradientDescent(X_train, y_train, theta, l, alpha, epoch)
print(final_theta)
[[-0.00034606 -0.07371485  0.08904682 -0.03193276  0.08014694 -0.12466428
   0.30912387 -0.02968011 -0.20608371  0.08534093 -0.07778207 -0.20041093
   0.07235449 -0.31268358]]
# 模型评估
y_hat_train = X_train * final_theta.T
y_hat_test = X_test * final_theta.T
mse = np.sum(np.power(y_hat_test-y_test,2))/(len(X_test))
rmse = np.sqrt(mse)
R2_train = 1 - np.sum(np.power(y_hat_train - y_train,2))/np.sum(np.power(np.mean(y_train) - y_train,2))
R2_test = 1 - np.sum(np.power(y_hat_test - y_test,2))/np.sum(np.power(np.mean(y_test) - y_test,2))
print('MSE = ', mse)
print('RMSE = ', rmse)
print('R2_train = ', R2_train)
print('R2_test = ', R2_test)
MSE =  0.3466540768960382
RMSE =  0.5887733663270089
R2_train =  0.738744369506042
R2_test =  0.6644595541385632
# 绘制迭代曲线
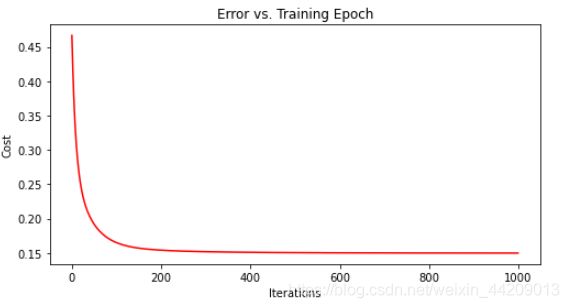
fig, ax = plt.subplots(figsize=(8,4))
ax.plot(np.arange(epoch), cost, 'r')  # np.arange()返回等差数组
ax.set_xlabel('Iterations')
ax.set_ylabel('Cost')
ax.set_title('Error vs. Training Epoch')
plt.show()
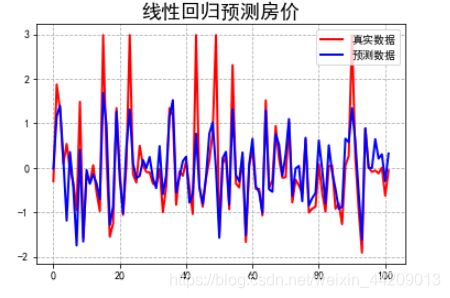
# 图例展示预测值与真实值的变化趋势
plt.rcParams['font.sans-serif']=['SimHei'] #显示中文标签
plt.rcParams['axes.unicode_minus']=False
plt.figure(facecolor='w')
t = np.arange(len(X_test))  #创建等差数组
plt.plot(t, y_test, 'r-', linewidth=2, label=u'真实数据')
plt.plot(t, y_hat_test, 'b-', linewidth=2, label=u'预测数据')
plt.legend(loc='upper right')
plt.title(u'线性回归预测房价', fontsize=18)
plt.grid(b=True, linestyle='--')

