matplotlib动态绘制图形
matplotlib动态绘制图形
这次尝试用matplotlib来描述出0-1分布的直方图分布情况,在网上查阅了许多资料,达到的效果也不是很满意,最终找到了一份比较满意的代码实现了效果,以下为0-1分布分布的可视化代码:
import matplotlib.pyplot as plt
import math
import random

fig, ax = plt.subplots()
ones_count=0
zeros_count=0
y=[]

def Work():
    global ones_count,zeros_count
    x=math.ceil(2*random.random())-1
    if(x):
        ones_count+=1
    else:
        zeros_count+=1
    y.append(x)

def Plot():
    global ones_count,zeros_count
    ax.cla()  # 清除键,清除所有的数值
    ax.hist(y,bins = [-0.5,0.5,1.5])  #直方图
    plt.ylabel('次数',fontproperties='simhei')
    plt.title('0,1出现次数',fontproperties='simhei')

    rate_0=zeros_count/(zeros_count+ones_count)     #0,1分别占总数的百分比
    rate_1=ones_count/(ones_count+zeros_count)
    str_0=str(zeros_count)+'('+str(round((rate_0*100),3))+'%)'
    str_1=str(ones_count)+'('+str(round((rate_1*100),3))+'%)'
    plt.text(-0.2,zeros_count,str_0)
    plt.text(0.8,ones_count,str_1)

    plt.xticks([-0.5,0.5,1.5]) #x轴坐标点显示(坐标点区域)
    plt.xlim((-2,3))           #x轴显示区域(视图区域)
    ax.legend()      #图例
    plt.pause(0.0001)

def main():
    for i in range(10000):
        Work()#数据生成
        Plot()#绘图


main() #主函数入口
下一个代码为两条曲线动态叠加:
import numpy as np
import matplotlib.pyplot as plt

x = np.arange(0, 2 * np.pi, 0.1)
y1 = np.sin(x)
y2 = np.cos(x)

plt.figure(1)
plt.plot(x, y1)
plt.pause(2)  #在figure(1)上绘制sin曲线,2s后自动关闭窗口

plt.figure(1)  #plt.figure(2)会使cos图像在figure2中显示
plt.cla()
plt.plot(x, y2)
plt.pause(2)  #在figure(1)上绘制cos曲线,2s后自动关闭窗口
#plt.show()
plt.close()
通过修改figure中的值来使图像在第几个窗口显示。
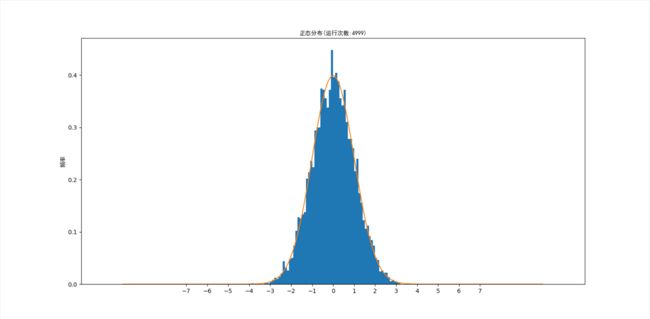
正态分布频率图以及正态分布函数:
import matplotlib.pyplot as plt
import numpy as np
import math

y=[]

def Work():
    x=np.random.randn()
    y.append(x)

def Plot(i):
    plt.figure(1)
    plt.cla()  # 清除键,清除所有的数值
    plt.hist(y,bins = np.arange(-10,10,0.1),density = True)  #直方图  density=True时为为频率直方图
    plt.ylabel('频率',fontproperties='simhei')
    plt.title('正态分布(运行次数:'+str(i)+')',fontproperties='simhei')
    plt.xticks([-7,-6,-5,-4,-3,-2,-1,0,1,2,3,4,5,6,7]) #x轴坐标点显示(坐标点区域)
    plt.xlim((-12,12))           #x轴显示区域(视图区域)
    plt.pause(0.00001)

def Y(x): #正态分布函数
    return (1/((2*math.pi)**0.5))*math.exp((-1*x*x/2))

def main():
    for i in range(5000):
        Work()#数据生成
        Plot(i)#绘图
    x=np.arange(-10,10,0.01)
    y1=list(map(Y,x))
    plt.figure(1)
    plt.plot(x,y1)  #绘制正态分布曲线
    plt.show()

main() #主函数入口
运行5000次结果:
使图像显示不一定使用show函数,show函数会一直打开绘图窗口,需要手动关闭,要使绘图窗口自行关闭只需使用pause函数,pause(1)使图像显示1s后自动关闭,不需使用show()函数。
