OpenCV笔记之七——图像直方图
七、直方图
【本文中所有源代码均来自 Practical Python and OpenCV, 3rd Edition 的随书代码】
直方图能直观地将像素强度的分布(彩色或灰度)可视化并表现为一张图表的形式。在图像处理中,直方图均衡化是一种用于改善图像效果质量的很重要的手段。
在绘制直方图时,我们通常需要在x轴确定仓(bin)数,而在y轴统计落入每个仓中的像素数。直方图仓又称灰度等级再分,它的数目决定了我们将亮度的明暗程度划分为几个等级。若定义一个256 bins的直方图,则可以统计每个像素值出现的次数。若采用一个2 bins的直方图,那么我们可以得到像素分别落在 [0, 128) 或 [128, 255] 区间内的次数。
通过查看一幅图像的直方图,我们可以大致获得图像的对比度、亮度及像素的强度分布等信息。
通过调用API,我们可以采用cv2.calcHist函数来绘制图像的直方图。对此,我们简单介绍该函数的一些参数。
images:想要为其计算直方图的图像。
channels:所选图像的通道索引,以列表表示。当计算灰度图的直方图时,列表应为[0];当计算一张包含红、绿、蓝三个通道的彩色图像的直方图时,列表应为[0, 1, 2]。
mask:若对图像应用掩膜,则仅计算掩膜像素的直方图。对于无掩膜图像,该参数设为 None。
histSize:计算直方图使用的仓数。各个通道设置的bins大小可以不同。例如,可以为三通道彩色图像设置histSize为[16, 16, 32]。
ranges:设定可能像素值的范围。在RGB颜色空间中,通常为每个通道设置为[0, 256]。
1、绘制灰度直方图
a.源代码呈现
grayscale_histogram.py
# Import the necessary packages
from matplotlib import pyplot as plt
import argparse
import cv2

# Construct the argument parser and parse the arguments
ap = argparse.ArgumentParser()
ap.add_argument("-i", "--image", required = True,
	help = "Path to the image")
args = vars(ap.parse_args())

# Load the image, convert it to grayscale, and show it
image = cv2.imread(args["image"])
image = cv2.cvtColor(image, cv2.COLOR_BGR2GRAY)
cv2.imshow("Original", image)

# Construct a grayscale histogram
hist = cv2.calcHist([image], [0], None, [256], [0, 256])

# Plot the histogram
plt.figure()
plt.title("Grayscale Histogram")
plt.xlabel("Bins")
plt.ylabel("# of Pixels")
plt.plot(hist)
plt.xlim([0, 256])
plt.show()
cv2.waitKey(0)
b.代码分析
Line 1-13
导入必要的宏包,设置一个argument parser,载入图像。
Line 14-18
将RGB图像转化为灰度图,随后计算其直方图。
从calcHist函数的第一个参数可以看出,进行计算直方图的图像是转化后的灰度图;由于灰度图只有单通道,因此第二个参数设置为[0];在此我们不考虑对图像应用掩膜,因此第三个参数设置为None;设置直方图bins数为256,以统计每个像素值出现的次数;在8位灰度图像中,像素值的可能范围为[0, 256]。
Line 20-28
借助matplolib.pyplot绘制该灰度图的直方图,添加标题与x、y轴标注,并设置x轴的组距。
c.运行结果
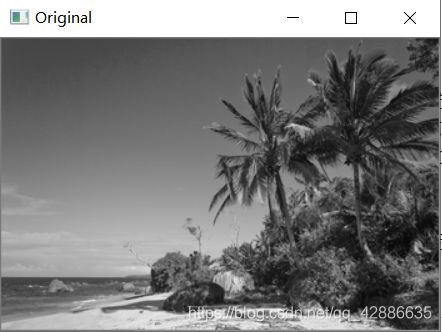 |
 |
|---|---|
| original | grayscale histogram |
从直方图可以看出,图像中像素值大多数集中在60-120之间,而在200-255区间的像素点较少,这说明灰度图中几乎不存在白色的像素点。
那如果我们同时想获知超过一个频道的像素值该如何做呢?例如:统计像素值在蓝色通道为50而在红色通道为100的像素点数。此时需要构建一张多维的直方图。
2、绘制彩色直方图
a.源代码呈现
color_histograms.py
# Import the necessary packages
from __future__ import print_function
from matplotlib import pyplot as plt
import numpy as np
import argparse
import cv2

# Construct the argument parser and parse the arguments
ap = argparse.ArgumentParser()
ap.add_argument("-i", "--image", required = True,
	help = "Path to the image")
args = vars(ap.parse_args())

# Load the image and show it
image = cv2.imread(args["image"])
cv2.imshow("Original", image)

# Grab the image channels, initialize the tuple of colors and the figure
chans = cv2.split(image)
colors = ("b", "g", "r")
plt.figure()
plt.title("'Flattened' Color Histogram")
plt.xlabel("Bins")
plt.ylabel("# of Pixels")

# Loop over the image channels
for (chan, color) in zip(chans, colors):
	# Create a histogram for the current channel and plot it
	hist = cv2.calcHist([chan], [0], None, [256], [0, 256])
	plt.plot(hist, color = color)
	plt.xlim([0, 256])

# Let's move on to 2D histograms -- I am reducing the number of bins in the histogram
# from 256 to 32 so we can better visualize the results
fig = plt.figure()

# Plot a 2D color histogram for green and blue
ax = fig.add_subplot(131)
hist = cv2.calcHist([chans[1], chans[0]], [0, 1], None, [32, 32], [0, 256, 0, 256])
p = ax.imshow(hist, interpolation = "nearest")
ax.set_title("2D Color Histogram for G and B")
plt.colorbar(p)

# Plot a 2D color histogram for green and red
ax = fig.add_subplot(132)
hist = cv2.calcHist([chans[1], chans[2]], [0, 1], None,	[32, 32], [0, 256, 0, 256])
p = ax.imshow(hist, interpolation = "nearest")
ax.set_title("2D Color Histogram for G and R")
plt.colorbar(p)

# Plot a 2D color histogram for blue and red
ax = fig.add_subplot(133)
hist = cv2.calcHist([chans[0], chans[2]], [0, 1], None,	[32, 32], [0, 256, 0, 256])
p = ax.imshow(hist, interpolation = "nearest")
ax.set_title("2D Color Histogram for B and R")
plt.colorbar(p)

# Finally, let's examine the dimensionality of one of the 2D histograms
print("2D histogram shape: {}, with {} values".format(hist.shape, hist.flatten().shape[0]))

# Our 2D histogram could only take into account 2 out of the 3 channels in the image so now let's build a
# 3D color histogram (utilizing all channels) with 8 bins in each direction -- we can't plot the 3D histogram,
# but the theory is exactly like that of a 2D histogram, so we'll just show the shape of the histogram
hist = cv2.calcHist([image], [0, 1, 2],	None, [8, 8, 8], [0, 256, 0, 256, 0, 256])
print("3D histogram shape: {}, with {} values".format(hist.shape, hist.flatten().shape[0]))

# Show our plots
plt.show()
b.代码分析
单通道直方图
Line 1-16
导入必要的宏包,设置一个argument parser,载入图像并显示。
Line 18-31
拆分图像通道,并以元组的形式存储;并将蓝、绿、红添加到colors元组中。
借助python的zip( )函数对依次将颜色通道与其对应的颜色打包成三组(chan, color)并通过for循环依次在同一张图上绘制三种颜色的直方图。
Python zip( )函数
zip( ) 函数用于将可迭代的对象作为参数,将对象中对应的元素打包成一个个元组,然后返回由这些元组组成的列表。即列表中的元素是打包好后的元组,每组元组中的元素则是属性相关的参数。
看一个简单示例:
# Zip three lists
x = [1, 2]
y = ['one', 'two', 'three']
z = ['I', 'II', 'III']
result = zip(x, y, z)
print(list(result))
输出结果:[(1, ‘one’, ‘I’), (2, ‘two’, ‘II’)]
对打包好的元组列表进行解压,需要借助解压运算符*。
# Unzip
x, y, z = zip(*result)
result = zip(x, y, z)
print("x:", x, "y:", y, "z:", z)
输出结果:x: (1, 2) y: (‘one’, ‘two’) z: (‘I’, ‘II’)
双通道直方图
Line 35
新建图表,用于放置三个双通道直方图。
Line 37-42
在第一个子图中绘制绿、蓝双通道的直方图。
添加子图,由calcHist函数计算该直方图并将输出矩阵赋值给hist。
函数的第一个参数是由绿、蓝通道组成的图像;由于是双通道,故通道索引为[0, 1];对该二维直方图两个通道选择的仓数均为32;对两个通道的像素值都给定[0, 255]的取值可能。
采用最近邻插值,以热图的形式绘制2D直方图。
最后,对直方图添加colorbar(色条)提供数量值到颜色的可视化映射,以便对比观察像素强度分布特征。
Line 44-49
在第二个子图中绘制绿、红双通道的直方图。
Line 51-56
在第三个子图中绘制蓝、红双通道的直方图。
Line 59
显示2D直方图的大小和计算的像素值数。
三通道直方图
Line 64-65
更改每个通道的bins数为8,显示3D直方图相关信息。
Line 68
显示所有图像。
c.运行结果
 |
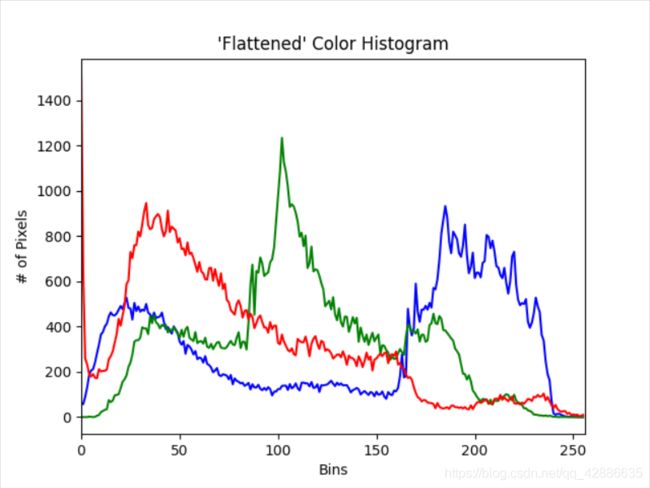 |
|---|---|
| Original | 1D Color Histogram |
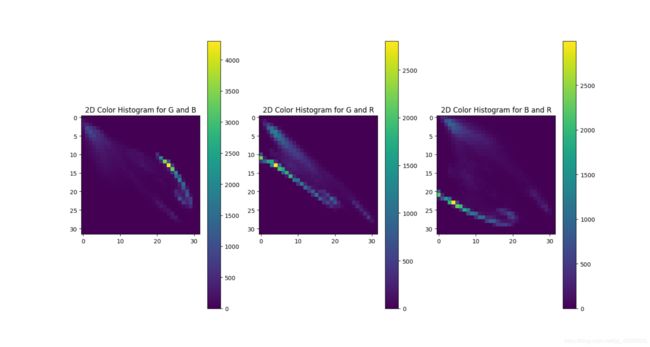 |
|---|
| 2D Color Histogram |
通过绘制直方图,我们可以直观地看出一幅图像中像素强度的分布情况。
3、直方图均衡化
当一张图像的前景与背景都较暗或较亮,通常可以借助直方图均衡化来“拉伸”图像中的像素分布以改善图像的对比度。(将像素尽可能均匀地分布到8 bits全部深度)虽然这可能会使得图像看起来不太真实,但这不妨碍它坐拥广泛的应用市场。例如:直方图均衡化可被应用于医疗领域提高一张X光图像的清晰度,或用于提升一张卫星图像的对比度。
通过运行书上一个简单的例子,我们能更清晰直观地了解直方图均衡化的作用。
a.源代码呈现
equalize.py
# Import the necessary packages
import numpy as np
import argparse
import cv2

# Construct the argument parser and parse the arguments
ap = argparse.ArgumentParser()
ap.add_argument("-i", "--image", required = True,
	help = "Path to the image")
args = vars(ap.parse_args())

# Load the image and convert it to grayscale
image = cv2.imread(args["image"])
image = cv2.cvtColor(image, cv2.COLOR_BGR2GRAY)

# Apply histogram equalization to stretch the constrast of our image
eq = cv2.equalizeHist(image)

# Show our images -- notice how the constrast of the second image has been stretched
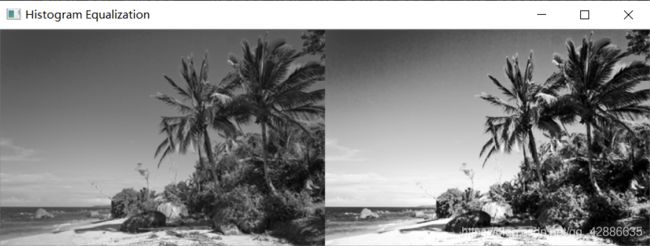
cv2.imshow("Histogram Equalization", np.hstack([image, eq]))
cv2.waitKey(0)
b.代码分析
Line 1-10
导入必要宏包,建立argument parser对象。
line 13-14
载入图像并将彩色图像转化为灰度图。直方图均衡化算法要求输入为8位单通道图像,因此需要首先将图像转化为灰度图。
Line 17
由cv2.equalizeHist函数对灰度图进行直方图均衡化处理。
Line 20-21
np.hstack函数的作用是将原图像与应用直方图均衡化后的图像的矩阵水平堆叠,即将两张图像横向并排显示。当不想在多个窗口显示多张图片时,可以运用此函数将多张图片显示在同一行用于对比。
c.运行结果
可以看出,对图像进行直方图均衡化后,图像的对比度有明显提高,整体明暗度差异拉大。
4、带掩膜的直方图
很多时候,我们只关注图像中的部分区域,此时可以借助带掩膜的直方图观察其特征。书上给出了一个应用方形掩膜的例子。
a.源代码呈现
histogram_with_mask.py
# Import the necessary packages
from matplotlib import pyplot as plt
import numpy as np
import argparse
import cv2

def plot_histogram(image, title, mask = None):
	# Grab the image channels, initialize the tuple of colors and the figure
	chans = cv2.split(image)
	colors = ("b", "g", "r")
	plt.figure()
	plt.title(title)
	plt.xlabel("Bins")
	plt.ylabel("# of Pixels")

	# Loop over the image channels
	for (chan, color) in zip(chans, colors):
		# Create a histogram for the current channel and plot it
		hist = cv2.calcHist([chan], [0], mask, [256], [0, 256])
		plt.plot(hist, color = color)
		plt.xlim([0, 256])

# Construct the argument parser and parse the arguments
ap = argparse.ArgumentParser()
ap.add_argument("-i", "--image", required = True,
	help = "Path to the image")
args = vars(ap.parse_args())

# Load the original image and plot a histogram for it
image = cv2.imread(args["image"])
cv2.imshow("Original", image)
plot_histogram(image, "Histogram for Original Image")

# Construct a mask for our image -- our mask will be BLACK for regions we want to IGNORE
# and WHITE for regions we want to EXAMINE.
mask = np.zeros(image.shape[:2], dtype = "uint8")
cv2.rectangle(mask, (15, 15), (130, 100), 255, -1)
cv2.imshow("Mask", mask)

# What does masking our image look like?
masked = cv2.bitwise_and(image, image, mask = mask)
cv2.imshow("Applying the Mask", masked)

# Let's compute a histogram for our image, but we'll only include pixels in the masked region.
plot_histogram(image, "Histogram for Masked Image", mask = mask)

# Show our plots
plt.show()
Line 1-5
导入必要的宏包。
Line 7-21
定义plot_histogram函数,对输入图像进行直方图计算。掩膜默认为None。
Line 23-27
建立argument parser解析命令行参数。
Line 29-31
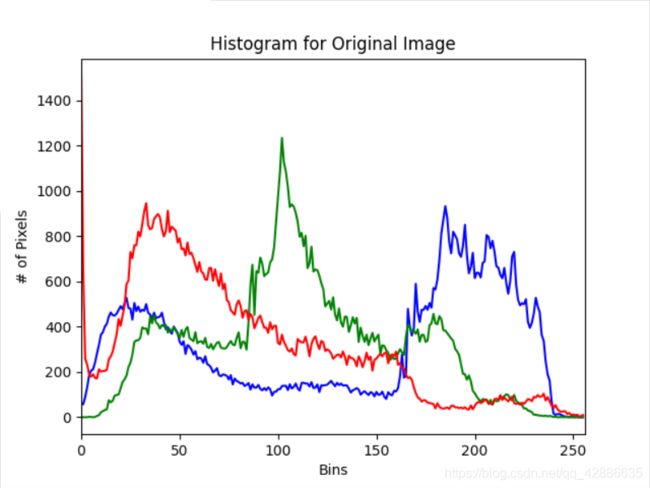
读入原图像,计算其直方图并分别显示。
Line 34-38
建立一张与原图像大小一般的纯黑画布,并根据所给坐标截取选定区域作为掩膜并显示。
Line 40-42
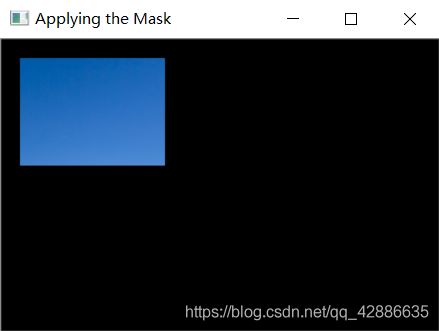
通过bitwise_and( )函数对原图像应用掩膜,只显示原图像在掩膜画布中为白色的区域,显示掩膜后的图像。
Line44-45
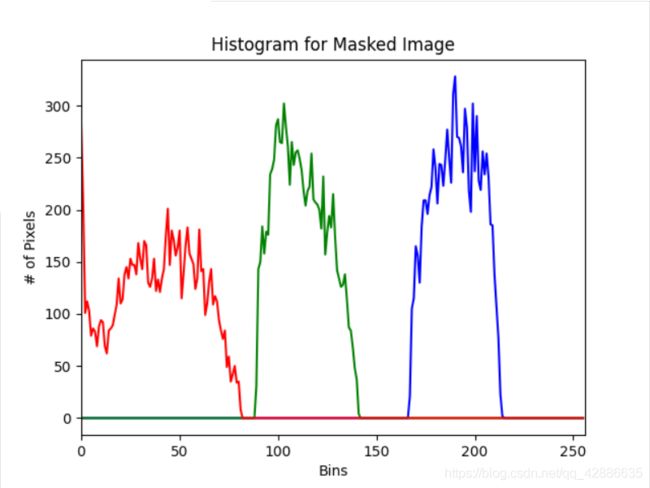
绘制掩膜后图像的直方图。
c.运行结果
 |
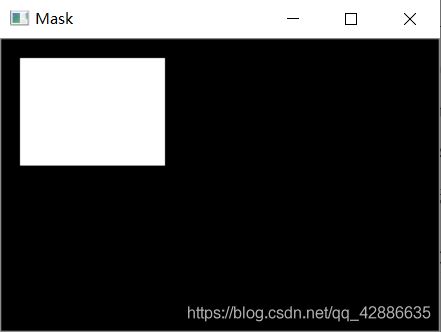 |
 |
|---|---|---|
| Original | Mask | Applying the Mask |
 |
 |
|---|---|
| Histogram for Original Image | Histogram for Masked Image |
可以看到,应用掩膜后的图像与原图像的直方图分布情况相去甚远。在带掩膜的直方图中,红色像素的贡献极小,其次是绿色像素,而蓝色像素普遍较为明亮——这是因为我们选择的掩膜是天空的区域。
通过应用掩膜,我们可以只对图像的特定区域进行想要的操作或观察某个区域的局部特征。
绘制直方图的操作虽然简单,但它在图像处理和计算机视觉中有着大量实际的应用,需要牢牢掌握。
