python实现按时间(提取年份)统计数据并绘制柱状图
实现功能:
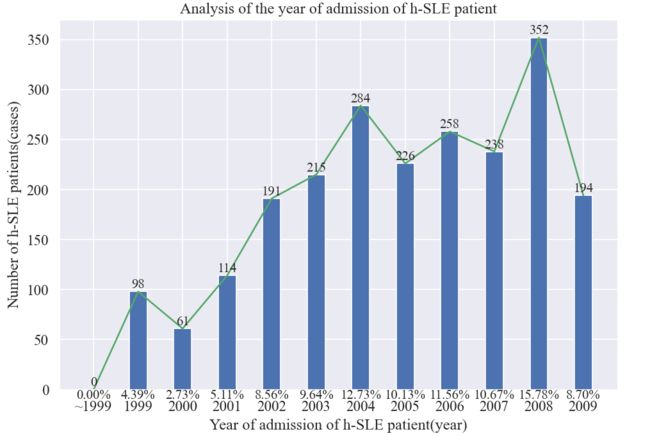
从入院时间这一列(格式:2008-04-21)提取年份(例如2008),随后按照年份统计记录数。
输入:excel文件,含有2231条记录,含有入院时间这一列;
输出:统计出每个年份各有多少条记录数。
实现代码:
import seaborn as sns
import numpy as np
from xlrd import xldate_as_datetime
import xlrd
import matplotlib.pyplot as plt


def Statistics_by_time(file):
    workbook = xlrd.open_workbook(file)  # 文件路径
    worksheet=workbook.sheet_by_index(0)

    nrow=worksheet.nrows
    print(nrow)

    down1999=e1999=e2000=e2001=e2002=e2003=e2004=e2005=e2006=e2007=e2008=e2009=up2009=0

    for i in range(1,nrow):
        row= worksheet.row_values(i)
        if row[13]!='':
            d1=xldate_as_datetime(row[13],0).strftime('%Y')
            print(d1,type(d1))
            if int(d1)<1999:
                down1999=down1999+1
            elif d1=="1999":
                e1999=e1999+1
            elif d1=="2000":
                e2000=e2000+1
            elif d1=="2001":
                e2001=e2001+1
            elif d1=="2002":
                e2002=e2002+1
            elif d1=="2003":
                e2003=e2003+1
            elif d1=="2004":
                e2004=e2004+1
            elif d1=="2005":
                e2005=e2005+1
            elif d1=="2006":
                e2006=e2006+1
            elif d1=="2007":
                e2007=e2007+1
            elif d1=="2008":
                e2008=e2008+1
            elif d1=="2009":
                e2009=e2009+1
            elif int(d1)>2009:
                up2009=up2009+1

    print(down1999,e1999,e2000,e2001,e2002,e2003,e2004,e2005,e2006,e2007,e2008,e2009,up2009)
    print(np.mean([down1999,e1999,e2000,e2001,e2002,e2003,e2004,e2005,e2006,e2007,e2008,e2009,up2009]))

    font = {'family': 'Times New Roman',
            'size': 16,
            }
    sns.set(font_scale=1.2)
    plt.rc('font',family='Times New Roman')

    X = ['~1999', '1999', '2000', '2001', '2002', '2003', '2004', '2005', '2006', '2007', '2008', '2009']
    Y = [down1999,e1999,e2000,e2001,e2002,e2003,e2004,e2005,e2006,e2007,e2008,e2009]
    Z=[down1999,e1999,e2000,e2001,e2002,e2003,e2004,e2005,e2006,e2007,e2008,e2009]/np.sum(Y)

    fig = plt.figure(figsize=(9,6))
    plt.bar(X, Y, 0.4, color="b")
    plt.plot(X, Y, 0.4, color="g")
    plt.xlabel("Year of admission of h-SLE patient(year)", fontsize=14)
    plt.ylabel("Number of h-SLE patients(cases)", fontsize=14)
    plt.title("Analysis of the year of admission of h-SLE patient", fontsize=14)

    for a, b in zip(X, Z):  # 柱子上的数字显示
        plt.text(a, b, '%.2f%%' % (b*100), ha='center', va='top', fontsize=12)
    for a,b in zip(X,Y):   #柱子下的数字显示
        plt.text(a,b,'%d'%b,ha='center',va='bottom',fontsize=12)

    plt.show()

if __name__=='__main__':
    Statistics_by_time("F:\数据杂坛\data\患者按地区研究信息_2231 .xls")
实现效果:
统计出的各个年份的记录数:
![]()
绘制的柱状图:
喜欢记得点赞,在看,加关注,将持续更新!