【R语言数据科学】:文本挖掘(以特朗普推文数据为例)
【R语言数据科学】:文本挖掘(以特朗普推文数据为例)
- 个人主页:JoJo的数据分析历险记
- 个人介绍:小编大四统计在读,目前保研到统计学top3高校继续攻读统计研究生
- 如果文章对你有帮助,欢迎✌
关注、点赞、✌收藏、订阅专栏- ✨本文收录于【R语言数据科学】本系列主要介绍R语言在数据科学领域的应用包括:
R语言编程基础、R语言可视化、R语言进行数据操作、R语言建模、R语言机器学习算法实现、R语言统计理论方法实现。本系列会坚持完成下去,请大家多多关注点赞支持,一起学习~,尽量坚持每周持续更新,欢迎大家订阅交流学习!
![]()
文章目录
- 【R语言数据科学】:文本挖掘(以特朗普推文数据为例)
- r语言数据科学:文本挖掘
- 1.特朗普推特文章
-
- 1.1查看数据
- 1.2 数据基本情况
- 2.文本数据分析
- 3.情绪分析:特朗普自己的推文比他的竞选推文更多负面情绪
r语言数据科学:文本挖掘
除了用于表示分类数据的标签外,我们专注于数值数据。但在许多应用中,数据以文本开始。例如垃圾邮件过滤、网络犯罪预防、反恐和情绪分析。在所有这些情况下,原始数据都由自由格式的文本组成。我们的任务是从这些数据中提取信息。我们接下来介绍一下如何从文本数据中生成有用的数字摘要,我们可以在这些摘要中应用我们学到的一些强大的数据可视化和分析技术。
1.特朗普推特文章
在 2016 年美国总统大选期间,当时的候选人唐纳德·J·特朗普 (Donald J. Trump) 使用他的推特账户作为与潜在选民交流的一种方式。数据科学家 David robinson 进行了一项分析,发现竞选期间特朗普的推文有两个来源,其中,Android(他自己) 和 iPhone(他的员工) 的推文显然来自不同的人,在一天中的不同时间发布,并以不同的方式使用主题标签、链接和转发。更重要的是,我们可以看到,Android 的推文更加愤怒和负面,而 iPhone 的推文往往是良性的公告和图片。这让我们可以区分竞选活动的推文(iPhone)和特朗普自己的推文(Android)。以确定数据是否支持这一断言。在这里,我们通过大卫的分析来学习一些文本挖掘的基础知识。
# 导入相关库
library(tidyverse)
library(lubridate)
library(scales)
一般来说,我们可以使用
rtweet包直接从 Twitter 中提取数据。为方便起见,我们直接使用包含在 dslabs 包中的数据:
library(dslabs)
data("trump_tweets")
1.1查看数据
head(trump_tweets)
| source | id_str | text | created_at | retweet_count | in_reply_to_user_id_str | favorite_count | is_retweet | |
|---|---|---|---|---|---|---|---|---|
| 1 | Twitter Web Client | 6971079756 | From Donald Trump: Wishing everyone a wonderful holiday & a happy, healthy, prosperous New Year. Let’s think like champions in 2010! | 2009-12-23 12:38:18 | 28 | NA | 12 | FALSE |
| 2 | Twitter Web Client | 6312794445 | Trump International Tower in Chicago ranked 6th tallest building in world by Council on Tall Buildings & Urban Habitat http://bit.ly/sqvQq | 2009-12-03 14:39:09 | 33 | NA | 6 | FALSE |
| 3 | Twitter Web Client | 6090839867 | Wishing you and yours a very Happy and Bountiful Thanksgiving! | 2009-11-26 14:55:38 | 13 | NA | 11 | FALSE |
| 4 | Twitter Web Client | 5775731054 | Donald Trump Partners with TV1 on New reality Series Entitled, Omarosa's Ultimate Merger: http://tinyurl.com/yk5m3lc | 2009-11-16 16:06:10 | 5 | NA | 3 | FALSE |
| 5 | Twitter Web Client | 5364614040 | --Work has begun, ahead of schedule, to build the greatest golf course in history: Trump International – Scotland. | 2009-11-02 09:57:56 | 7 | NA | 6 | FALSE |
| 6 | Twitter Web Client | 5203117820 | --From Donald Trump: "Ivanka and Jared’s wedding was spectacular, and they make a beautiful couple. I’m a very proud father." | 2009-10-27 10:31:48 | 4 | NA | 5 | FALSE |
names(trump_tweets)
- 'source'
- 'id_str'
- 'text'
- 'created_at'
- 'retweet_count'
- 'in_reply_to_user_id_str'
- 'favorite_count'
- 'is_retweet'
1.2 数据基本情况
使用
?trup_tweets可以了解各个变量的具体信息,如下
- source. 用于撰写推文的设备或服务。
- id_str.推文 ID。
- text.推文.
- created_at. 发表的时间
- retweet_count.被转发多少次。
- in_reply_to_user_id_str.如果有评论,则返回回复的人的用户 ID
- favorite_count. 点赞数
- is_retweet. 是否是转载的
下面我们通过source来看推文的来源数量
trump_tweets %>% count(source) %>% arrange(desc(n)) %>% head(5)
| source | n | |
|---|---|---|
| 1 | Twitter Web Client | 10718 |
| 2 | Twitter for Android | 4652 |
| 3 | Twitter for iPhone | 3962 |
| 4 | TweetDeck | 468 |
| 5 | TwitLonger Beta | 288 |
我们对竞选期间发生的事情感兴趣,因此在本次分析中,我们将重点关注特朗普宣布竞选当天和选举日之间发布的推文。我们定义了下表,其中仅包含该时间段的推文。请注意,我们使用
extract来删除部分含有Twitter for (.*),并且过滤掉转载的文章
campaign_tweets <- trump_tweets %>%
  extract(source, "source", "Twitter for (.*)") %>%
  filter(source %in% c("Android", "iPhone") &
           created_at >= ymd("2015-06-17") &
           created_at < ymd("2016-11-08")) %>%
  filter(!is_retweet) %>%
  arrange(created_at) %>%
  as_tibble()
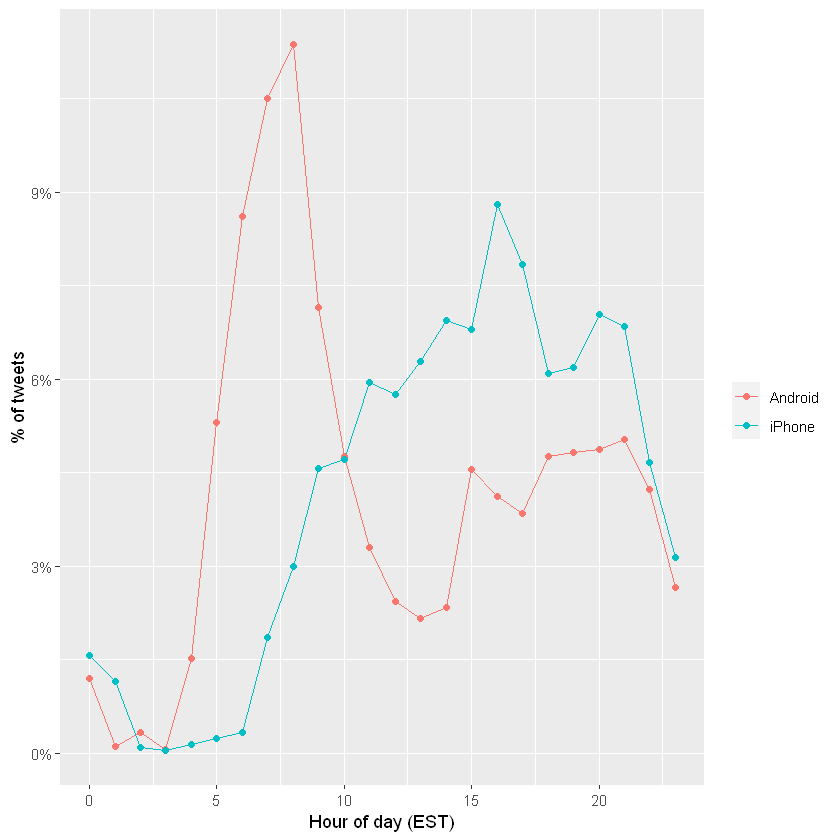
我们现在来探索两个不同这些设备发推文的可能性。对于每条推文,我们将提取时间,东海岸时间(EST),然后计算每个设备每小时推文的比例:
campaign_tweets %>%
  mutate(hour = hour(with_tz(created_at, "EST"))) %>%
  count(source, hour) %>%
  group_by(source) %>%
  mutate(percent = n / sum(n)) %>%
  ungroup %>%
  ggplot(aes(hour, percent, color = source)) +
  geom_line() +
  geom_point() +
  scale_y_continuous(labels = percent_format()) +
  labs(x = "Hour of day (EST)", y = "% of tweets", color = "")
特朗普在 Android 平台上早上发布的推文更多,而 iPhone 上的竞选推文在下午和傍晚发布更多信息。
在其他地方,我们可以看到不同之处在于在推文中共享链接或图片。
tweet_picture_counts <- campaign_tweets %>%
  filter(!str_detect(text, '^"')) %>%
  count(source,
        picture = ifelse(str_detect(text, "t.co"),
                         "Picture/link", "No picture/link"))

ggplot(tweet_picture_counts, aes(source, n, fill = picture)) +
  geom_bar(stat = "identity", position = "dodge") +
  labs(x = "", y = "Number of tweets", fill = "")
事实证明,来自 iPhone 的推文包含图片或链接的可能性是其 38 倍。这对我们的叙述也很有意义:iPhone(可能由该活动运行)倾向于撰写有关事件的“公告”推文。接下来,我们将研究将 Android 与 iPhone 进行比较时推文有何不同。为此,我们引入了 tidytext 包。
2.文本数据分析
tidytext包帮助我们将自由格式的文本转换为整洁的表格。拥有这种格式的数据极大地促进了数据可视化和统计技术的使用。
使用install.packages('tidytext')安装
我们首先使用
unnest_tokens函数将文本划分为单个单词,并删除一些常见的“停用词”。这个函数将获取一个字符串向量并提取标记,以便每个标记在新表中都有一行。下面我们一个简单的例子:
library(tidytext)
text <- c('I am JoJo,','he is kimi','life is short')
example <- tibble(line = c(1, 2, 3),
                      text = text)
example %>% unnest_tokens(word,text)
| line | word |
|---|---|
| 1 | i |
| 1 | am |
| 1 | jojo |
| 2 | he |
| 2 | is |
| 2 | kimi |
| 3 | life |
| 3 | is |
| 3 | short |
现在我们看一下推文的第一条数据
campaign_tweets[1,]
| source | id_str | text | created_at | retweet_count | in_reply_to_user_id_str | favorite_count | is_retweet |
|---|---|---|---|---|---|---|---|
| Android | 612063082186174464 | Why did @DanaPerino beg me for a tweet (endorsement) when her book was launched? | 2015-06-19 20:03:05 | 166 | NA | 348 | FALSE |
campaign_tweets[1,] %>%
  unnest_tokens(word, text) %>%
  pull(word)
- 'why'
- 'did'
- 'danaperino'
- 'beg'
- 'me'
- 'for'
- 'a'
- 'tweet'
- 'endorsement'
- 'when'
- 'her'
- 'book'
- 'was'
- 'launched'
默认的unnest_tokens会去除特殊符号,我们可以通过指定token,来保留这些符号
campaign_tweets[1,] %>%
  unnest_tokens(word, text, token = "tweets") %>%
  pull(word)
- 'why'
- 'did'
- '@danaperino'
- 'beg'
- 'me'
- 'for'
- 'a'
- 'tweet'
- 'endorsement'
- 'when'
- 'her'
- 'book'
- 'was'
- 'launched'
接下来我们要做的另一个小调整是删除图片链接,得到提取的
word
links <- "https://t.co/[A-Za-z\\d]+|&"
tweet_words <- campaign_tweets %>%
  mutate(text = str_replace_all(text, links, ""))  %>%
  unnest_tokens(word, text, token = "tweets")
接下来我们来看一下哪些单词出现的次数最多
tweet_words %>%
  count(word) %>%
  top_n(10, n) %>%
  mutate(word = reorder(word, n)) %>%
  arrange(desc(n))
| word | n |
|---|---|
| the | 2329 |
| to | 1410 |
| and | 1239 |
| in | 1185 |
| i | 1143 |
| a | 1112 |
| you | 999 |
| of | 982 |
| is | 942 |
| on | 874 |
不难理解这些词出现的次数最多。但是这些词没有提供信息。 tidytext包有这些常用词的数据库,称为停用词,在文本挖掘中:
stop_words可以查看常见的停用词
head(stop_words)
| word | lexicon |
|---|---|
| a | SMArT |
| a's | SMArT |
| able | SMArT |
| about | SMArT |
| above | SMArT |
| according | SMArT |
接下来我们删选掉属于停用词的文本
tweet_words <- campaign_tweets %>%
  mutate(text = str_replace_all(text, links, ""))  %>%
  unnest_tokens(word, text, token = "tweets") %>%
  filter(!word %in% stop_words$word )
tweet_words %>%
  count(word) %>%
  top_n(10, n) %>%
  mutate(word = reorder(word, n)) %>%
  arrange(desc(n))
| word | n |
|---|---|
| #trump2016 | 414 |
| hillary | 405 |
| people | 303 |
| #makeamericagreatagain | 294 |
| america | 254 |
| clinton | 237 |
| poll | 217 |
| crooked | 205 |
| trump | 195 |
| cruz | 159 |
可以看出这个时候出现最多的次数的
word能给我们一些信息,但是我们还要进行一个正则删选掉一些特殊的标记
tweet_words <- campaign_tweets %>%
  mutate(text = str_replace_all(text, links, ""))  %>%
  unnest_tokens(word, text, token = "tweets") %>%
  filter(!word %in% stop_words$word &
           !str_detect(word, "^\\d+$")) %>%
  mutate(word = str_replace(word, "^'", ""))
Using `to_lower = TrUE` with `token = 'tweets'` may not preserve UrLs.
现在我们已经将所有单词放在了一个表格中,以及有关用于撰写它们来自的推文的设备的信息,我们可以开始探索在将 Android 与 iPhone 进行比较时哪些单词更常见。
对于每个单词,我们想知道它更有可能来自 Android 推文还是 iPhone 推文。在这里我们使用优势比率指标来进行衡量。对于每个设备和一个给定的单词,我们称它为 y,我们计算 y 和非 y 单词比例之间的几率或比率,并计算这些几率的比率。这里我们将有许多比例为 0,因此我们使用0.5 校正,具体做法如下:
# i n A n d r o i d + 0.5 / t o t a l A n d r o i d + 0.5 # i n i P h o n e + 0.5 / t o t a l i P h o n e + 0.5 \frac{\#in Android+0.5/totalAndroid+0.5}{ \#in iPhone+0.5/totaliPhone+0.5} #iniPhone+0.5/totaliPhone+0.5#inAndroid+0.5/totalAndroid+0.5
android_iphone_or <- tweet_words %>%
  count(word, source) %>%
  pivot_wider(names_from = "source", values_from = "n", values_fill = 0) %>%#将长数据转换为宽数据
  mutate(or = (Android + 0.5) / (sum(Android) + 0.5) /
           ( (iPhone + 0.5) / (sum(iPhone) + 0.5)))
因此,or值越大,证明出现在android中的频率越大
以下是 Android 的最大优势比率
android_iphone_or %>% arrange(desc(or))%>%head()
| word | iPhone | Android | or |
|---|---|---|---|
| poor | 0 | 13 | 23.08133 |
| poorly | 0 | 12 | 21.37160 |
| turnberry | 0 | 11 | 19.66188 |
| @cbsnews | 0 | 10 | 17.95215 |
| angry | 0 | 10 | 17.95215 |
| bosses | 0 | 10 | 17.95215 |
以下是iPhone的优势比最大的几个
word
android_iphone_or %>% arrange(or) %>% head()
| word | iPhone | Android | or |
|---|---|---|---|
| #makeamericagreatagain | 294 | 0 | 0.001451382 |
| #americafirst | 71 | 0 | 0.005978071 |
| #draintheswamp | 63 | 0 | 0.006731214 |
| #trump2016 | 411 | 3 | 0.007271020 |
| #votetrump | 56 | 0 | 0.007565170 |
| join | 157 | 1 | 0.008141564 |
鉴于其中几个词是整体低频词,我们可以根据总频率施加一个过滤器,如下所示:
android_iphone_or %>% filter(Android+iPhone > 70) %>%
  arrange(desc(or))%>%head()
| word | iPhone | Android | or |
|---|---|---|---|
| @cnn | 17 | 90 | 4.420869 |
| republican | 12 | 63 | 4.342710 |
| bernie | 13 | 59 | 3.767735 |
| bad | 26 | 104 | 3.371068 |
| wow | 23 | 74 | 2.710101 |
| crooked | 49 | 156 | 2.702752 |
- 大多数主题标签来自 iPhone。事实上,几乎没有来自特朗普安卓系统的推文包含主题标签。
- 诸如“join”和“tomorrow”之类的词,也仅来自 iPhone。 iPhone 显然负责活动公告(“明天晚上 7 点在德克萨斯州休斯顿加入我!”)
我们已经看到,从一种设备发布的文字类型比另一种设备更多。但是,我们对特定的单词不感兴趣,而是对语气感兴趣。 那么我们如何用数据来检查呢?单词可以与更基本的情绪相关联,例如愤怒、恐惧、喜悦和惊讶。
3.情绪分析:特朗普自己的推文比他的竞选推文更多负面情绪
在情感分析中,我们将一个词分配给一个或多个“情感”。尽管这种方法会遗漏与上下文相关的情绪,例如讽刺,但在对大量单词执行时,这样是有效的
情感分析的第一步是为每个单词分配一个情感。我们还将使用 textdata 包。
library(tidytext)
library(textdata)
对于我们的分析,我们有兴趣探索每条推文的不同情绪,因此我们将使用
nrc词典,包含了10种不同的情绪以及对于的单词,如下所示。第一次使用需要下载
get_sentiments("nrc") %>% head()
| word | sentiment |
|---|---|
| abacus | trust |
| abandon | fear |
| abandon | negative |
| abandon | sadness |
| abandoned | anger |
| abandoned | fear |
get_sentiments("nrc") %>% count(sentiment)
| sentiment | n |
|---|---|
| anger | 1245 |
| anticipation | 837 |
| disgust | 1056 |
| fear | 1474 |
| joy | 687 |
| negative | 3316 |
| positive | 2308 |
| sadness | 1187 |
| surprise | 532 |
| trust | 1230 |
可以看出不同的单词对应的情感。接下来我们就通过nrc词典来匹配推文中的情感
nrc <- get_sentiments("nrc") %>%
  select(word, sentiment)
我们可以使用 inner_join 组合word和sentiments,它只会保留与情绪相关联的单词。 以下是从推文中提取的7 个随机单词:
tweet_words %>% inner_join(nrc, by = "word") %>%
  select(source, word, sentiment) %>%
  sample_n(7)
| source | word | sentiment |
|---|---|---|
| iPhone | happy | joy |
| iPhone | scum | disgust |
| Android | love | joy |
| iPhone | hurt | anger |
| Android | failing | anticipation |
| iPhone | victory | anticipation |
| iPhone | reporter | positive |
现在我们准备通过比较从每个设备发布的推文的情绪来执行比较 Android 和 iPhone 的定量分析。在这里,我们可以执行逐条推文分析,为每条推文分配情绪。然而,这将具有挑战性,因为每条推文都会附有几种情感,词典中出现的每个单词都有一种情感。出于说明目的,我们将执行一个更简单的分析 :我们将计算和比较每个设备中出现的每种情绪的频率。
sentiment_counts <- tweet_words %>%
  left_join(nrc, by = "word") %>%#连接表
  count(source, sentiment) %>%#记数
  pivot_wider(names_from = "source", values_from = "n") %>%#将长数据转换为宽数据
  mutate(sentiment = replace_na(sentiment, replace = "none"))
sentiment_counts
| sentiment | Android | iPhone |
|---|---|---|
| anger | 957 | 528 |
| anticipation | 909 | 710 |
| disgust | 638 | 318 |
| fear | 794 | 486 |
| joy | 687 | 530 |
| negative | 1637 | 925 |
| positive | 1805 | 1468 |
| sadness | 890 | 515 |
| surprise | 518 | 365 |
| trust | 1235 | 985 |
| none | 11911 | 10775 |
对于每种情绪,我们可以计算出现在设备中的几率:有情绪的词的与没有情绪的词的比例,然后计算比较两个设备的几率比。
sentiment_counts %>%
  mutate(Android = Android / (sum(Android) - Android) ,
         iPhone = iPhone / (sum(iPhone) - iPhone),
         or = Android/iPhone) %>%
  arrange(desc(or))
| sentiment | Android | iPhone | or |
|---|---|---|---|
| disgust | 0.02989270 | 0.01839533 | 1.6250163 |
| anger | 0.04551941 | 0.03091878 | 1.4722252 |
| negative | 0.08046599 | 0.05545564 | 1.4509974 |
| sadness | 0.04219809 | 0.03013458 | 1.4003212 |
| fear | 0.03747581 | 0.02838951 | 1.3200584 |
| surprise | 0.02413456 | 0.02117169 | 1.1399446 |
| joy | 0.03226261 | 0.03103953 | 1.0394039 |
| anticipation | 0.04313781 | 0.04202427 | 1.0264977 |
| trust | 0.05952955 | 0.05926594 | 1.0044478 |
| positive | 0.08946273 | 0.09097106 | 0.9834196 |
| none | 1.18282026 | 1.57759883 | 0.7497598 |
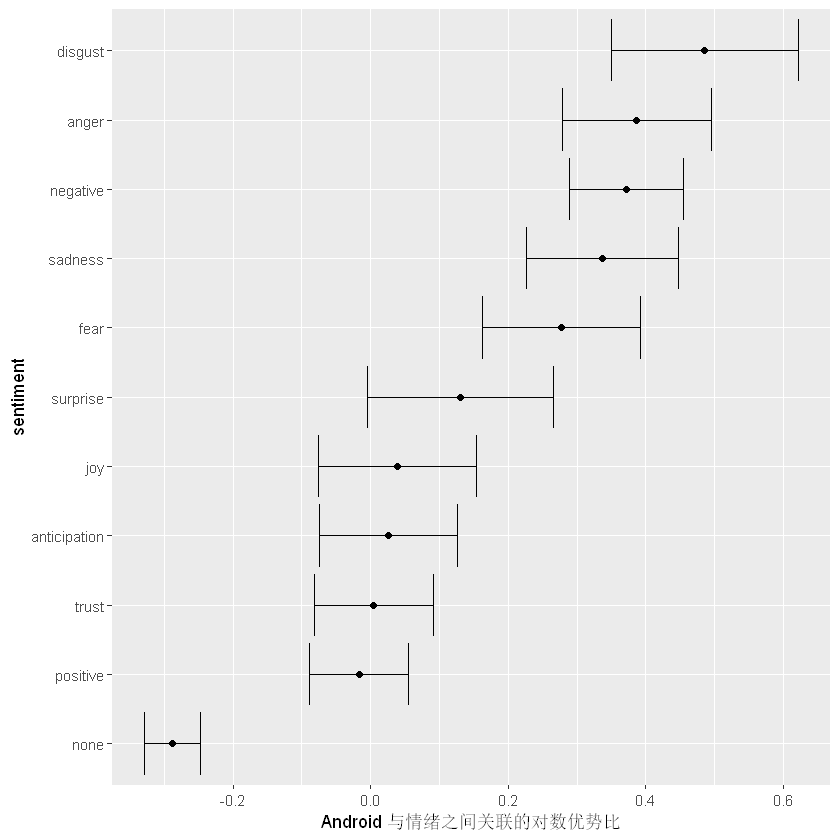
从结果来看,我们确实看到了一些差异,而且顺序很有趣:差异最大的三种情绪分别是disgust、anger和negative!但是这些差异仅仅是偶然的吗?为了回答这个问题,我们可以为每种情绪计算优势比的置信区间。
library(broom)
log_or <- sentiment_counts %>%
  mutate(log_or = log((Android / (sum(Android) - Android)) / #对数优势比率
      (iPhone / (sum(iPhone) - iPhone))),
          se = sqrt(1/Android + 1/(sum(Android) - Android) + #标准差
                      1/iPhone + 1/(sum(iPhone) - iPhone)),
          conf.low = log_or - qnorm(0.975)*se,#置信区间
          conf.high = log_or + qnorm(0.975)*se) %>%
  arrange(desc(log_or))

log_or
| sentiment | Android | iPhone | log_or | se | conf.low | conf.high |
|---|---|---|---|---|---|---|
| disgust | 638 | 318 | 0.48551786 | 0.06940283 | 0.349490809 | 0.62154491 |
| anger | 957 | 528 | 0.38677499 | 0.05518147 | 0.278621304 | 0.49492869 |
| negative | 1637 | 925 | 0.37225121 | 0.04243891 | 0.289072471 | 0.45542995 |
| sadness | 890 | 515 | 0.33670165 | 0.05631403 | 0.226328172 | 0.44707513 |
| fear | 794 | 486 | 0.27767601 | 0.05850361 | 0.163011040 | 0.39234098 |
| surprise | 518 | 365 | 0.13097963 | 0.06910010 | -0.004454084 | 0.26641335 |
| joy | 687 | 530 | 0.03864735 | 0.05871902 | -0.076439815 | 0.15373451 |
| anticipation | 909 | 710 | 0.02615270 | 0.05113909 | -0.074078068 | 0.12638347 |
| trust | 1235 | 985 | 0.00443794 | 0.04396948 | -0.081740666 | 0.09061655 |
| positive | 1805 | 1468 | -0.01671935 | 0.03669808 | -0.088646252 | 0.05520756 |
| none | 11911 | 10775 | -0.28800233 | 0.02055435 | -0.328288106 | -0.24771655 |
我们看到,厌恶、愤怒、消极、悲伤和恐惧情绪与 Android 相关联的方式很难仅靠偶然来解释。下面我们通过一个图形来更直观的看一下不同设备的情绪差异。其中or小于0意味着iPhone设备出现的更多,or大于0意味着 Android 设备出现的更多
log_or %>%
  mutate(sentiment = reorder(sentiment, log_or)) %>%
  ggplot(aes(x = sentiment, ymin = conf.low, ymax = conf.high)) +
  geom_errorbar() +
  geom_point(aes(sentiment, log_or)) +
  ylab("Android与情绪之间关联的对数优势比") +
  coord_flip()
因此 ,特朗普的安卓账户使用的与厌恶、悲伤、恐惧、愤怒和其他“负面”情绪相关的词语比 iPhone 账户多 40-80%。 (积极情绪在统计学上没有显着差异)。
如果我们有兴趣探索导致这些差异的特定词,我们可以参考我们的 android_iphone_or 对象:
android_iphone_or %>% inner_join(nrc) %>%
  filter(sentiment == "disgust" & Android + iPhone > 10) %>%
  arrange(desc(or))
| word | iPhone | Android | or | sentiment |
|---|---|---|---|---|
| mess | 2 | 13 | 4.6162666 | disgust |
| finally | 2 | 12 | 4.2743209 | disgust |
| unfair | 2 | 12 | 4.2743209 | disgust |
| bad | 26 | 104 | 3.3710682 | disgust |
| terrible | 8 | 31 | 3.1680261 | disgust |
| lie | 3 | 12 | 3.0530864 | disgust |
| lying | 3 | 9 | 2.3203456 | disgust |
| waste | 5 | 12 | 1.9428732 | disgust |
| illegal | 14 | 32 | 1.9160749 | disgust |
| phony | 9 | 20 | 1.8447069 | disgust |
| pathetic | 5 | 11 | 1.7874433 | disgust |
| nasty | 6 | 13 | 1.7754872 | disgust |
| horrible | 7 | 14 | 1.6527374 | disgust |
| disaster | 11 | 21 | 1.5982243 | disgust |
| winning | 9 | 14 | 1.3047927 | disgust |
| liar | 5 | 6 | 1.0102940 | disgust |
| john | 21 | 24 | 0.9741476 | disgust |
| dishonest | 32 | 36 | 0.9600782 | disgust |
| terrorism | 9 | 9 | 0.8548642 | disgust |
| dying | 6 | 6 | 0.8548642 | disgust |
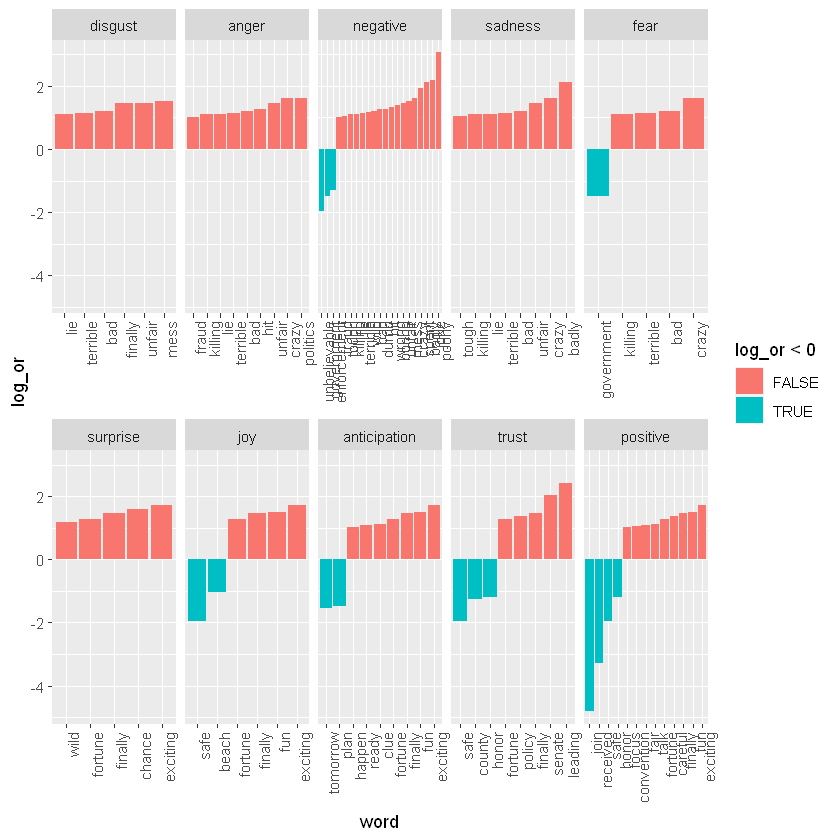
下面我们对哪些词引起了这种不同的情绪特别感兴趣。让我们考虑每个类别中差异最大的单词:
android_iphone_or %>% inner_join(nrc, by = "word") %>%
  mutate(sentiment = factor(sentiment, levels = log_or$sentiment)) %>%
  mutate(log_or = log(or)) %>%
  filter(Android + iPhone > 10 & abs(log_or)>1) %>%
  mutate(word = reorder(word, log_or)) %>%
  ggplot(aes(word, log_or, fill = log_or < 0)) +
  facet_wrap(~sentiment, scales = "free_x", nrow = 2) +
  geom_bar(stat="identity") +
  theme(axis.text.x = element_text(angle = 90, hjust = 1))
其中,红色代表特朗普的推文,蓝色表示其参加竞选活动的推文。 这证实了许多被注释为负面情绪的词在特朗普的 Android 推文中比在竞选活动的 iPhone 推文中更常见。
✨✨✨本章的介绍到此介绍,如果文章对你有帮助,请多多点赞、收藏、评论、关注支持!!


