机器学习(十七)Microsoft的InterpretM可解释性 机器学习模型
InterpretML 简介
适合可解释的模型
解释blackbox机器学习,可视化的展示“黑箱"机器学习
InterpretML是一个开源软件包,用于训练可解释的模型并解释黑盒系统。可解释性主要表现在以下几点:
模型调试 - 模型哪里出现了错误?
检测偏差 - 模型表现出哪些区分能力?
策略学习 - 模型是否满足某些规则要求?
高风险的应用 - 医疗保健,金融,司法等
从历史上看,最容易理解的模型不是很准确,最准确的模型是不可理解的。 Microsoft Research开发了一种称为可解释增强机Explainable Boosting Machine(EBM)的算法,该算法具有高精度和可懂度。 EBM使用现代机器学习技术,如装袋和助推,为传统GAM(Generalized Additive Models)注入新的活力。 这使它们像随机森林和梯度提升树一样准确,并且还增强了它们的可懂度和可编辑性。
除了EBM之外,InterpretML还支持LIME,SHAP,线性模型,部分依赖,决策树和规则列表等方法。该软件包可以轻松比较和对比模型,以找到最适合您需求的模型。
安装
Python 3.5+ | Linux, Mac OS X, Windows
pip install numpy scipy pyscaffold
pip install -U interpret
实例1 回归任务-波士顿房价预测
import pandas as pd
from sklearn.datasets import load_boston
from sklearn.model_selection import train_test_split
boston = load_boston()
feature_names = list(boston.feature_names)
X, y = pd.DataFrame(boston.data, columns=feature_names), boston.target
seed = 1
X_train, X_test, y_train, y_test = train_test_split(X, y, test_size=0.20, random_state=seed)
探索数据集
from interpret import show
from interpret.data import Marginal
marginal = Marginal().explain_data(X_train, y_train, name = 'Train Data')
show(marginal)
很强大,比以前自己在做的繁琐EDA的时候便捷多了,marginal可以识别出变量的类型,比如连续变量或者类别型变量,可以计算出与Y的相关性系数等。
训练 Explainable Boosting Machine (EBM)
from interpret.glassbox import ExplainableBoostingRegressor, LinearRegression, RegressionTree
ebm = ExplainableBoostingRegressor(random_state=seed)
ebm.fit(X_train, y_train) #Works on dataframes and numpy arrays
ExplainableBoostingRegressor(data_n_episodes=2000,
early_stopping_run_length=50,
early_stopping_tolerance=1e-05,
feature_names=['CRIM', 'ZN', 'INDUS', 'CHAS', 'NOX', 'RM', 'AGE', 'DIS', 'RAD', 'TAX', 'PTRATIO', 'B', 'LSTAT'],
feature_step_n_inner_bags=0,
feature_types=['continuous', 'continuous', 'continuous', 'categorical', 'continuous', 'continuous', 'continuous', 'continuous', 'continuous', 'continuous', 'continuous', 'continuous', 'continuous'],
holdout_size=0.15, holdout_split=0.15, interactions=0,
learning_rate=0.01, max_tree_splits=2,
min_cases_for_splits=2, n_estimators=16, n_jobs=-2,
random_state=1, schema=None, scoring=None,
training_step_episodes=1)
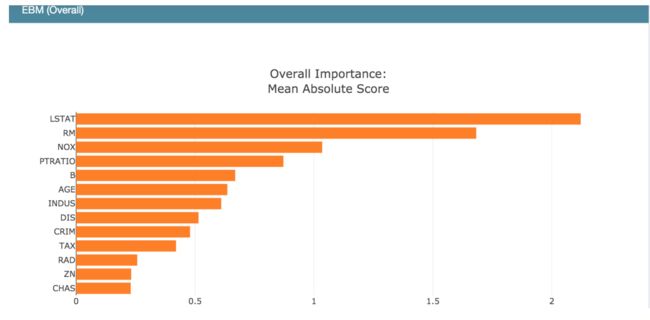
模型全局概览:模型总体上学到了什么
ebm_global = ebm.explain_global(name='EBM')
show(ebm_global)
可以学习到每个特征在不同密度下的贡献分数
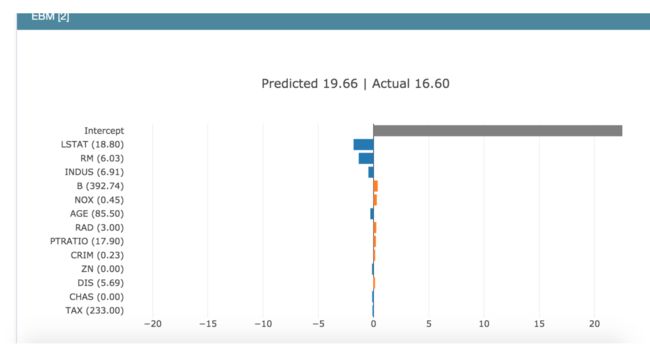
局部解释:每个特征与预测的关系
ebm.explain_local(X_test[:5], y_test[:5], name='EBM')
show(ebm_local)
预测值与真实值比较下的不同特征重要性
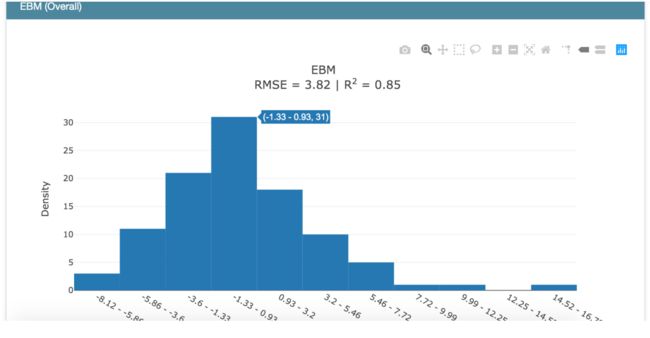
评估EBM的性能
回归任务评估指标为RMSE=3.82,R2=0.85(越接近1性能越好),已经很不错
测试一些其他的可解释模型
LinearRegression, RegressionTree
from interpret.glassbox import LinearRegression, RegressionTree

lr = LinearRegression(random_state=seed)
lr.fit(X_train, y_train)

rt = RegressionTree(random_state=seed)
rt.fit(X_train, y_train)
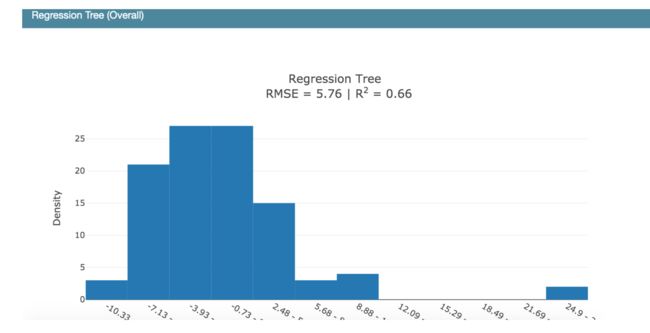
使用DashBoard展现不同模型的性能
lr_perf = RegressionPerf(lr.predict).explain_perf(X_test, y_test, name='Linear Regression')
rt_perf = RegressionPerf(rt.predict).explain_perf(X_test, y_test, name='Regression Tree')

show(lr_perf)
show(rt_perf)
show(ebm_perf)
与线性回归、决策树模型作比较,还是EBM的性能强大
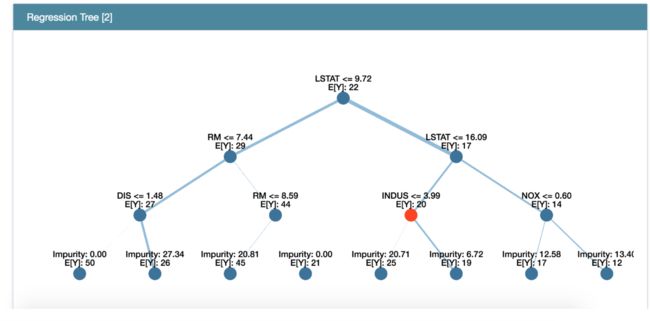
Glassbox:展示所有的模型都有全局和局部
lr_global = lr.explain_global(name='Linear Regression')
rt_global = rt.explain_global(name='Regression Tree')

show(lr_global)
show(rt_global)
show(ebm_global)
DashBoard仪表板:一次查看所有内容
show([marginal, lr_global, lr_perf, rt_global, rt_perf, ebm_global, ebm_perf])
完整代码请见:https://github.com/yanqiangmiffy/quincy-python-v2


