前言
本项目主要通过python的matplotlib pandas pyecharts等库对疫情数据进行可视化分析
数据来源:
- 本数据集来源于kaggle竞赛的开源数据集,数据集地址
- 本数据集主要涉及到全球疫情统计,包括确诊、治愈、死亡、时间、国家、地区等信息
功能函数
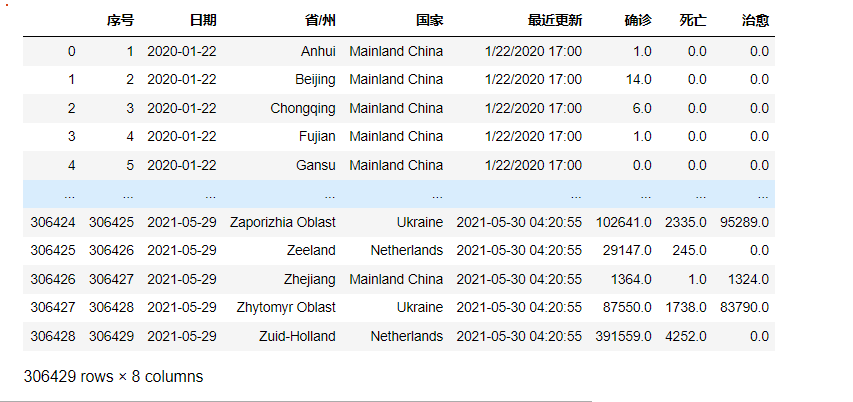
读取文件
df = pd.read_csv(r'C:\Users\Hasee\Desktop/covid_19_data.csv')
df.head()
更换列名,便于查看
cols= ['序号','日期','省/州','国家','最近更新','确诊','死亡','治愈']
df.columns = cols
df.日期 = pd.to_datetime(df.日期)
df
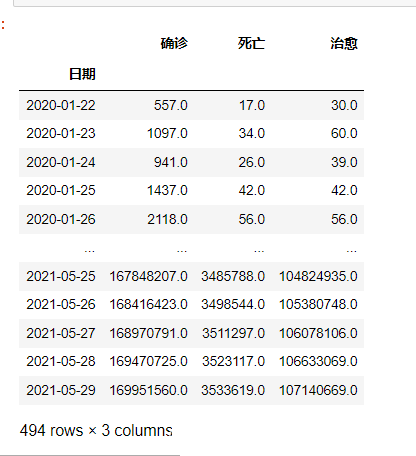
## 利用groupby按照日期统计确诊死亡治愈病例的总和
#合并同一天同国家日期
global_confirm = df.groupby('日期')[['确诊', '死亡', '治愈']].sum()
global_confirm
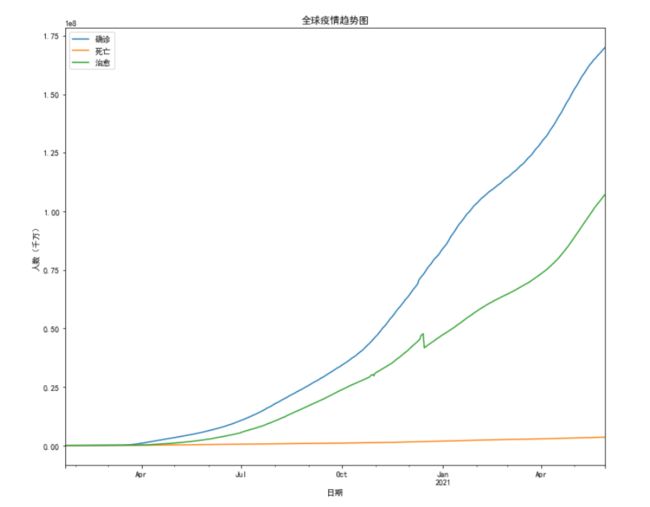
全球疫情趋势
ax = global_confirm.plot(figsize = (12,10), title = '全球疫情趋势图')
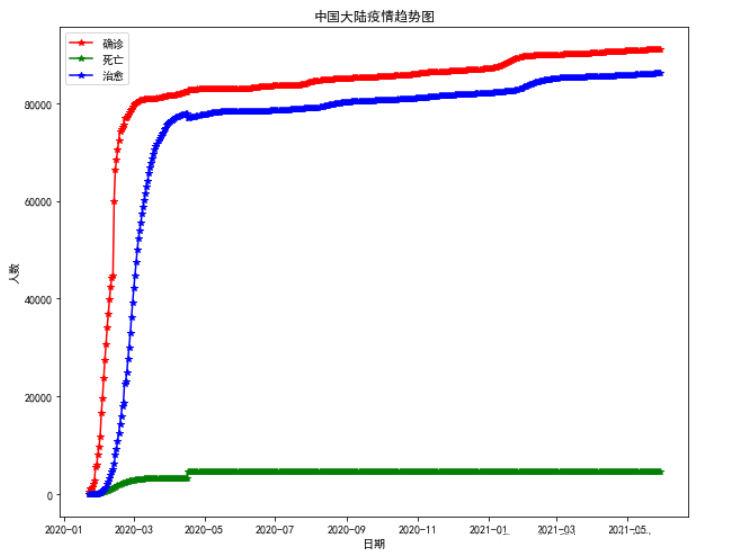
筛选出中国的数据
利用groupby按照日期统计确诊死亡治愈病例的总和
global_china = df[df['国家'] == 'Mainland China'].reset_index()
global_china_confirm  =  global_china.groupby('日期')[['确诊', '死亡', '治愈']].sum().reset_index()
画图,三条线组合到一个图
利用groupby按照省统计确诊死亡治愈病例的总和
global_china = df[df['国家'] == 'Mainland China'].reset_index()
global_china_province_confirm  =  global_china.groupby('省/州')[['确诊', '死亡', '治愈']].sum().reset_index()

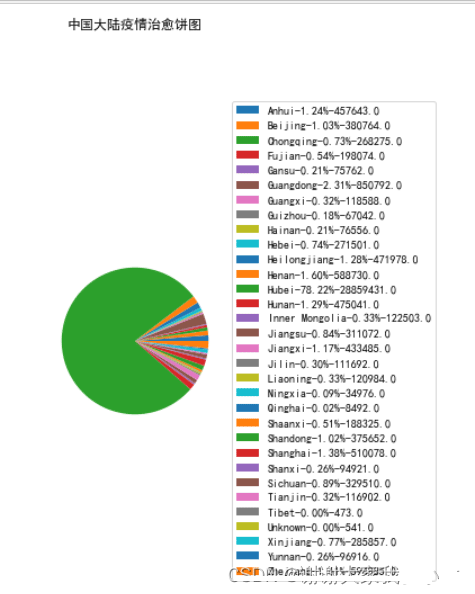
recovercent = 100.*global_china_province_confirm['治愈'] / global_china_province_confirm['治愈'].sum()
labels = ['{0}-{1:1.2f}%-{2}'.format(i,j,k) for i,j,k in zip(list(global_china_province_confirm['省/州']), recovercent, list(global_china_province_confirm['治愈']))]
plt.figure(figsize=(10,10))
plt.pie(global_china_province_confirm['治愈'],radius = 0.3)
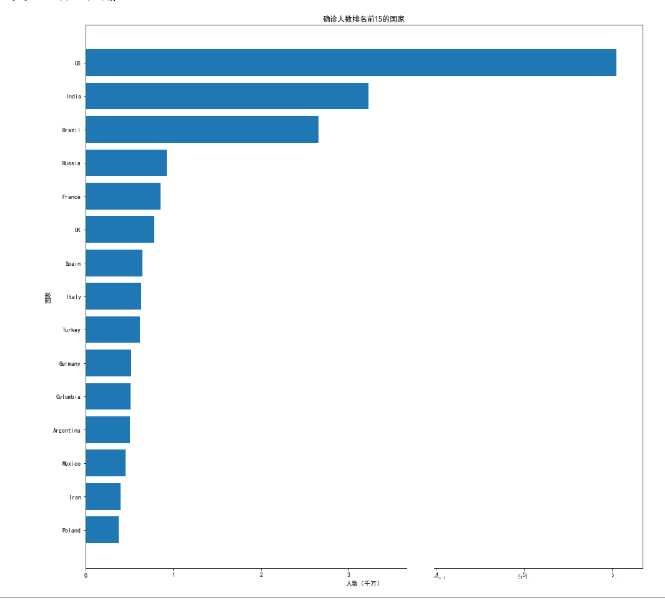
确诊人数排名前15的国家
plt.figure(figsize=(16,16))
plt.barh(list(global_country_confirm_rank.国家)[::-1], list(global_country_confirm_rank.确诊)[::-1])
plt.title('确诊人数排名前15的国家')
plt.xlabel('人数(千万)')
plt.ylabel('国家')
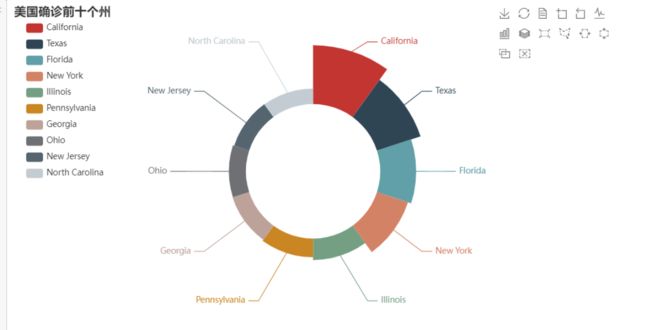
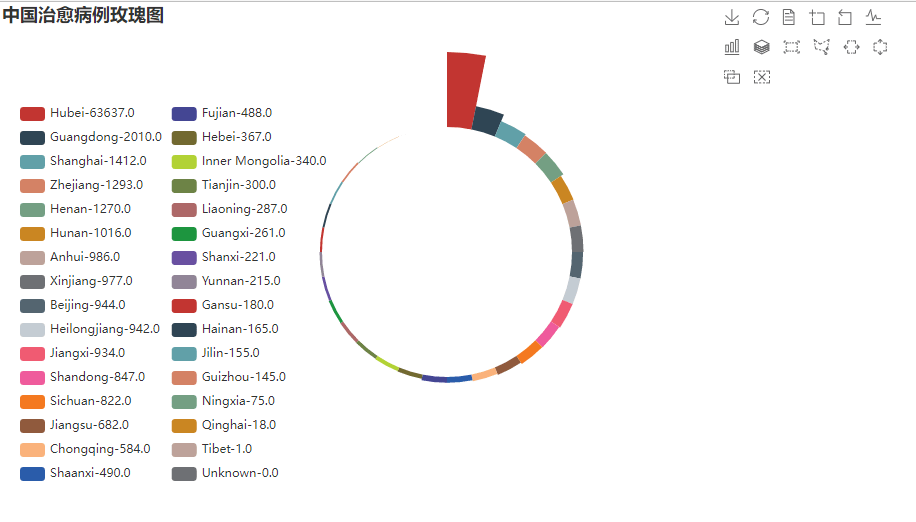
这里用pyecharts库画图,绘制的玫瑰图,rosetype
set_global_opts是设置格式:
中国确诊人数前十的省
china_confirm = df[df['国家'] == "Mainland China"]
china_latest = china_confirm[china_confirm['日期'] == max(china_confirm['日期'])]

words = WordCloud()
words.add('确诊人数', [tuple(dic) for dic in zip(list(china_latest['省/州']),list(china_latest['确诊']))], word_size_range=[20,100])
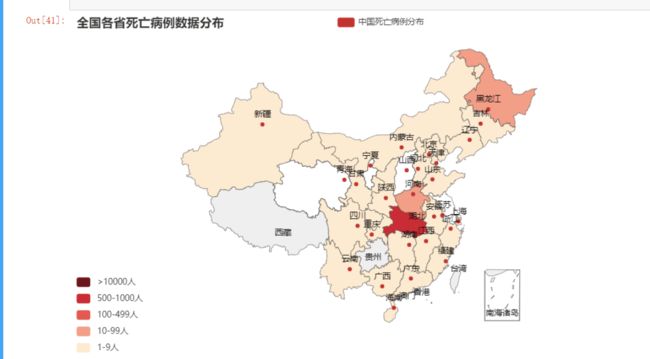
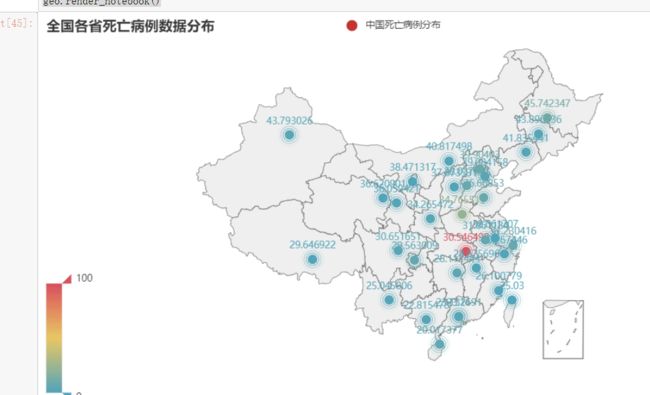
区域图
china_death = df[df['国家'] == "Mainland China"]
china_death_latest = china_death[china_death['日期'] == max(china_death['日期'])]
china_death_latest = china_death_latest.groupby('省/州')[['确诊', '死亡']].max().reset_index()
geo = Map()

geo.add("中国死亡病例分布", [list(z) for z in zip(china_death_prodic,list(china_death_latest['死亡']))], "china")
geo.set_global_opts(title_opts=opts.TitleOpts(title="全国各省死亡病例数据分布"),visualmap_opts=opts.VisualMapOpts(is_piecewise=True,
                    pieces=[
                    {"min": 1500, "label": '>10000人', "color": "#6F171F"},
                    {"min": 500, "max": 15000, "label": '500-1000人', "color": "#C92C34"},
                    {"min": 100, "max": 499, "label": '100-499人', "color": "#E35B52"},
                    {"min": 10, "max": 99, "label": '10-99人', "color": "#F39E86"},
                    {"min": 1, "max": 9, "label": '1-9人', "color": "#FDEBD0"}]))
geo.render_notebook()
热力图
geo = Geo()
geo.add_schema(maptype="china")

geo.add("中国死亡病例分布", [list(dic) for dic in zip(china_death_prodic,list(china_death_latest['死亡']))],type_=GeoType.EFFECT_SCATTER)
geo.set_global_opts(visualmap_opts=opts.VisualMapOpts(),title_opts=opts.TitleOpts(title="全国各省死亡病例数据分布"))
geo.render_notebook()
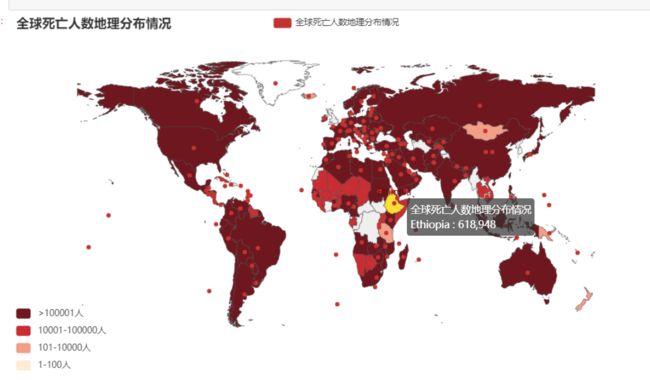
全球死亡人数地理分布情况
map = Map()
map.set_global_opts(title_opts=opts.TitleOpts(title="全球死亡人数地理分布情况"),visualmap_opts=opts.VisualMapOpts(is_piecewise=True,
                    pieces=[
                    {"min": 100001, "label": '>100001人', "color": "#6F171F"},
                    {"min": 10001, "max": 100000, "label": '10001-100000人', "color": "#C92C34"},
                    {"min": 1001, "max": 10000, "label": '1001-10000人', "color": "#E35B52"},
                    {"min": 101, "max": 10000, "label": '101-10000人', "color": "#F39E86"},
                    {"min": 1, "max": 100, "label": '1-100人', "color": "#FDEBD0"}]))
map.add("全球死亡人数地理分布情况", [list(z) for z in zip(global_death_n,list(global_death['死亡']))], "world")
map.set_series_opts(label_opts=opts.LabelOpts(is_show=False))
map.render_notebook()
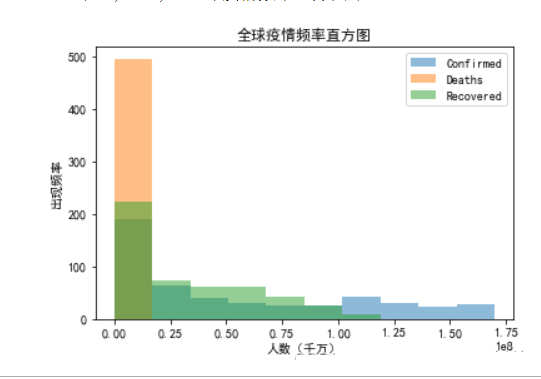
全球疫情频率直方图
global_confirm.plot.hist(alpha=0.5)
plt.xlabel('人数(千万)')
plt.ylabel('出现频率')
plt.title('全球疫情频率直方图')
其他图
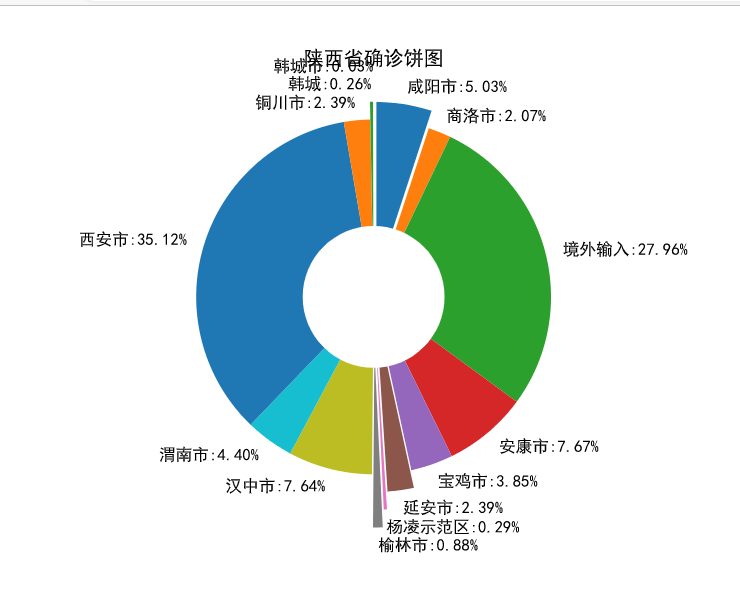
陕西确诊病例饼图
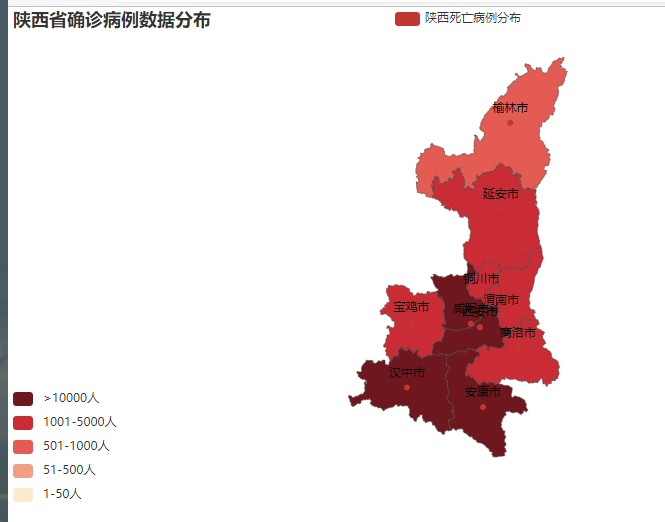
陕西省确诊病例数据分布
中国治愈病例玫瑰图
到此这篇关于Python疫情数据可视化分析的文章就介绍到这了,更多相关Python可视化内容请搜索脚本之家以前的文章或继续浏览下面的相关文章希望大家以后多多支持脚本之家!

