前言
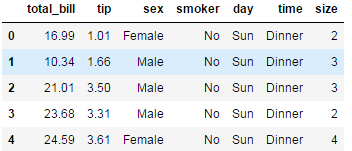
系统自带的数据表格,使用时通过sns.load_dataset('表名称')即可,结果为一个DataFrame。
print(sns.get_dataset_names())   #获取所有数据表名称
# ['anscombe', 'attention', 'brain_networks', 'car_crashes', 'diamonds', 'dots', 'exercise', 'flights',
# 'fmri', 'gammas', 'iris', 'mpg', 'planets', 'tips', 'titanic']
tips = sns.load_dataset('tips')  #导入小费tips数据表,返回一个DataFrame
tips.head()
一、直方图distplot()
distplot(a, bins=None, hist=True, kde=True, rug=False, fit=None,hist_kws=None, kde_kws=None, rug_kws=None,
fit_kws=None,color=None, vertical=False, norm_hist=False, axlabel=None,label=None, ax=None)
- a 数据源
- bins 箱数
- hist、kde、rug 是否显示箱数、密度曲线、数据分布,默认显示箱数和密度曲线不显示数据分析
- {hist,kde,rug}_kws 通过字典形式设置箱数、密度曲线、数据分布的各个特征
- norm_hist 直方图的高度是否显示密度,默认显示计数,如果kde设置为True高度也会显示为密度
- color 颜色
- vertical 是否在y轴上显示图标,默认为False即在x轴显示,即竖直显示
- axlabel 坐标轴标签
- label 直方图标签
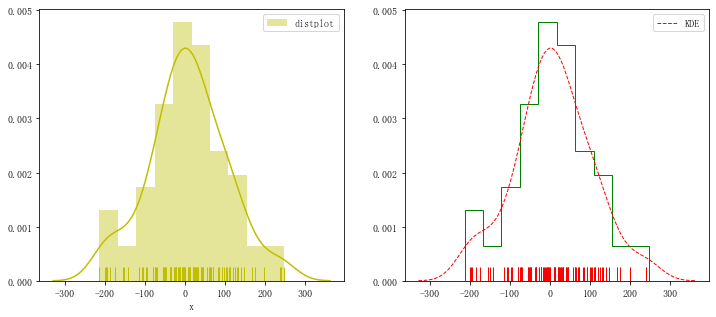
fig = plt.figure(figsize=(12,5))
ax1 = plt.subplot(121)
rs = np.random.RandomState(10)  # 设定随机数种子
s = pd.Series(rs.randn(100) * 100)
sns.distplot(s,bins = 10,hist = True,kde = True,rug = True,norm_hist=False,color = 'y',label = 'distplot',axlabel = 'x')
plt.legend()

ax1 = plt.subplot(122)
sns.distplot(s,rug = True,
             hist_kws={"histtype": "step", "linewidth": 1,"alpha": 1, "color": "g"},  # 设置箱子的风格、线宽、透明度、颜色,风格包括:'bar', 'barstacked', 'step', 'stepfilled'
             kde_kws={"color": "r", "linewidth": 1, "label": "KDE",'linestyle':'--'},   # 设置密度曲线颜色,线宽,标注、线形
             rug_kws = {'color':'r'} )  # 设置数据频率分布颜色
二、密度图
#密度曲线
kdeplot(data, data2=None, shade=False, vertical=False, kernel="gau",bw="scott", gridsize=100, cut=3, clip=None,
legend=True,cumulative=False,shade_lowest=True,cbar=False, cbar_ax=None,cbar_kws=None, ax=None, **kwargs)
- shade 是否填充与坐标轴之间的
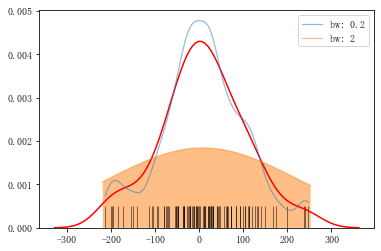
- bw 取值'scott' 、'silverman'或一个数值标量,控制拟合的程度,类似直方图的箱数,设置的数量越大越平滑,越小越容易过度拟合
- shade_lowest 主要是对两个变量分析时起作用,是否显示最外侧填充颜色,默认显示
- cbar 是否显示颜色图例
- n_levels 主要对两个变量分析起作用,数据线的个数
数据分布rugplot(a, height=.05, axis="x", ax=None, **kwargs)
- height 分布线高度
- axis {'x','y'},在x轴还是y轴显示数据分布
1.单个样本数据分布密度图
sns.kdeplot(s,shade = False, color = 'r',vertical = False)# 是否填充、设置颜色、是否水平
sns.kdeplot(s,bw=0.2, label="bw: 0.2",linestyle = '-',linewidth = 1.2,alpha = 0.5)
sns.kdeplot(s,bw=2, label="bw: 2",linestyle = '-',linewidth = 1.2,alpha = 0.5,shade=True)
sns.rugplot(s,height = 0.1,color = 'k',alpha = 0.5)  #数据分布
2.两个样本数据分布密度图
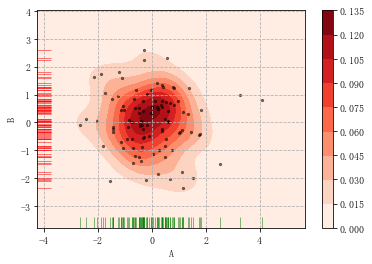
两个维度数据生成曲线密度图,以颜色作为密度衰减显示。
rs = np.random.RandomState(2)  # 设定随机数种子
df = pd.DataFrame(rs.randn(100,2),columns = ['A','B'])
sns.kdeplot(df['A'],df['B'],shade = True,cbar = True,cmap = 'Reds',shade_lowest=True, n_levels = 8)# 曲线个数(如果非常多,则会越平滑)
plt.grid(linestyle = '--')
plt.scatter(df['A'], df['B'], s=5, alpha = 0.5, color = 'k') #散点
sns.rugplot(df['A'], color="g", axis='x',alpha = 0.5) #x轴数据分布
sns.rugplot(df['B'], color="r", axis='y',alpha = 0.5) #y轴数据分布
rs1 = np.random.RandomState(2)
rs2 = np.random.RandomState(5)
df1 = pd.DataFrame(rs1.randn(100,2)+2,columns = ['A','B'])
df2 = pd.DataFrame(rs2.randn(100,2)-2,columns = ['A','B'])
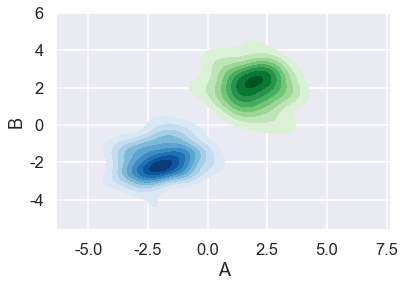
sns.set_style('darkgrid')
sns.set_context('talk')
sns.kdeplot(df1['A'],df1['B'],cmap = 'Greens',shade = True,shade_lowest=False)
sns.kdeplot(df2['A'],df2['B'],cmap = 'Blues', shade = True,shade_lowest=False)
三、散点图
jointplot() / JointGrid() / pairplot() /pairgrid()
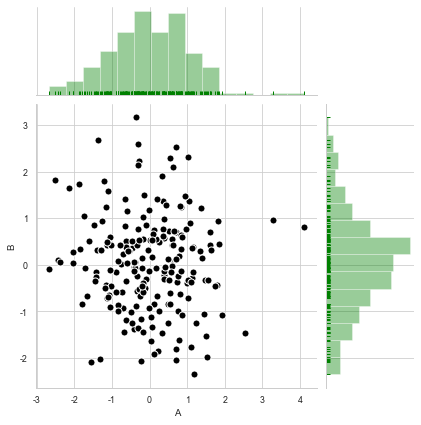
1.jointplot()综合散点图
rs = np.random.RandomState(2)
df = pd.DataFrame(rs.randn(200,2),columns = ['A','B'])

sns.jointplot(x=df['A'], y=df['B'],  # 设置x轴和y轴,显示columns名称
              data=df,   # 设置数据
              color = 'k',   # 设置颜色
              s = 50, edgecolor="w",linewidth=1,  # 设置散点大小、边缘线颜色及宽度(只针对scatter)
              kind = 'scatter',   # 设置类型:“scatter”、“reg”、“resid”、“kde”、“hex”
              space = 0.1,  # 设置散点图和上方、右侧直方图图的间距
              size = 6,   # 图表大小(自动调整为正方形)
              ratio = 3,  # 散点图与直方图高度比,整型
              marginal_kws=dict(bins=15, rug=True,color='green')  # 设置直方图箱数以及是否显示rug
              )
当kind分别设置为其他4种“reg”、“resid”、“kde”、“hex”时,图表如下:
sns.jointplot(x=df['A'], y=df['B'],data=df,kind='reg',size=5)  #
sns.jointplot(x=df['A'], y=df['B'],data=df,kind='resid',size=5) #
sns.jointplot(x=df['A'], y=df['B'],data=df,kind='kde',size=5) #
sns.jointplot(x=df['A'], y=df['B'],data=df,kind='hex',size=5) #蜂窝图
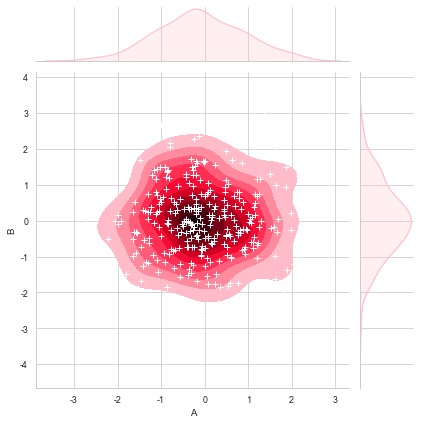
在密度图中添加散点图,先通过sns.jointplot()创建密度图并赋值给变量,再通过变量.plot_joint()在密度图中添加散点图。
rs = np.random.RandomState(15)
df = pd.DataFrame(rs.randn(300,2),columns = ['A','B'])
g = sns.jointplot(x=df['A'], y=df['B'],data = df, kind="kde", color="pink",shade_lowest=False) #密度图,并赋值给一个变量
g.plot_joint(plt.scatter,c="w", s=30, linewidth=1, marker="+")  #在密度图中添加散点图
2.拆分综合散点图JointGrid()
上述综合散点图可分为上、右、中间三部分,设置属性时对这三个参数都生效,JointGrid()可将这三部分拆开分别设置属性。
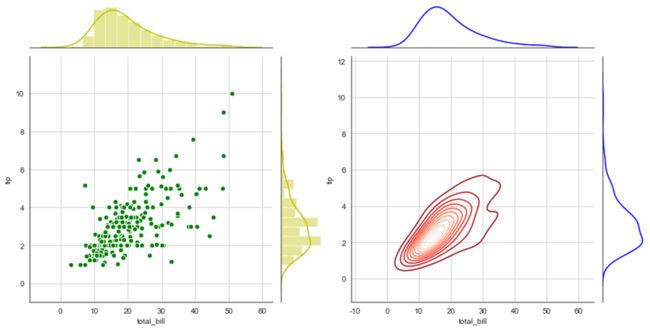
①拆分为中间+上&右 两部分设置
# plot_joint() + plot_marginals()
g = sns.JointGrid(x="total_bill", y="tip", data=tips)# 创建一个绘图区域,并设置好x、y对应数据
g = g.plot_joint(plt.scatter,color="g", s=40, edgecolor="white")   # 中间区域通过g.plot_joint绘制散点图
plt.grid('--')

g.plot_marginals(sns.distplot, kde=True, color="y")     #
h = sns.JointGrid(x="total_bill", y="tip", data=tips)# 创建一个绘图区域,并设置好x、y对应数据
h = h.plot_joint(sns.kdeplot,cmap = 'Reds_r')   # 中间区域通过g.plot_joint绘制散点图
plt.grid('--')
h.plot_marginals(sns.kdeplot, color="b")
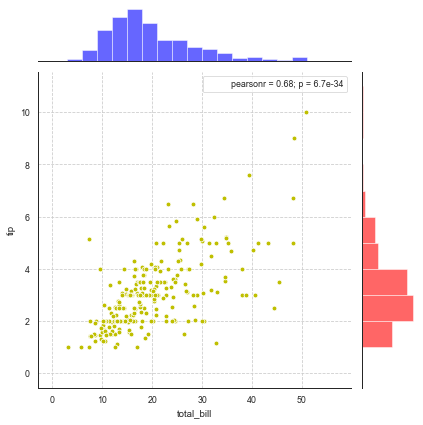
②拆分为中间+上+右三个部分分别设置
# plot_joint() + ax_marg_x.hist() + ax_marg_y.hist()

sns.set_style("white")# 设置风格
tips = sns.load_dataset("tips") # 导入系统的小费数据
print(tips.head())
g = sns.JointGrid(x="total_bill", y="tip", data=tips)# 创建绘图区域,设置好x、y对应数据

g.plot_joint(plt.scatter, color ='y', edgecolor = 'white')  # 设置内部散点图scatter
g.ax_marg_x.hist(tips["total_bill"], color="b", alpha=.6,bins=np.arange(0, 60, 3))  # 设置x轴直方图,注意bins是数组
g.ax_marg_y.hist(tips["tip"], color="r", alpha=.6, orientation="horizontal", bins=np.arange(0, 12, 1)) # 设置y轴直方图,需要orientation参数

from scipy import stats
g.annotate(stats.pearsonr)  # 设置标注,可以为pearsonr,spearmanr
plt.grid(linestyle = '--')
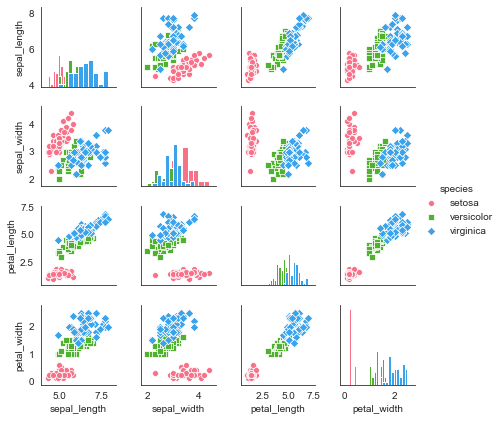
3.pairplot()矩阵散点图
矩阵散点图类似pandas的pd.plotting.scatter_matrix(...),将数据从多个维度进行两两对比。
对角线默认显示密度图,非对角线默认显示散点图。
sns.set_style("white")
iris = sns.load_dataset("iris")
print(iris.head())
sns.pairplot(iris,
            kind = 'scatter',  # 散点图/回归分布图 {‘scatter', ‘reg'}
            diag_kind="hist",  # 对角线处直方图/密度图 {‘hist', ‘kde'}
            hue="species",   # 按照某一字段进行分类
            palette="husl",  # 设置调色板
            markers=["o", "s", "D"],  # 设置不同系列的点样式(个数与hue分类的个数一致)
            height = 1.5,   # 图表大小
            )
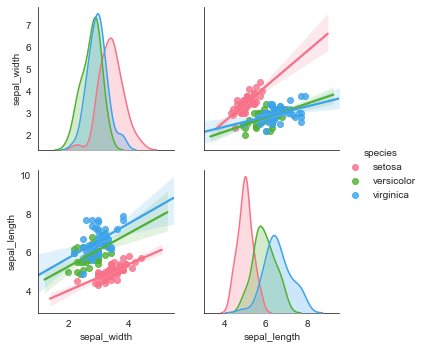
对原数据的局部变量进行分析,可添加参数vars
sns.pairplot(iris,vars=["sepal_width", "sepal_length"], kind = 'reg', diag_kind="kde", hue="species", palette="husl")
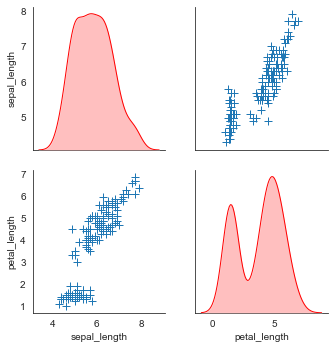
plot_kws()和diag_kws()可分别设置对角线和非对角线的显示:
sns.pairplot(iris, vars=["sepal_length", "petal_length"],diag_kind="kde", markers="+",
             plot_kws=dict(s=50, edgecolor="b", linewidth=1),# 设置非对角线点样式
             diag_kws=dict(shade=True,color='r',linewidth=1)# 设置对角线密度图样式
            )
4.拆分综合散点图JointGrid()
类似JointGrid()的功能,将矩阵散点图拆分为对角线和非对角线图表分别设置显示属性。
①拆分为对角线和非对角线
# map_diag() + map_offdiag()

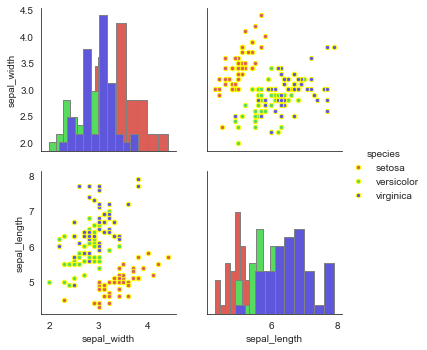
g = sns.PairGrid(iris,hue="species",palette = 'hls',vars=["sepal_width", "sepal_length"])
g.map_diag(plt.hist, # 对角线图表,plt.hist/sns.kdeplot
           histtype = 'barstacked',   # 可选:'bar', 'barstacked', 'step', 'stepfilled'
           linewidth = 1, edgecolor = 'gray')
g.map_offdiag(plt.scatter, # f非对角线其他图表,plt.scatter/plt.bar...
              edgecolor="yellow", s=20, linewidth = 1,   # 设置点颜色、大小、描边宽度)
②拆分为对角线+对角线上+对角线下 3部分设置
# map_diag() + map_lower() + map_upper()
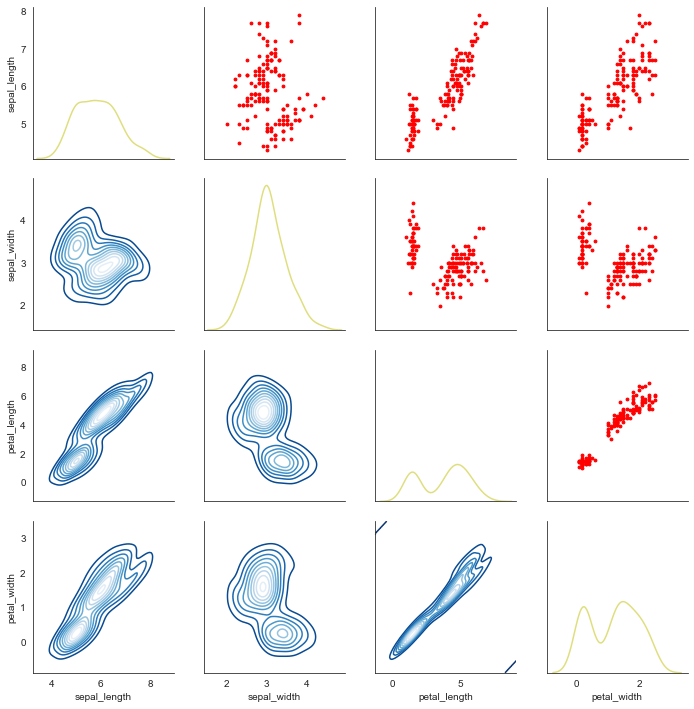
g = sns.PairGrid(iris)
g.map_diag(sns.kdeplot, lw=1.5,color='y',alpha=0.5)   # 设置对角线图表
g.map_upper(plt.scatter, color = 'r',s=8)     # 设置对角线上端图表显示为散点图
g.map_lower(sns.kdeplot,cmap='Blues_r') # 设置对角线下端图表显示为多密度分布图
到此这篇关于Python seaborn数据可视化绘图(直方图,密度图,散点图)的文章就介绍到这了,更多相关Python seaborn 绘图内容请搜索脚本之家以前的文章或继续浏览下面的相关文章希望大家以后多多支持脚本之家!
