机器学习项目实战:基于随机森林进行心脏病分类(含多种模型解释方法)
本项目是Kaggle上面的一个经典竞赛题,心脏病分类问题,题目链接在这里. 主要基于随机森林的bagging集成学习框架,通过13个生理特征数据,实现对心脏病分类的预测。
由于自己想要在这个项目更多的学习到模型解释方面的内容,所以对于模型精度没有过多的在意和调参。模型解释主要用了eli5,shap和部分依赖图。
下面是完整的代码和运行结果。在python3.7环境下可以运行。
文章目录
- 1 导入各种模块
- 2 导入数据
-
- 2.1 修改特征名称
- 2.2 特征说明
- 2.3 特征属性说明
- 3 建模
-
- 3.1 模型选择
- 3.2 随机森林绘图
- 4 模型评价
-
- 4.1 混淆矩阵
- 4.2 精确率,召回率,准确率
- 4.3 ROC和AUC
- 5 模型解释
-
- 5.1 基于eli5进行特征重要度排序
- 5.2 部份依赖图
- 5.3 shap值
1 导入各种模块
import numpy as np
import pandas as pd
import matplotlib.pyplot as plt
import seaborn as sns  # 画图
from sklearn.ensemble import RandomForestClassifier  # bagging的随机森林
from sklearn.tree import DecisionTreeClassifier   # 决策树模型
from sklearn.tree import export_graphviz   # 绘制决策树
from sklearn.metrics import roc_curve,auc   #  模型评价之ROC,AUC曲线
from sklearn.metrics import classification_report   # 决策树分类报告
from sklearn.metrics import confusion_matrix  # 混淆矩阵
from sklearn.model_selection import train_test_split  # 训练集划分

import eli5 #for purmutation importance
from eli5.sklearn import PermutationImportance
import shap #for SHAP values
from sklearn.inspection import plot_partial_dependence
2 导入数据
数据集点这里下载:数据集免费下载
dt = pd.read_csv('./heart.csv')
2.1 修改特征名称
dt.columns = ['age', 'sex', 'chest_pain_type', 'resting_blood_pressure', 'cholesterol', 'fasting_blood_sugar', 'rest_ecg', 'max_heart_rate_achieved',
       'exercise_induced_angina', 'st_depression', 'st_slope', 'num_major_vessels', 'thalassemia', 'target']
2.2 特征说明
| 特征名称 | 意义 | 数据说明 |
|---|---|---|
| age | 年龄 | 岁数 |
| sex | 性别 | 1:男;0:女 |
| chest_pain_type | 胸痛类别 | 1:典型胸痛;2:非典型胸痛;3:无胸痛;4:无症状 |
| resting_blood_pressure | 血压 | 单位mm |
| cholesterol | 胆固醇含量 | 单位:mg/dl |
| fasting_blood_sugar | 人的空腹血糖 | 1:大于120mg/dl;0:不大于120mg/dl |
| rest_ecg | 静息心电图测量 | 0 =正常;1 = ST-T波异常;2 = Estes标准可能或明确显示左室肥厚 |
| max_heart_rate_achieved | 最大心率 | |
| exercise_induced_angina | 运动引发的心绞痛 | 1=是;0=不是 |
| st_depressionoldpeak | 运动相对于休息引起的ST抑制 | |
| st_slope | 运动峰值ST段的斜率 | 1=上斜;2=平;3=下斜 |
| num_major_vessels | 主要血管的数量 | (0-3) |
| thalassemia | 地中海贫血的血液疾病 | 3=正常; 6=固定缺陷; 7 =可逆转缺陷 |
| target | 心脏病类别 | 1=有;0=没有 |
2.3 特征属性说明
# 展示前十个数据
dt.head(10)
| age | sex | chest_pain_type | resting_blood_pressure | cholesterol | fasting_blood_sugar | rest_ecg | max_heart_rate_achieved | exercise_induced_angina | st_depression | st_slope | num_major_vessels | thalassemia | target | |
|---|---|---|---|---|---|---|---|---|---|---|---|---|---|---|
| 0 | 63 | 1 | 3 | 145 | 233 | 1 | 0 | 150 | 0 | 2.3 | 0 | 0 | 1 | 1 |
| 1 | 37 | 1 | 2 | 130 | 250 | 0 | 1 | 187 | 0 | 3.5 | 0 | 0 | 2 | 1 |
| 2 | 41 | 0 | 1 | 130 | 204 | 0 | 0 | 172 | 0 | 1.4 | 2 | 0 | 2 | 1 |
| 3 | 56 | 1 | 1 | 120 | 236 | 0 | 1 | 178 | 0 | 0.8 | 2 | 0 | 2 | 1 |
| 4 | 57 | 0 | 0 | 120 | 354 | 0 | 1 | 163 | 1 | 0.6 | 2 | 0 | 2 | 1 |
| 5 | 57 | 1 | 0 | 140 | 192 | 0 | 1 | 148 | 0 | 0.4 | 1 | 0 | 1 | 1 |
| 6 | 56 | 0 | 1 | 140 | 294 | 0 | 0 | 153 | 0 | 1.3 | 1 | 0 | 2 | 1 |
| 7 | 44 | 1 | 1 | 120 | 263 | 0 | 1 | 173 | 0 | 0.0 | 2 | 0 | 3 | 1 |
| 8 | 52 | 1 | 2 | 172 | 199 | 1 | 1 | 162 | 0 | 0.5 | 2 | 0 | 3 | 1 |
| 9 | 57 | 1 | 2 | 150 | 168 | 0 | 1 | 174 | 0 | 1.6 | 2 | 0 | 2 | 1 |
# 特征数据类型
dt.dtypes
age                          int64
sex                          int64
chest_pain_type              int64
resting_blood_pressure       int64
cholesterol                  int64
fasting_blood_sugar          int64
rest_ecg                     int64
max_heart_rate_achieved      int64
exercise_induced_angina      int64
st_depression              float64
st_slope                     int64
num_major_vessels            int64
thalassemia                  int64
target                       int64
dtype: object
3 建模
3.1 模型选择
采用sklearn中的随机森林模型
# 切分训练集和测试集
X_train,X_test,y_train,y_test = train_test_split(dt.drop('target',1),dt['target'],test_size=0.2,random_state = 10)
# train the model
model = RandomForestClassifier(max_depth= 5)
# model = DecisionTreeClassifier(max_depth= 5)
model = model.fit(X_train,y_train)
feature_names = [i for i in X_train.columns]
print(feature_names)
y_train_str = y_train.astype('str')
y_train_str[y_train_str == '0'] = 'no disease'
y_train_str[y_train_str == '1'] = 'disease'
y_train_str = y_train_str.values
['age', 'sex', 'chest_pain_type', 'resting_blood_pressure', 'cholesterol', 'fasting_blood_sugar', 'rest_ecg', 'max_heart_rate_achieved', 'exercise_induced_angina', 'st_depression', 'st_slope', 'num_major_vessels', 'thalassemia']
3.2 随机森林绘图
由于随机森林是一种集成学习的方法,包含多个决策树,所以采用一棵树的形式展现。
estimator = model.estimators_[1] ## 第二棵树
export_graphviz(estimator, out_file='tree.dot',
                feature_names = feature_names,
                class_names = y_train_str,
                rounded = True, proportion = True,
                label='root',
                precision = 2, filled = True)

from subprocess import call
call(['dot', '-Tpng', 'tree.dot', '-o', 'tree.png', '-Gdpi=600'])

from IPython.display import Image
Image(filename = 'tree.png')
# 测试集预测
y_predict = model.predict(X_test)
y_pred_quant = model.predict_proba(X_test)[:, 1]  # 概率形式
print(y_pred_quant)
print(y_predict)
[0.16269787 0.44748633 0.40041271 0.76694297 0.24910602 0.74548823
 0.49200005 0.75311419 0.89932211 0.1549346  0.96559097 0.18668808
 0.59132509 0.80893958 0.2246534  0.74900495 0.15050619 0.00945674
 0.67502776 0.30255965 0.17225514 0.83713577 0.62405556 0.88069621
 0.36353612 0.26581345 0.02924095 0.07584574 0.83546613 0.02489596
 0.87005523 0.23022382 0.06858459 0.37906588 0.01819351 0.10303544
 0.76307864 0.44975844 0.74887615 0.21951679 0.06297115 0.29810484
 0.74734177 0.67051724 0.94183962 0.45715414 0.59805333 0.88940583
 0.76094355 0.54006929 0.48825986 0.81975331 0.04957972 0.25929068
 0.95305684 0.7351655  0.79543294 0.73187127 0.00626538 0.07273316
 0.71277042]
[0 0 0 1 0 1 0 1 1 0 1 0 1 1 0 1 0 0 1 0 0 1 1 1 0 0 0 0 1 0 1 0 0 0 0 0 1
 0 1 0 0 0 1 1 1 0 1 1 1 1 0 1 0 0 1 1 1 1 0 0 1]
4 模型评价
4.1 混淆矩阵
confusion_matrix = confusion_matrix(y_test, y_predict)
confusion_matrix
array([[28,  7],
       [ 4, 22]], dtype=int64)
4.2 精确率,召回率,准确率
total_num = sum(sum(confusion_matrix))
precise = confusion_matrix[0,0]/(confusion_matrix[0,0]+confusion_matrix[1,0])
recall = confusion_matrix[0,0]/(confusion_matrix[0,0]+confusion_matrix[0,1])
acc = (confusion_matrix[0,0]+confusion_matrix[1,1])/total_num

print('precise:',precise)
print('recall:',recall)
print('acc:',acc)
precise: 0.875
recall: 0.8
acc: 0.819672131147541
4.3 ROC和AUC
# 绘制ROC曲线
fpr,tpr,thresholds = roc_curve(y_test,y_pred_quant)

plt.plot(fpr,tpr)
plt.plot([0,1],[0,1],ls='--',color='gray')
plt.xlim([0.0,1.0])
plt.plot([0.0],[1.0])
plt.title('ROC curve for diabetes classifier')
plt.xlabel('False Positive Rate')
plt.ylabel('True Positive Rate')
plt.grid()
# AUC
auc(fpr,tpr)
0.9087912087912088
5 模型解释
5.1 基于eli5进行特征重要度排序
特征重要度排序就是对单个特征进行观察其对预测结果的影响。这一块的官方文档我还没有看,昨天思远和我解释了一下大概意思。这个weight是怎么计算的呢,就是对于特征一,随机打乱数据的顺序,观测新的预测结果和基准结果的变化程度,如果变化越大,及说明该特征的重要性越大,也就是最上面的绿色部分。如果是靠近下面的特征,就是不重要的特征。
基于这个特性,还可以采用这个方法进行降维、避免过拟合等等。
perm = PermutationImportance(model,random_state=1).fit(X_test,y_test)
eli5.show_weights(perm, feature_names = X_test.columns.tolist())
5.2 部份依赖图
# 单个依赖图
features = ['num_major_vessels','age','st_depression']
display = plot_partial_dependence(model, X_train, features,kind="both",  subsample=30,
       n_jobs=5, grid_resolution=5, random_state=0)
display.figure_.subplots_adjust(wspace=0.4, hspace=0.3)
# 2维(暂时没画出来)
features = ['st_slope','st_depression',('st_slope','st_depression')]
display = plot_partial_dependence(model, X_train, features,kind="both",  subsample=30,
       n_jobs=5, grid_resolution=5, random_state=0)
display.figure_.subplots_adjust(wspace=0.4, hspace=0.3)
5.3 shap值
shap值可以解释每个变量对预测结果的影响
explainer = shap.TreeExplainer(model)
shap_values = explainer.shap_values(X_test)

shap.summary_plot(shap_values[1],X_test,plot_type = 'bar')
横坐标为预测概率,每一个变量都有一行数据,越红表示数值越高,越蓝色表示数值越低。以血管数量为例,红色在左边,蓝色在右边,说明了数值越大,预测概率越低,即患病的风险越小。
shap.summary_plot(shap_values[1],X_test)
接下来,对于单个病人分析,各个特征是如何影响他的结果的
def heart_disease_risk_factors(model, patient):

    explainer = shap.TreeExplainer(model)
    shap_values = explainer.shap_values(patient)
    shap.initjs()
    return shap.force_plot(explainer.expected_value[1],shap_values[1],patient)
data_for_prediction = X_test.iloc[0,:].astype(float)
heart_disease_risk_factors(model,data_for_prediction)
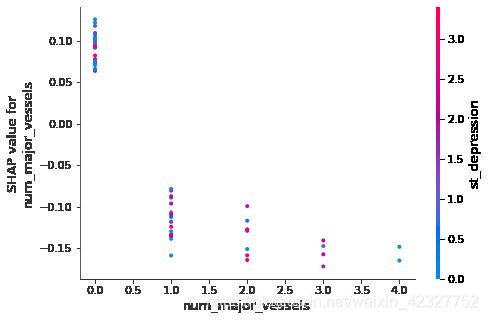
shap.dependence_plot('num_major_vessels', shap_values[1], X_test, interaction_index="st_depression")

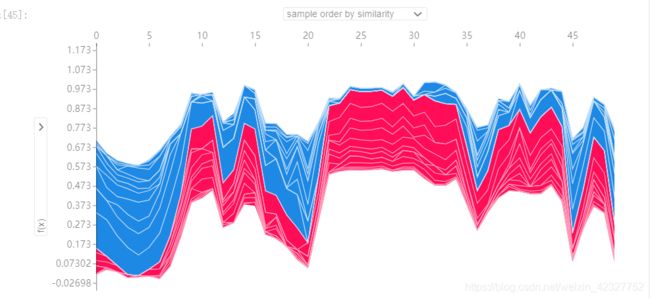
对于一批病人数据,例如50个,可以全面的观察各个特征对结果的影响,各个特征之间的影响,下图是一个可选图,可以自由选择横纵坐标,达到想要的目的。
shap_values = explainer.shap_values(X_train.iloc[:50])
shap.force_plot(explainer.expected_value[1], shap_values[1], X_test.iloc[:50])


