【机器学习】数据科学基础——机器学习基础实践(一)
【机器学习】数据科学基础——机器学习基础实践(一)
![]()
活动地址:[CSDN21天学习挑战赛](https://marketing.csdn.net/p/bdabfb52c5d56532133df2adc1a728fd)
作者简介:在校大学生一枚,华为云享专家,阿里云星级博主,腾云先锋(TDP)成员,云曦智划项目总负责人,全国高等学校计算机教学与产业实践资源建设专家委员会(TIPCC)志愿者,以及编程爱好者,期待和大家一起学习,一起进步~
.
博客主页:ぃ灵彧が的学习日志
.
本文专栏:机器学习
.
专栏寄语:若你决定灿烂,山无遮,海无拦
.
文章目录
- 【机器学习】数据科学基础——机器学习基础实践(一)
- 前言
-
-
- 什么是机器学习?
-
- 一、基于线性回归实现房价预测
-
- (一)、数据加载及预处理
- (二)、模型配置
- (三)、模型训练
- (四)、模型评估
- 小结
- 二、基于逻辑回归模型实现手写数字识别
-
- (一)、数据加载及预处理
- (二)、模型配置
- (三)、模型训练
- (四)、模型评估
- 总结
前言
什么是机器学习?
机器学习是人工智能领域内的一个重要分支,旨在通过计算的手段,利用经验来改善计算机系统的性能,通常,这里的经验即历史数据。从大量的数据中抽象出一个算法模型,然后将数据输入到模型中,得到模型对其的判断(例如类型、预测实数值等),也就是说,机器学习是一门主要研究学习算法的学科。
一、基于线性回归实现房价预测
导读:
线性回归,是机器学习领域一个非常经典的学习算法,主要用于对输入自变量产生一个对应的输出因变量值。
.
通常,因变量为实数范围内的数值类型数据,形式上,对于一个点集,用一条曲线去拟合其分布的过程,就叫作回归,而线性回归算法是指自变量之间通过一个线性组合便可得到因变量的预测结果的算法,是回归算法中最为简单的一种,对于一些线性可分的数据集,可以尝试使用线性回归模型进行建模。
(一)、数据加载及预处理
- 导入相关包:
# import paddle.fluid as fluid
import paddle
import numpy as np
import os
import matplotlib.pyplot as plt
- 设置paddle默认的全局数据类型为float64
#设置默认的全局dtype为float64
paddle.set_default_dtype("float64")
#下载数据
print('下载并加载训练数据')
train_dataset = paddle.text.datasets.UCIHousing(mode='train')
eval_dataset = paddle.text.datasets.UCIHousing(mode='test')
train_loader = paddle.io.DataLoader(train_dataset, batch_size=32, shuffle=True)
eval_loader = paddle.io.DataLoader(eval_dataset, batch_size = 8, shuffle=False)

print('加载完成')
(二)、模型配置
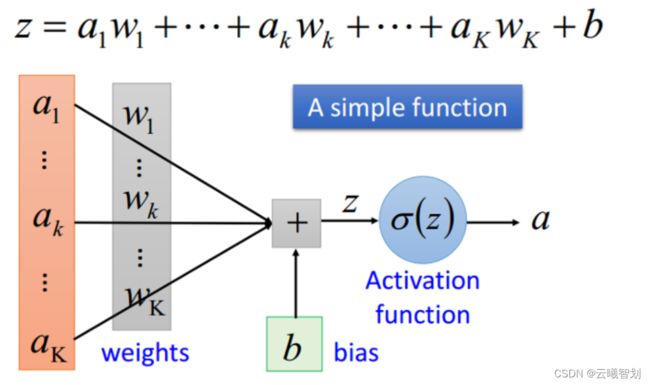
网络搭建:对于线性回归来讲,它就是一个从输入到输出的简单的全连接层。对于波士顿房价数据集,假设属性和房价之间的关系可以被属性间的线性组合描述。
定义连接网络:
# 定义全连接网络
class Regressor(paddle.nn.Layer):
    def __init__(self):
        super(Regressor, self).__init__()
        # 定义一层全连接层,输出维度是1,激活函数为None,即不使用激活函数
        self.linear = paddle.nn.Linear(13, 1, None)

    # 网络的前向计算函数
    def forward(self, inputs):
        x = self.linear(inputs)
        return x
Batch=0
Batchs=[]
all_train_accs=[]
def draw_train_acc(Batchs, train_accs):
    title="training accs"
    plt.title(title, fontsize=24)
    plt.xlabel("batch", fontsize=14)
    plt.ylabel("acc", fontsize=14)
    plt.plot(Batchs, train_accs, color='green', label='training accs')
    plt.legend()
    plt.grid()
    plt.show()

all_train_loss=[]
def draw_train_loss(Batchs, train_loss):
    title="training loss"
    plt.title(title, fontsize=24)
    plt.xlabel("batch", fontsize=14)
    plt.ylabel("loss", fontsize=14)
    plt.plot(Batchs, train_loss, color='red', label='training loss')
    plt.legend()
    plt.grid()
    plt.show()
(三)、模型训练
首先将训练集的特征值与回归值分开,然后实例化模型,调用fit()函数训练模型:
代码如下:
model=Regressor() # 模型实例化
model.train() # 训练模式
mse_loss = paddle.nn.MSELoss()
opt=paddle.optimizer.SGD(learning_rate=0.0005, parameters=model.parameters())

epochs_num=200 #迭代次数
for pass_num in range(epochs_num):
    for batch_id,data in enumerate(train_loader()):
        image = data[0]
        label = data[1]
        predict=model(image) #数据传入model
        # print(predict)
        # print(np.argmax(predict,axis=1))
        loss=mse_loss(predict,label)
        # acc=paddle.metric.accuracy(predict,label.reshape([-1,1]))#计算精度
        # acc = np.mean(label==np.argmax(predict,axis=1))

        if batch_id!=0 and batch_id%10==0:
            Batch = Batch+10
            Batchs.append(Batch)
            all_train_loss.append(loss.numpy()[0])
            # all_train_accs.append(acc.numpy()[0])
            print("epoch:{},step:{},train_loss:{}".format(pass_num,batch_id,loss.numpy()[0])  )
        loss.backward()
        opt.step()
        opt.clear_grad()   #opt.clear_grad()来重置梯度
paddle.save(model.state_dict(),'Regressor')#保存模型
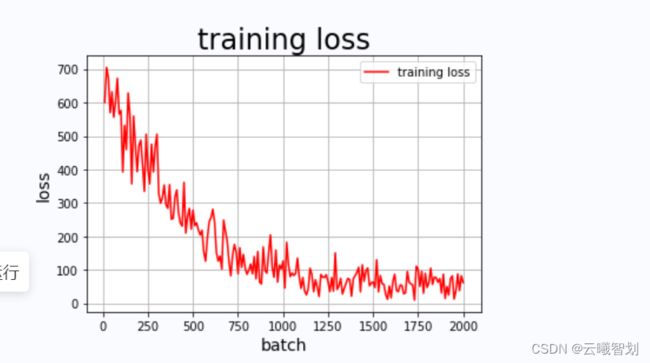
draw_train_loss(Batchs,all_train_loss)
模型训练过程中部分输出和损失值图像分别如下图1-1,1-2所示:
(四)、模型评估
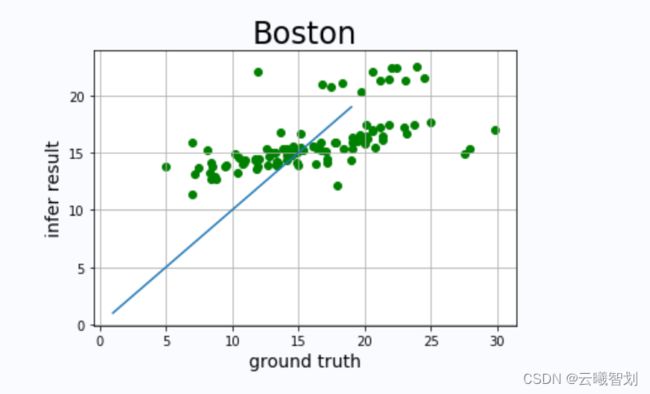
模型训练结束后,根据训练好的模型,在测试数据上进行评估。理想状态下,模型的预测值与真实值相等,即y’=y,即两者应该在直线y=x上分布,绘制图像,观察预测值与真实值与y=x直线的分布差异,可直观判断线性回归模型的性能:
- 模型评估:
#模型评估
para_state_dict = paddle.load("Regressor")
model = Regressor()
model.set_state_dict(para_state_dict) #加载模型参数
model.eval() #验证模式

losses = []
infer_results=[]
groud_truths=[]
for batch_id,data in enumerate(eval_loader()):#测试集
    image=data[0]
    label=data[1]
    groud_truths.extend(label.numpy())
    predict=model(image)
    infer_results.extend(predict.numpy())
    loss=mse_loss(predict,label)
    losses.append(loss.numpy()[0])
    avg_loss = np.mean(losses)
print("当前模型在验证集上的损失值为:",avg_loss)
损失值如下图1-3所示:
![]()
- 绘制真实值和预测值对比图:
#绘制真实值和预测值对比图
def draw_infer_result(groud_truths,infer_results):
    title='Boston'
    plt.title(title, fontsize=24)
    x = np.arange(1,20)
    y = x
    plt.plot(x, y)
    plt.xlabel('ground truth', fontsize=14)
    plt.ylabel('infer result', fontsize=14)
    plt.scatter(groud_truths, infer_results,color='green',label='training cost')
    plt.grid()
    plt.show()

draw_infer_result(groud_truths,infer_results)
真实值和预测值对比图如下图1-4所示:
小结
线性回归算法只能处理线性可分的数据,对于线性不可分数据,需要使用对数线性回归、广义线性回归或者其它回归算法。
二、基于逻辑回归模型实现手写数字识别
导读:
逻辑回归是线性回归的一个变体版本,虽然称作回归,但实际上是一种分类学习算法,无需事先假设数据的分布即可进行建模,避免了先验假设分布偏差带来的影响,并且得到的是近似概率预测,对需要概率结果辅助决策的任务十分友好。
.
逻辑回归使用极大似然估计进行参数学习,即最大化模型的对数似然值,使得每个样本属于真实标签的概率越大越好,该优化目标可以通过牛顿法、梯度下降法等求得最优解。
(一)、数据加载及预处理
- 导入相关包:
import struct,os
import numpy as np
from array import array as pyarray
from numpy import append, array, int8, uint8, zeros
import matplotlib.pyplot as plt

%matplotlib inline
- 定义加载MNIST数据集的函数:
def load_mnist(image_file, label_file, path="mnist"):
    digits=np.arange(10)

    fname_image = os.path.join(path, image_file)
    fname_label = os.path.join(path, label_file)

    flbl = open(fname_label, 'rb')
    magic_nr, size = struct.unpack(">II", flbl.read(8))
    lbl = pyarray("b", flbl.read())
    flbl.close()

    fimg = open(fname_image, 'rb')
    magic_nr, size, rows, cols = struct.unpack(">IIII", fimg.read(16))
    img = pyarray("B", fimg.read())
    fimg.close()

    ind = [ k for k in range(size) if lbl[k] in digits ]
    N = len(ind)

    images = zeros((N, rows*cols), dtype=uint8)
    labels = zeros((N, 1), dtype=int8)
    for i in range(len(ind)):
        images[i] = array(img[ ind[i]*rows*cols : (ind[i]+1)*rows*cols ]).reshape((1, rows*cols))
        labels[i] = lbl[ind[i]]

    return images, labels


train_image, train_label = load_mnist("train-images-idx3-ubyte", "train-labels-idx1-ubyte")
test_image, test_label = load_mnist("t10k-images-idx3-ubyte", "t10k-labels-idx1-ubyte")
- 定义图片展示函数:
import matplotlib.pyplot as plt

def show_image(imgdata,imgtarget,show_column, show_row):
    #注意这里的show_column*show_row==len(imgdata)
    for index,(im,it) in enumerate(list(zip(imgdata,imgtarget))):
        xx = im.reshape(28,28)
        plt.subplots_adjust(left=1, bottom=None, right=3, top=2, wspace=None, hspace=None)
        plt.subplot(show_row, show_column, index+1)
        plt.axis('off')
        plt.imshow(xx , cmap='gray',interpolation='nearest')
        plt.title('label:%i' % it)
# 显示训练集前50数字
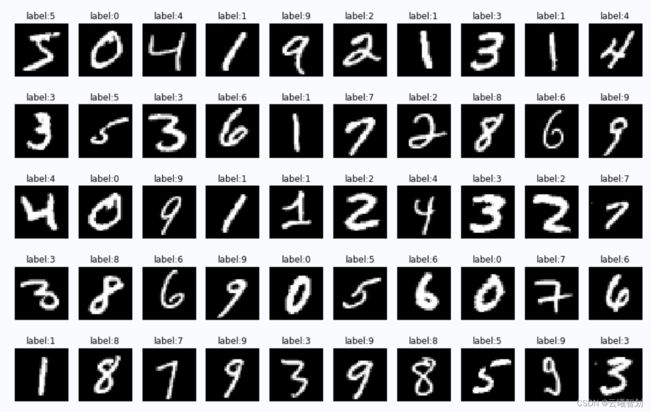
show_image(train_image[:50], train_label[:50], 10,5)
灰度图展示如图1-1所示:
(二)、模型配置
此处直接将sklearn.linear_model中的LogisticRegression导入即可,注意,虽然逻辑回归并没有直接建模输出y与输入特征x之间的映射关系,但它本质上是线性回归算法的一种变体,且回归参数w对于输入特征而言,仍是线性的,因此也属于线性模型的范畴
# 导入LogisticRegression类
from sklearn.linear_model import LogisticRegression

#实例化LogisticRegression类
lr = LogisticRegression()
(三)、模型训练
由于图片数据的像素值取值范围为0~255,过大的计算中可能导致计算结果非常大,或者梯度变化剧烈,因此不利于模型的学习与收敛。为避免上述情况出现,首先需要对训练数据做预处理,也就是尺度缩放,比如对每个像素值都除以最大像素值255,将所有像素值压缩到【0,1】的范围内,然后再进行学习。
# 数据缩放
train_image=[im/255.0 for im in train_image]
#训练模型
lr.fit(train_image,train_label)
(四)、模型评估
模型训练结束后,可在验证集或测试集上测试其性能。
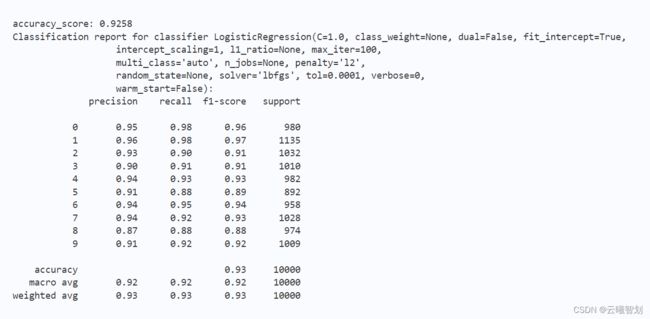
对于分类任务,最常见的评价指标包括准确率(Accuracy)、精确率(Precision)、召回率(Recall)、F1值(F1-Score)等。
其中,精确率反映正样本的判断准确率,召回率反映正样本中被实际识别的样本比例,而F值则是精确率与召回率的折中,在各类型样本数量不均衡时,该指标可以很好地反映模型的性能。
import matplotlib.pyplot as plt

def show_image(imgtestdata, imgtesttarget, show_column, show_row):
    #注意这里的show_column*show_row==len(imgtestdata)
    for index,(im,it) in enumerate(list(zip(imgtestdata, imgtesttarget))):
        xx = im.reshape(28,28)
        plt.subplots_adjust(left=1, bottom=None, right=3, top=4, wspace=None, hspace=None)
        plt.subplot(show_row, show_column, index+1)
        plt.axis('off')
        plt.imshow(xx , cmap='gray',interpolation='nearest')
        plt.title('predict:%i' % it)

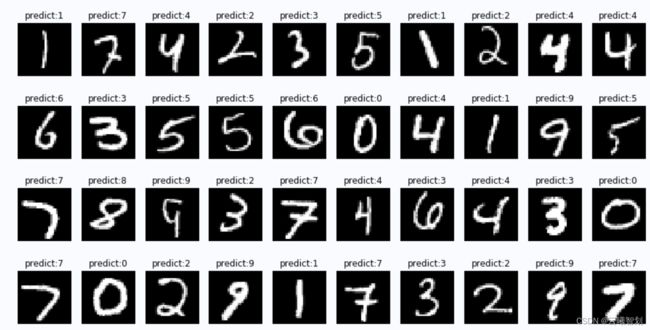
show_image(test_image[:100], predict, 10, 10)
输出结果如图2-1、2-2所示:
总结
经典的线性回归模型主要用来预测一些存在着线性关系的数据集。回归模型可以理解为:存在一个点集,用一条曲线去拟合它分布的过程。如果拟合曲线是一条直线,则称为线性回归。如果是一条二次曲线,则被称为二次回归。线性回归是回归模型中最简单的一种。
在线性回归中:
(1)假设函数是指,用数学的方法描述自变量和因变量之间的关系,它们之间可以是一个线性函数或非线性函数。 在本次线性回顾模型中,我们的假设函数为 Y’= wX+b ,其中,Y’表示模型的预测结果(预测房价),用来和真实的Y区分。模型要学习的参数即:w,b。
(2)损失函数是指,用数学的方法衡量假设函数预测结果与真实值之间的误差。这个差距越小预测越准确,而算法的任务就是使这个差距越来越小。 建立模型后,我们需要给模型一个优化目标,使得学到的参数能够让预测值Y’尽可能地接近真实值Y。这个实值通常用来反映模型误差的大小。不同问题场景下采用不同的损失函数。 对于线性模型来讲,最常用的损失函数就是均方误差(Mean Squared Error, MSE)。
(3)优化算法:神经网络的训练就是调整权重(参数)使得损失函数值尽可能得小,在训练过程中,将损失函数值逐渐收敛,得到一组使得神经网络拟合真实模型的权重(参数)。所以,优化算法的最终目标是找到损失函数的最小值。而这个寻找过程就是不断地微调变量w和b的值,一步一步地试出这个最小值。 常见的优化算法有随机梯度下降法(SGD)、Adam算法等等
本系列文章内容为根据清华社初版的《机器学习实践》所作的相关笔记和感悟,其中代码均为基于百度飞浆开发,若有任何侵权和不妥之处,请私信于我,定积极配合处理,看到必回!!!
最后,引用本次活动的一句话,来作为文章的结语~( ̄▽ ̄~)~:
【学习的最大理由是想摆脱平庸,早一天就多一份人生的精彩;迟一天就多一天平庸的困扰。】
![]()
