跨模态检索评价指标,pr曲线,map
跨模态检索评价指标
精确率,准确率,召回率,混淆矩阵
以二分类算法为基础
TN:算法预测为负例(N),实际上也是负例(N)的个数,即算法预测对了(True);
FP:算法预测为正例(P),实际上是负例(N)的个数,即算法预测错了(False);
FN:算法预测为负例(N),实际上是正例(P)的个数,即算法预测错了(False);
TP:算法预测为正例(P),实际上也是正例(P)的个数,即算法预测对了(True)
混淆矩阵
| 预测值 0 | 预测值 1 | |
|---|---|---|
| 真实值 0 | TN | FP |
| 真实值 1 | FN | TP |
- 准确率: a c c u r a c y = ( T P + T N ) ( T P + T N + T P + F N ) accuracy = \frac{(TP + TN)} { (TP + TN + TP + FN)} accuracy=(TP+TN+TP+FN)(TP+TN) 预测正确的总数/总样本数
- 精确率: p e r c i s i o n = T P ( T P + F P ) percision = \frac{TP} {(TP + FP)} percision=(TP+FP)TP 预测值为1且正确的数目/预测为1的总数
- 召回率: r e c a l l = T P ( T P + F N ) recall = \frac{TP} { (TP + FN)} recall=(TP+FN)TP 预测值为1且正确的数目/真实值为1的总数
代码,使用sklearn.metrics中的confusion_matrix
from sklearn.metrics import confusion_matrix
label = np.random.randint(0, 3, (1,5)).squeeze(0)
predict = np.random.randint(0, 3, (1,5)).squeeze(0)
label = array([1, 1, 0, 1, 2])
predict = array([0, 2, 0, 0, 2])
cf = confusion_matrix(label, predict).astype(float)
预测: 0 1 2 标签
array([[1., 0., 0.], 0
[2., 0., 1.], 1
[0., 0., 1.]]) 2
# 准确率
acc = np.diag(cf).sum()/cf.sum()

# 精确率
per = np.diag(cf)/cf.sum(axis=0) # 按列求和

# 召回率
rec = np.diag(cf)/cf.sum(axis=1) # 按行求和
评价指标的论文:paper
map
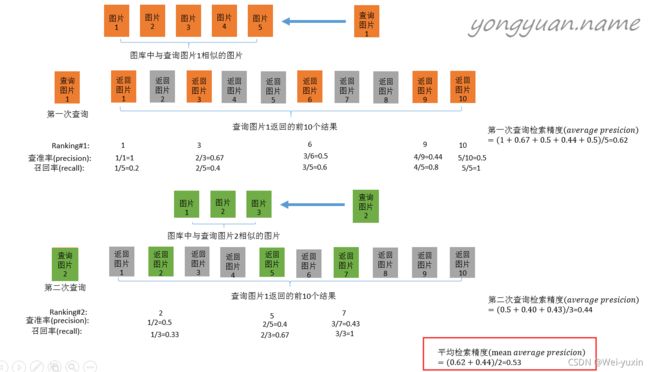
mean average precision,平均精度
检索任务的percision、recall和分类任务的略有不同。分类任务中使用预测分数排序,检索任务中使用特征的近似度排序。
p e r c i s i o n = ∑ i = 1 k Re i k percision = \frac{\sum_{i=1}^{k} \operatorname{Re}_{i}}{k} percision=k∑i=1kRei
A P = 1 n ( Re ) ∑ k = 1 Re k ∑ i = 1 k Re i k A P=\frac{1}{n(\operatorname{Re})} \sum_{k=1} \operatorname{Re}_{k} \frac{\sum_{i=1}^{k} \operatorname{Re}_{i}}{k} AP=n(Re)1∑k=1Rekk∑i=1kRei
- n ( R e ) n(Re) n(Re) 相关项的总数
- k k k 第k个位置
- R e k Re_k Rek 当第k个位置为相关项时, R e k = 1 Re_k = 1 Rek=1。为无关项时, R e k = 0 Re_k = 0 Rek=0。
代码-1
代码写法来自:DSCMR-evaluate,稍作修改
# q1为查询集,q2为数据库,计算map@k,检索前k个结果(默认检索所有值)
from scipy.spatial.distance import cdist
def calc_map_1(q1, q2, label1, label2, k = 0):
    """calculate mAP for retrieval
    Args:
        q1: query feature/hash matrix
        q2: retrieval feature/hash matrix
        label1: query label matrix
        label2: retrieval label matrix
    """
    dist = cdist(q1, q2, 'cosine')  # 求距离,生成一个[q1,q2]维度的矩阵
    ord = dist.argsort()  # 排序,对dist从小到大排序,并返回距离的索引
    numcases = dist.shape[0]  # 查询的个数
    if k == 0:
        k = dist.shape[1]
    res = []
    for i in range(numcases):  #  第一个循环,查询numcases次
        order = ord[i]
        p = 0.0
        r = 0.0
        for j in range(k):  #  第二个循环,计算一次查询的ap
            if label1[i] == label2[order[j]]:  # 相关项时
                r += 1  # 第i张图片
                p += (r / (j + 1))  # j+1 第i张图片的位置
        if r > 0:
            res += [p / r]
        else:
            res += [0]
    return np.mean(res)
循环完j次后,p 对应公式: 1 n ( Re ) ∑ k = 1 Re k ∑ i = 1 k Re i k \frac{1}{n(\operatorname{Re})} \sum_{k=1} \operatorname{Re}_{k} \frac{\sum_{i=1}^{k} \operatorname{Re}_{i}}{k} n(Re)1∑k=1Rekk∑i=1kRei
代码-2
代码的写法来自,博客
from scipy.spatial.distance import cdist

def calc_mAP_2(qF, rF, qL, rL, k=-1):
    """calculate mAP for retrieval
    Args:
        qF: query feature/hash matrix
        rF: retrieval feature/hash matrix
        qL: one-hot query label matrix
        rL: one-hot retrieval label matrix
        k: mAP@k, default `-1` means mAP@ALL
    """
    n_query = qF.shape[0]
    if k == -1 or k > rF.shape[0]:
        k = rF.shape[0]

    Gnd = np.dot(qL, rL.T) # 计算两个查询和检索标签的乘积,标签相同的值为1

    Rank = np.argsort(cdist(qF, rF, 'cosine'))


    AP = 0.0
    for it in range(n_query):
        gnd = Gnd[it]
        if np.sum(gnd) == 0:
            continue
        rank = Rank[it][:k]
        gnd = gnd[rank]
        if np.sum(gnd) == 0:
            continue

        # 获取非零的索引,+1因为索引从0开始
        # 非零元素的位置
        pos = np.asarray(np.where(gnd == 1.)) + 1.0
        rel_cnt = np.arange(pos.shape[-1]) + 1.0
        AP += np.mean(rel_cnt / pos)

    mAP = AP / n_query
    return mAP
pos,元素的位置,对应公式中的 k k k
rel_cnt,召回的个数,对应公式 $\sum_{k=1}\operatorname{Re}_{k} $
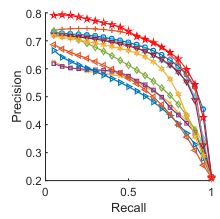
precision-recall curves
- 横坐标为查全率,纵坐标为精确率
- PR曲线越靠近右上角,说明模型效果越好
- PR曲线的面积就是average precision,AveP = ∑ k = 1 n P ( k ) Δ r ( k ) =\sum_{k=1}^{n} P(k) \Delta r(k) =∑k=1nP(k)Δr(k)
cross-model中的PR曲线绘制方法:
横坐标为Recall的平均值,纵坐标为Percision的平均值
对于查询样本,求出其[Percision@1, Percision@2, …, Percision@K] 与 [Recall@1, Recall@2, …, Recall@K]
R e c a l l @ K = ∑ i = 1 k R e i n ( R e ) Recall@K = \frac{\sum_{i=1}^{k} Re_{i}}{n(Re)} Recall@K=n(Re)∑i=1kRei, P e r c i s i o n @ K = ∑ i = 1 k R e i k Percision@K = \frac{\sum_{i=1}^{k} Re_{i}}{k} Percision@K=k∑i=1kRei
然后取所有查询样本的平均值
代码
代码参考自,博客
import matplotlib.pyplot as plt
import numpy as np
from scipy.spatial.distance import cdist
def pr_curve(qF, rF, qL, rL, what=0, topK=-1):
    n_query = qF.shape[0]
    if topK == -1 or topK > rF.shape[0]:  # top-K 之 K 的上限
        topK = rF.shape[0]

    Gnd = (np.dot(qL, rL.transpose()) > 0).astype(np.float32)
    if what == 0:
        Rank = np.argsort(cdist(qF, rF, 'cosine'))
    else:
        Rank = np.argsort(cdist(qF, rF, 'hamming'))

    P, R = [], []
    for k in range(1, topK + 1):  # 枚举 top-K 之 K
        # ground-truth: 1 vs all
        p = np.zeros(n_query)  # 各 query sample 的 Precision@R
        r = np.zeros(n_query)  # 各 query sample 的 Recall@R
        for it in range(n_query):  # 枚举 query sample
            gnd = Gnd[it]
            gnd_all = np.sum(gnd)  # 整个被检索数据库中的相关样本数
            if gnd_all == 0:
                continue
            asc_id = Rank[it][:k]

            gnd = gnd[asc_id]
            gnd_r = np.sum(gnd)  # top-K 中的相关样本数

            p[it] = gnd_r / k   # 求出所有查询样本的Percision@K
            r[it] = gnd_r / gnd_all  # 求出所有查询样本的Recall@K


        P.append(np.mean(p))
        R.append(np.mean(r))


	# 画 P-R 曲线
    fig = plt.figure(figsize=(5, 5))
    plt.plot(R, P)  # 第一个是 x,第二个是 y
    plt.grid(True)
    plt.xlim(0, 1)
    plt.ylim(0, 1)
    plt.xlabel('recall')
    plt.ylabel('precision')
    # plt.legend()
    plt.show()
precision-scope curves
曲线图:
和PR曲线对比,其中横坐标为scop (the top K retrieved samples)
代码
将PR图和PS图绘制在一起
import matplotlib.pyplot as plt
import numpy as np
from scipy.spatial.distance import cdist
def draw(qF, rF, qL, rL, what=0, topK=-1):
    n_query = qF.shape[0]
    if topK == -1 or topK > rF.shape[0]:  # top-K 之 K 的上限
        topK = rF.shape[0]

    Gnd = (np.dot(qL, rL.transpose()) > 0).astype(np.float32)
    if what == 0:
        Rank = np.argsort(cdist(qF, rF, 'cosine'))
    else:
        Rank = np.argsort(cdist(qF, rF, 'hamming'))

    P, R = [], []
    for k in range(1, topK + 1):  # 枚举 top-K 之 K
        # ground-truth: 1 vs all
        p = np.zeros(n_query)  # 各 query sample 的 Precision@R
        r = np.zeros(n_query)  # 各 query sample 的 Recall@R
        for it in range(n_query):  # 枚举 query sample
            gnd = Gnd[it]
            gnd_all = np.sum(gnd)  # 整个被检索数据库中的相关样本数
            if gnd_all == 0:
                continue
            asc_id = Rank[it][:k]

            gnd = gnd[asc_id]
            gnd_r = np.sum(gnd)  # top-K 中的相关样本数

            p[it] = gnd_r / k   # 求出所有查询样本的Percision@K
            r[it] = gnd_r / gnd_all  # 求出所有查询样本的Recall@K


        P.append(np.mean(p))
        R.append(np.mean(r))

    S = np.arange(topK)
    S = S.tolist()

    fig = plt.figure()
    ax1 = fig.add_subplot(221)
    ax1.plot(R, P)  # 第一个是 x,第二个是 y
    ax1.set_title('precision-recall')

    ax2 = fig.add_subplot(222)
    ax2.plot(S, P)  # 第一个是 x,第二个是 y
    ax2.set_title('precision-scope')

    plt.show()


