python基础知识打卡第十七天——pandas基础知识总结
pandas基础知识总结
本文参考了pandas基础知识
Pandas基于NumPy实现,常与NumPy和Matplotlib一同使用。pandas有两种数据结构:Series和DataFrame.
1、Series
1.1、创建Series
series类型有一组相对应的数据及其索引构成,可以由:Python列表、标量值。Python字典、ndarray和其他函数创建。创建Series主要使用pd.Series()函数。
import pandas as pd
countries = ['中国', '美国', '澳大利亚']
countries_s = pd.Series(countries)
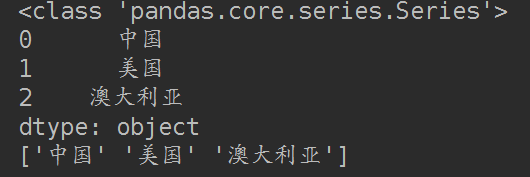
print(type(countries_s))
print(countries_s)
print(countries_s.values)
1.2、添加索引名
import pandas as pd
country_dicts = {'CH': '中国',
                'US': '美国',
                'AU': '澳大利亚'}

country_dict_s = pd.Series(country_dicts)
# 给索引命名
country_dict_s.index.name = 'index'
# 给数据命名
country_dict_s.name = 'Country'

print(country_dict_s)
print(country_dict_s.values)
print(country_dict_s.index)

可以简单地理解为,series类型就是一个一维的带索引的数组。
2、DataFrame类型
DataFrame类型就是Pandas库的二维数据类型,多列数据共用一套索引。
import pandas as pd

country1 = pd.Series({'Name': '中国',
                    'Language': 'Chinese',
                    'Area': '9.597M km2',
                     'Happiness Rank': 79})

country2 = pd.Series({'Name': '美国',
                    'Language': 'English (US)',
                    'Area': '9.834M km2',
                     'Happiness Rank': 14})

country3 = pd.Series({'Name': '澳大利亚',
                    'Language': 'English (AU)',
                    'Area': '7.692M km2',
                     'Happiness Rank': 9})

df = pd.DataFrame([country1, country2, country3])
print(df)
print('df.values=',df.values)
print(type(df['Area']))
print('area values=',df['Area'].values)
print(df[['Name','Area']])
print(df[['Name','Area']].values)

#操作原数据,要用copy,否则会改变原数据
rank=df['Happiness Rank'].values.copy()
rank+=2
print(df['Happiness Rank'].values)

- 增加一列
country_1 = pd.Series({'Name': '中国',
                        'Language': '汉语',
                        'Area': '11111'})
country_2 = pd.Series({'Name': '美国',
                        'Language': '英语',
                        'Area': '222'})
country_3 = pd.Series({'Name': '澳大利亚',
                        'Language': '英语',
                        'Area': '333'})
# print(country_1)

df=pd.DataFrame([country_1,country_2,country_3],index=['CH','US','AU'])
print(df)
print('------------------------------------')
print(df.columns)
print('------------------------------------')
#
#增加一列  按列索引
df['location']='地球'
print(df)
df['region']=['亚洲','北美洲','大洋洲']
print(df)
输出结果:
        Name Language   Area
CH    中国       汉语  11111
US    美国       英语    222
AU  澳大利亚       英语    333
------------------------------------
Index(['Name', 'Language', 'Area'], dtype='object')
------------------------------------
    Name Language   Area location
CH    中国       汉语  11111       地球
US    美国       英语    222       地球
AU  澳大利亚       英语    333       地球
    Name Language   Area location region
CH    中国       汉语  11111       地球     亚洲
US    美国       英语    222       地球    北美洲
AU  澳大利亚       英语    333       地球    大洋洲
- 转置,删除
country_1 = pd.Series({'Name': '中国',
                        'Language': '汉语',
                        'Area': '11111'})
country_2 = pd.Series({'Name': '美国',
                        'Language': '英语',
                        'Area': '222'})
country_3 = pd.Series({'Name': '澳大利亚',
                        'Language': '英语',
                        'Area': '333'})
# print(country_1)

df=pd.DataFrame([country_1,country_2,country_3],index=['CH','US','AU'])
print(df)
#转换行和列
print('====================================')
print(df.T)
#删除数据
print('====================================')
print(df.drop(['CH']))
print('====================================')
print(df)
#注意 drop操作不会改变原有数据的
结果:
   Name Language   Area
CH    中国       汉语  11111
US    美国       英语    222
AU  澳大利亚       英语    333
====================================
             CH   US    AU
Name         中国   美国  澳大利亚
Language     汉语   英语    英语
Area      11111  222   333
====================================
    Name Language Area
US    美国       英语  222
AU  澳大利亚       英语  333
====================================
    Name Language   Area
CH    中国       汉语  11111
US    美国       英语    222
AU  澳大利亚       英语    333
- 读csv,index_col
import pandas as pd

# 使用index_col指定索引列
# 使用usecols指定需要读取的列
reprot_2016_df = pd.read_csv('./2016.csv',
                             index_col='Country',
                             usecols=['Country', 'Happiness Rank', 'Happiness Score', 'Region'])
# 数据预览
print(reprot_2016_df.head())
print(reprot_2016_df.values[:2,:])

reprot_2016_df = pd.read_csv('./2016.csv',
                             usecols=['Country', 'Happiness Rank', 'Happiness Score', 'Region'])
# 数据预览
print('==============================================')
print(reprot_2016_df.head())
print(reprot_2016_df.values[:2,:])

print('==============================================')
print(reprot_2016_df[['Region','Happiness Rank']].values[:2,:])

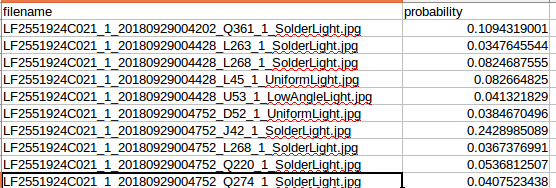
- 读取csv的第二种方式
df_xc = pd.read_csv('../submit/submit_LF2551924C021_1007_xc.csv').copy()  # 瑕疵结果
    print('len(df_xc)=',len(df_xc))
    newdict = {}
    for index, row in df_xc.iterrows():
        if index<1:
            name = '_'.join(row.filename.split('_')[2:6])
            print('===================')
            print('row')
            print(row)
            print('====================')
            print('name=',name)
            if name not in newdict.keys():
                newdict[name] = [row.probability]
            else:
                newdict[name].append(row.probability)
        break
- pd.query
from numpy.random import randn
from pandas import DataFrame
df = pd.DataFrame(randn(5, 2), columns=list('ab'))
print(df)
print(df.query('a > b'))
print(df.query('a > 0.2'))

- 列名重命名
import pandas as pd
reprot_2016_df = pd.read_csv('./2016.csv',
usecols=['Country', 'Happiness Rank', 'Happiness Score', 'Region'])
# 数据预览
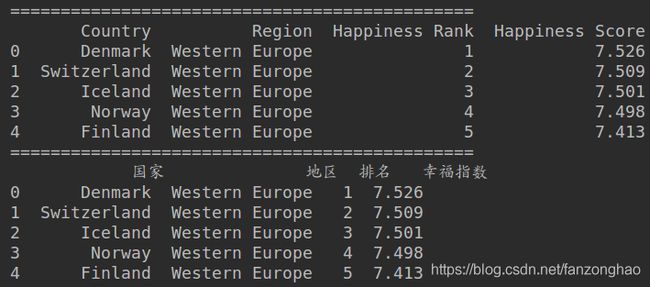
print('==============================================')
print(reprot_2016_df.head())
reprot_2016_df.rename(columns={'Country': '国家','Region': '地区', 'Happiness Rank': '排名', 'Happiness Score': '幸福指数'},
inplace=True)
print('==============================================')
print(reprot_2016_df.head())
- 过滤
import pandas as pd

reprot_2016_df = pd.read_csv('./2016.csv',
                             usecols=['Country', 'Happiness Rank', 'Happiness Score', 'Region'])
# 数据预览
print('==============================================')
print(reprot_2016_df.head())

print('==============================================')
df=reprot_2016_df[reprot_2016_df['Country'] == 'Denmark']
print(df.head())

print('==============================================')
only_western_europe_10 = reprot_2016_df[(reprot_2016_df['Region'] == 'Western Europe') & (reprot_2016_df['Happiness Rank'] > 10)]
print(only_western_europe_10.head())

- 处理Nan值
import pandas as pd

log_df = pd.read_csv('./data/log.csv')
print(log_df.head())
print('===============查看head是否有空值=========================')
#查看head是否有空值
print(log_df.head().isnull())
print('===============取出volume不为空的数据=========================')
# 取出volume不为空的数据
print(log_df[log_df['volume'].notnull()])
#将index改为time和user
log_df.set_index(['time', 'user'], inplace=True)
print(log_df)
#按照index排序
print('===============按照index排序=========================')
log_df.sort_index(inplace=True)
print(log_df)
print('================将nan替换为0========================')
#将nan替换为0
print(log_df.fillna(0))
print('================丢掉nan值========================')
#丢掉nan值
print(log_df.dropna())

- 处理重复值
import pandas as pd
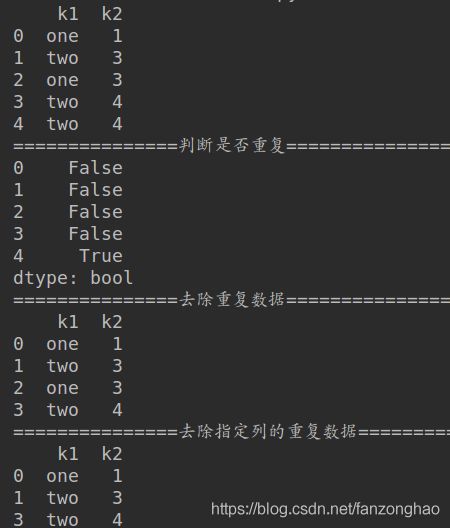
data = pd.DataFrame({'k1': ['one', 'two'] * 2+ ['two'],
'k2': [1, 3, 3, 4, 4]})
print(data)
print('===============判断是否重复=========================')
print(data.duplicated())
print('===============去除重复数据=========================')
print(data.drop_duplicates())
print('===============去除指定列的重复数据=========================')
print(data.drop_duplicates(['k2']))
- 数据合并
import pandas as pd

staff_df = pd.DataFrame([{'姓名': '张三', '部门': '研发部'},
                        {'姓名': '李四', '部门': '财务部'},
                        {'姓名': '赵六', '部门': '市场部'}])


student_df = pd.DataFrame([{'姓名': '张三', '专业': '计算机'},
                        {'姓名': '李四', '专业': '会计'},
                        {'姓名': '王五', '专业': '市场营销'}])

print(staff_df)
print()
print(student_df)
print('===============数据合并有NAN==================')
print(pd.merge(staff_df, student_df, how='outer', on='姓名'))
print('===============数据合并无NAN==================')
print(pd.merge(staff_df, student_df, how='inner', on='姓名'))
结果:
   姓名   部门
0  张三  研发部
1  李四  财务部
2  赵六  市场部

   姓名    专业
0  张三   计算机
1  李四    会计
2  王五  市场营销
===============数据合并有NAN==================
   姓名   部门    专业
0  张三  研发部   计算机
1  李四  财务部    会计
2  赵六  市场部   NaN
3  王五  NaN  市场营销
===============数据合并无NAN==================
   姓名   部门   专业
0  张三  研发部  计算机
1  李四  财务部   会计
- 分箱操作(分段统计)
import pandas as pd

# 年龄数据
ages = [20, 22, 25, 27, 21, 23, 37, 31, 61, 45, 41, 32]
# 分箱的边界
bins = [18, 25, 35, 60, 100]
cats = pd.cut(ages, bins)
print(cats)
print('================获取分箱编码================')
print(cats.codes)
print('===========统计箱中元素的个数=============')
print(pd.value_counts(cats))
print('===========带标签的分箱=============')
group_names = ['Youth', 'YoungAdult', 'MiddleAged', 'Senior']
cats = pd.cut(ages, bins, labels=group_names)
print(cats)
结果:
[(18, 25], (18, 25], (18, 25], (25, 35], (18, 25], ..., (25, 35], (60, 100], (35, 60], (35, 60], (25, 35]]
Length: 12
Categories (4, interval[int64]): [(18, 25] < (25, 35] < (35, 60] < (60, 100]]
================获取分箱编码================
[0 0 0 1 0 0 2 1 3 2 2 1]
===========统计箱中元素的个数=============
(18, 25]     5
(35, 60]     3
(25, 35]     3
(60, 100]    1
dtype: int64
===========带标签的分箱=============
[Youth, Youth, Youth, YoungAdult, Youth, ..., YoungAdult, Senior, MiddleAged, MiddleAged, YoungAdult]
Length: 12
Categories (4, object): [Youth < YoungAdult < MiddleAged < Senior]
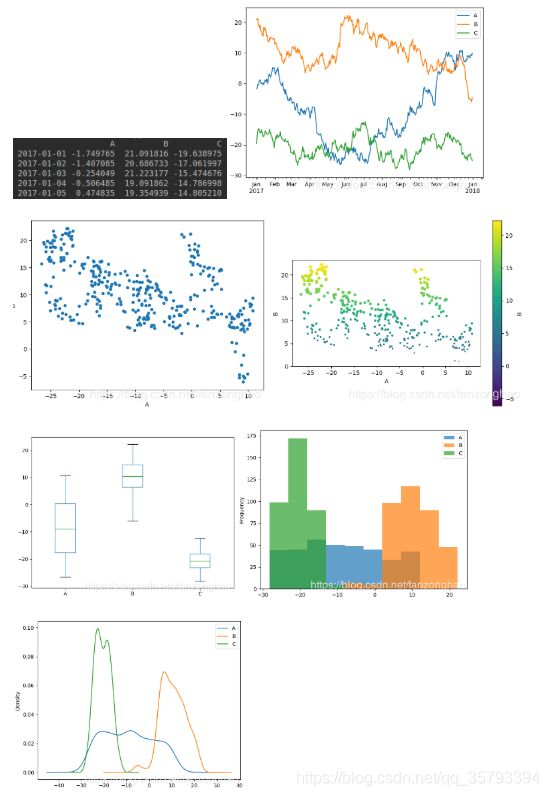
- 画图
import pandas as pd
import numpy as np
import matplotlib.pyplot as plt
np.random.seed(100)
df = pd.DataFrame({'A': np.random.randn(365).cumsum(0),#cunsum累计求和
                  'B': np.random.randn(365).cumsum(0) + 20,
                  'C': np.random.randn(365).cumsum(0) - 20},
                 index=pd.date_range('2017/1/1', periods=365))
print(df.head())
df.plot()
plt.show()

df.plot('A', 'B', kind='scatter')
plt.show()

# 颜色(c)和大小(s)由'B'列的数据决定
ax = df.plot('A', 'B', kind='scatter',
        c='B', s=df['B'], colormap='viridis')
# 设置坐标为相同比例
ax.set_aspect('equal')
plt.show()

df.plot(kind='box')
plt.show()

df.plot(kind='hist', alpha=0.7)
df.plot(kind='kde')
plt.show()
结果:
- groupby
import pandas as pd
df = pd.DataFrame({'key1' : ['a', 'a', 'b', 'c'],
                   'key2': ['one', 'two', 'one', 'two'],
                   'data1':[1,2,3,4],
                   'data2':[2,3,4,5]})
print(df)
print('====================')
grouped = df['data1'].groupby(df['key1'])
print(grouped.mean())
print('====================')
means = df['data1'].groupby([df['key1'], df['key2']]).mean()
print(means)
print('====================')
print(df.groupby('key1').mean())
  key1 key2  data1  data2
0    a  one      1      2
1    a  two      2      3
2    b  one      3      4
3    c  two      4      5
====================
key1
a    1.5
b    3.0
c    4.0
Name: data1, dtype: float64
====================
key1  key2
a     one     1
      two     2
b     one     3
c     two     4
Name: data1, dtype: int64
====================
      data1  data2
key1
a       1.5    2.5
b       3.0    4.0
c       4.0    5.0
- apply用于每一列最小最大归一化
import pandas as pd
a=pd.Series({'v1':2,
             'v2':3})
b=pd.Series({'v1':5,
             'v2':10})
c=pd.Series({'v1':4,
             'v2':6})
all=pd.DataFrame([a,b,c])
def scale_minmax(col):
    return (col-col.min())/(col.max()-col.min())
print('================')
print(all)
all=all.apply(scale_minmax,axis=0)
print('================')
print(all)
结果:
================
   v1  v2
0   2   3
1   5  10
2   4   6
================
         v1        v2
0  0.000000  0.000000
1  1.000000  1.000000
2  0.666667  0.428571
- map,可用来制作类别性特征
import pandas as pd
x = pd.Series(['A', 'B', 'C'], index=['one', 'two', 'three'])
y = {'A': 1, 'B': 2, 'C': 3}
z=x.map(y)
print(x)
print(z)
结果:
one      A
two      B
three    C
dtype: object
one      1
two      2
three    3
dtype: int64
- 生成csv
import pandas as pd
c={}
a=np.array([1])
b=np.array(['1 2 3 4'])
c['ID']=a
c['Detection']=b
a_df=pd.DataFrame(c)
a_df.to_csv('test16.csv',index=False,columns=['ID','Detection'])
import pandas as pd
a=np.array([1,2,3,4])
b=np.array([3,4,5,6])
a_df = pd.DataFrame(np.hstack([a.reshape(-1,1),b.reshape(-1,1)]))
a_df.to_csv('1.csv',index=False,header=['a','b'])
label_warp = {'normal': 0,
              'defect': 1}
img_path=['a','b','c']
label=['normal','defect','normal']
label_file = pd.DataFrame({'img_path': img_path, 'label': label})
print(label_file)
label_file=label_file['label'].map(label_warp)
print(label_file)
- 生成excel
df = pd.DataFrame(res)
df.to_excel('./yunjiang_test3.xls', index=False, header=None)
- 给csv空的header增加header,注意在读的时候没有header要将其为None
csv_path = './train_only.csv'
df = pd.read_csv(csv_path,header=None)######注意
print(df.shape)
df_value=df.values
# print(df_value[:-1,1])
# print(len(df_value[:,1]))

df=pd.DataFrame(df_value,columns=['name','xmin','ymin','xmax','ymax','class'])
df.to_csv('train_xml.csv',index=False)
- loc,iloc,ix,loc——通过行标签索引行数据,iloc——通过行号索引行数据,ix——通过行标签或者行号索引行数据(基于loc和iloc 的混合)
import pandas as pd

data = [[1, 2, 3], [4, 5, 6]]
index = ['a', 'b']  # 行号
columns = ['c', 'd', 'e']  # 列号
df = pd.DataFrame(data, index=index, columns=columns)  # 生成一个数据框
print(df)
print('===============')
#loc——通过行标签索引行数据
print(df.loc['a'])
#iloc——通过行号索引行数据
print('=================')
print(df.iloc[0])

print('=================')
print(df.loc[:, ['c']])

print(df.iloc[:, [0]])
结果:
   c  d  e
a  1  2  3
b  4  5  6
===============
c    1
d    2
e    3
Name: a, dtype: int64
=================
c    1
d    2
e    3
Name: a, dtype: int64
=================
   c
a  1
b  4
   c
a  1
b  4
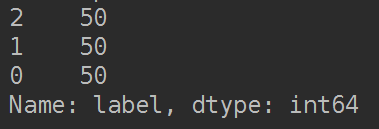
- value_counts() 可以用来统计每一类的个数
from sklearn.datasets import load_iris
import matplotlib.pyplot as plt
# load data
iris = load_iris()
df = pd.DataFrame(iris.data, columns=iris.feature_names)
print('df.shape=',df.shape)
df['label'] = iris.target
print(df['label'].value_counts())
- pandas读取csv的name
import numpy as np
import pandas as pd
names = np.array(pd.read_csv('./hunhe.csv', header=None))[:, 0]
print(names)

name_df=np.array(pd.read_csv('./hunhe.csv', header=None).values[:,0]).reshape(-1)
print(name_df)
- pd.concat 堆叠
import pandas as pd
df1 = pd.DataFrame([['a', 1], ['b', 2]],columns = ['letter', 'number'])
print(df1)
df2 = pd.DataFrame([['c', 1], ['d', 2]], columns=['letter', 'number'])
print(df2)
df=pd.concat([df1,df2])
print(df)
结果:
  letter  number
0      a       1
1      b       2
  letter  number
0      c       1
1      d       2
  letter  number
0      a       1
1      b       2
0      c       1
1      d       2
- Categorical
import pandas as pd
my_categories = pd.Categorical(['foo', 'bar', 'baz', 'foo', 'bar'])
print('=====================')
print(my_categories)
#查看类别标签
print('======================')
print(my_categories.categories)
# 查看类别编码
print('======================')
print(my_categories.codes)
结果:
=====================
[foo, bar, baz, foo, bar]
Categories (3, object): [bar, baz, foo]
======================
Index(['bar', 'baz', 'foo'], dtype='object')
======================
[2 0 1 2 0]
- 利用modin进行pandas加速 ( pip install modin[ray])
### Read in the data with Pandas
import pandas as pd


s = time.time()
df = pd.read_csv("esea_master_dmg_demos.part1.csv")
e = time.time()
print("Pandas Loading Time = {}".format(e-s))


### Read in the data with Modin
import modin.pandas as pd


s = time.time()
df = pd.read_csv("esea_master_dmg_demos.part1.csv")
e = time.time()
print("Modin Loading Time = {}".format(e-s))
- 取出csv的某一列类别值对应的数据
import numpy as np
import pandas as pd


def gini(nums):
    probs = [nums.count(i)/len(nums) for i in set(nums)]
    gini = sum([p*(1-p) for p in probs])
    return gini


def split_dataframe(data, col):
    '''
    function: split pandas dataframe to sub-df based on data and column.
    input: dataframe, column name.
    output: a dict of splited dataframe.
    '''
    # unique value of column
    unique_values = data[col].unique()
    # print('==unique_values:', unique_values)
    # empty dict of dataframe
    result_dict = {elem: pd.DataFrame for elem in unique_values}
    # split dataframe based on column value
    for key in result_dict.keys():
        result_dict[key] = data[:][data[col] == key]
    return result_dict


def test_split_dataframe():
    df = pd.read_csv('./example_data.csv', dtype={'windy': 'str'})
    res = split_dataframe(df, 'temp')
    print('=res:', res.keys())
    print("=====res['mild']:\n", res['mild'])
if __name__ == '__main__':
    test_split_dataframe()