数据分析:实战模拟
数据分析的综合应用
- 数据清洗
- 数据整理
- 数据分析(可视化)
在之前的讲述之中,我们已经介绍了数据分析的各种基本技能,这节就来把这些技能综合起来使用,进行一套完整的数据分析。首先下载我们的 学习资源。
数据清洗
我们使用的资源是某招聘网站的2017年数据分析师职位数据进行数据分析。对于一组数据,我们在使用之前需要查看他的基本情况:
import pandas as pd
# 使用gbk进行解码以免出现乱码
data=pd.read_csv('analyse_spider.csv', encoding='gbk')
print(data.info())
pd.set_option('display.max_columns',None)
pd.set_option('display.width',1000)
print(data.head())
info()可以查看数据集的基本情况,先来看看输出结果:
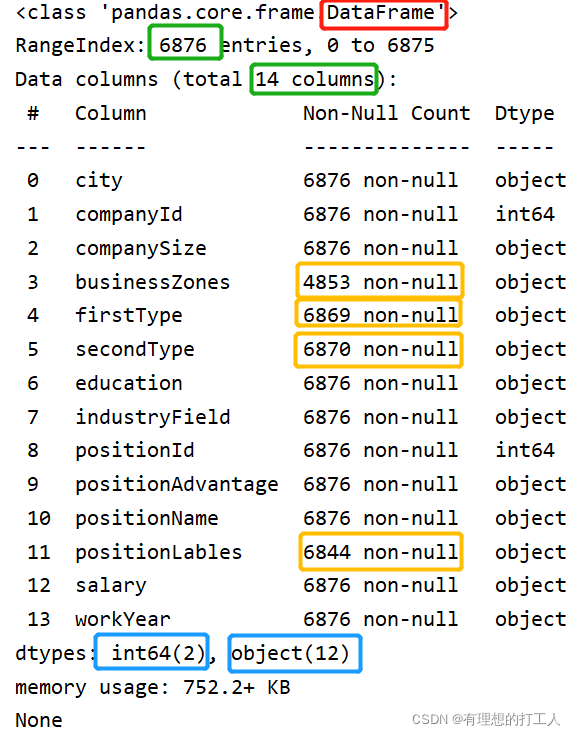
我们可以看到,data的类型是DataFrame,有6876个行,14个列,其中businessZones、firstType、secondType和positionLables四列数据具有空值或具有多余值;有两列数据是int64数字类型。
下面我们看看这些数据的具体情况:
![]()
从这里就可以看出这些列各的含义:
city:城市
companyId:公司ID
companySize:公司大小
CbusinessZones:公司所在商区
firstType:职位所属一级类目
secondType:职业所属二级类目
education:教育要求
industryField:公司所属领域
positionId:职位ID
positionAdvantage:职位福利
positionName:职位名称
salary:薪水
workYear:工作年限要求
下面我们来指定分析目标,即分析影响薪资的因素:
- 地区对数据分析师的薪酬的影响;
- 学历对数据分析师的薪酬的影响;
- 工作年限对数据分析师的薪酬的影响。
有了目标之后,我们将目标拆解为实际过程。数据的缺失值在很大程度上会影响数据的分析结果,比如这个businessZones列明显少了2000多条数据,因此没有太多的业务意义。我们就可以将这个字段删除了。接下来看看其他的有缺失或多余的数据列,firstType、secondType和positionLables对我们的分析没有太大的影响,所以我们也将他们去掉:
# 删除四列数据
data.drop(['businessZones','firstType','secondType','positionLables'],
        # axis=1为选择列作为删除对象,inplace=True则直接对data进行修改
          axis=1, inplace=True)
# 按行删除含有NaN的数据
data.dropna(inplace=True)
# 查看删除过后的数据情况
data.info()
让我们看看清洗后的数据:
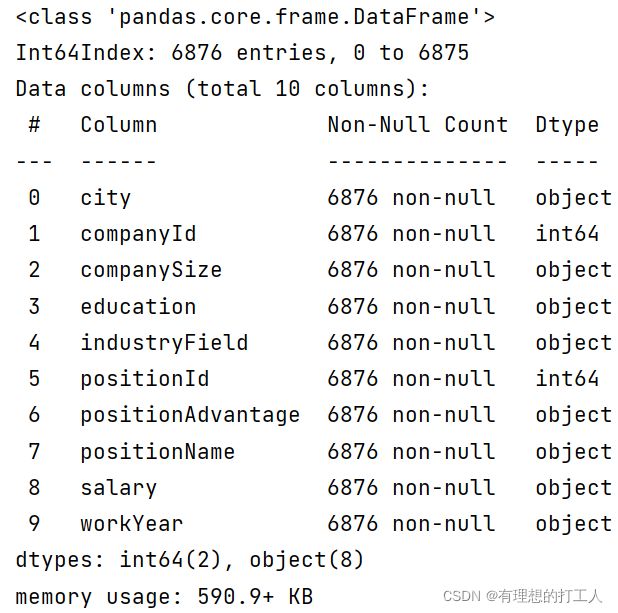
我们清洗过的数据整洁很多了,下面就可以开始分析了。
数据整理
处理好了控制之后,我们就来处理下一个会影响分析结果的因素:重复数值。接下来我们统计重复数据并将其删除:
# 计算重复的数据数
# 使用duplicated()方法构建Series类型,
# 将data数据中的重复行标记为True
seek=data.duplicated()
# 获取seek中标记为True的行号,并刷新列表
seek=seek[seek==True]
# 查看重复数据共有多少个
print(len(seek))
# 删除重复数据,直接修改data数据集
data.drop_duplicates(inplace=True)
# 查看删除后的data的基本情况
data.info()
我们看看去重后的情况:

一共有1844个重复数据,去重后还有5032行数据。在这里提醒大家一下,名为ID的列都不要删除,因为ID是标志数据为异性的一列,如果将ID删掉,就可能很多非重复数据被默认成重复数据,从而被误删。
现在的数据没有空值和重复值,下面我们来把薪水以数字的形式存储起来。我们先来看看薪资一列的情况:

薪资字段格式基本分为10k-20k和10k以上两种,并且都是字符串。我们想要把这样的字符串处理成数字形式,并且按照最低值和最高值分别存储,就需要使用find函数啦,大家还记得吗?
下面我们举个例子温习一下:
s='15-20-25-30'
print(s.find('-'),s[0:s.find('-')],type(s[0:s.find('-')]))
# 输出结果为:2 15
find(’-’)可以找到字符串中第一个‘-’所在的位置下标。所以我们可以使用这种方法找到这个字符串中的第一个数字部分,但是得到的数字依然是str类型的~
接下来,我们写一个函数把salary拆成两个部分,一个记录底薪,一个记录最高薪:
def split_salary(salary, method):
    # 将salary中的小写字母转换成大写,即将薪资后的小写k改为大写
    salary=salary.upper()
    # 找到字符串中第一个'-'下标位置,如果没找到则返回-1
    position = salary.find('-')
    if position != -1:  # salary值是15k-25k形式
        # 从0到position - 1位置取出的值为最低薪水(不保留K)
        low_salary = salary[:position - 1]
        # 从position开始到到倒数第二位为最高薪水(不保留K)
        high_salary = salary[position + 1:len(salary) - 1]
    else:  # salary值是“10k以上”形式
        # 认为最高薪水和最低薪水相同
        low_salary = salary[:salary.find('K')]
        high_salary = low_salary
    # 根据参数用以判断返回的值
    if method == 'low':
        return low_salary
    elif method == 'high':
        return high_salary
有了函数,我们就可以调用函数为data数据添加新的两列,分别记录每行数据的薪资最高最低值:
# 使用以下方法赋值,如果指定的列存在,则对其进行覆盖
# 如果不存在,则新建一列
data['low_salary'] = data.salary.apply(split_salary, method='low')
# data.salary.apply()方法可以将data表格中salary一列数据逐个作为split_salary函数的第一个参数,
# 并均采用method='low'作为第二参数多次调用函数,将返回值逐个填入新建列。使用这种方法可以省for循环
data['high_salary'] = data.salary.apply(split_salary, method='high')
当然使用这种方法会造成算力的浪费,如果我们调用一次split_salary就将最低值和最高值都填写到新的列里,就可以避免这种浪费了。下面我们试着改动一下:
def split_salary(salary):
    salary=salary.upper()
    position = salary.find('-')
    if position != -1:
        low_salary = salary[:position - 1]
        high_salary = salary[position + 1:len(salary) - 1]
    else:
        low_salary = salary[:salary.find('K')]
        high_salary = low_salary
    # 将最低值和最高值组成一个列表返回
    return [low_salary,high_salary]
# 将data数据的salary列保存成列表,并逐个调用split_salary()函数
low_salary = []
high_salary = []
for salary in data.salary.tolist():
    low_salary.append(int(split_salary(salary)[0]))
    high_salary.append(int(split_salary(salary)[1]))
data['low_salary(K)'] = low_salary
data['high_salary(K)'] = high_salary
print(data)
数据分析(可视化)
数据处理完成之后,在进行可视化就非常简单了,首先我们确定绘制什么样的图,因为我们想要直观地对比不同参数下的薪资多少,所以我们采用柱状图:
先看看地区对数据分析师薪酬(底薪)的影响:
首先对地区进行分类,然后求出每个地区的底薪平均值:
import matplotlib.pyplot as plt
from matplotlib import font_manager
my_font = font_manager.FontProperties(fname=r"c:\windows\fonts\msyh.ttc", size=10)
citys = []
salary = []
for city,table in data.groupby('city'):
    # 将city存储到城市列表
    citys.append(city)
    # 将个城市平均底薪存储到salary列表
    salary.append(table['low_salary(K)'].mean())
  # 使用plt.bar()可以一次只画一个柱,并且每次颜色不一样
    plt.bar(city,table['low_salary(K)'].mean())
plt.xticks(citys, fontproperties=my_font)
plt.show()
下面来看看结果:
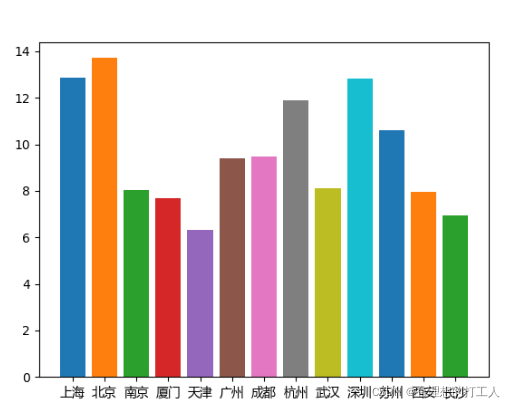
我们虽然得到了想要的图,但是这种时高时低的柱看着很不舒服,我们想办法先对数据进行一个排序再画图:
import matplotlib.pyplot as plt
from matplotlib import font_manager
my_font = font_manager.FontProperties(fname=r"c:\windows\fonts\msyh.ttc", size=10)
citys = []
salary = []
for city,table in data.groupby('city'):
    # 将city存储到城市列表
    citys.append(city)
    # 将个城市平均底薪存储到salary列表
    salary.append(table['low_salary(K)'].mean())
# 构建DataFrame类型数据df,存储城市和平均底薪,方便进行排序
df=pd.DataFrame(data=salary,columns=['salary'],index=citys)
# 使用sort_values()排序方法对df进行排序,并且直接改变df
df.sort_values(by='salary',inplace=True)

plt.bar(df.index,df.salary,color=['r','y','b','g','orange','purple','brown']) # df.salary的写法等同于df['salary']
plt.xticks(citys, fontproperties=my_font)
plt.show()
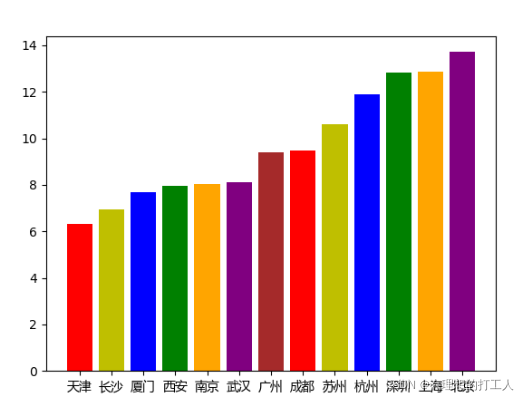
顺序排列会增加图片的对比度,因此我们之后也采取先排序后画图的方法。
接下来我们完成对学历对数据分析师的薪酬的影响。解决了上个问题,我们就有套路了:
import matplotlib.pyplot as plt
from matplotlib import font_manager
my_font = font_manager.FontProperties(fname=r"c:\windows\fonts\msyh.ttc", size=10)
edu = []
salary = []
for eduction,table in data.groupby('education'):
    # 将city存储到城市列表
    edu.append(eduction)
    # 将个城市平均底薪存储到salary列表
    salary.append(table['low_salary(K)'].mean())
# 构建DataFrame类型数据df,存储城市和平均底薪,方便进行排序
df=pd.DataFrame(data=salary,columns=['salary'],index=edu)
# 使用sort_values()排序方法对df进行排序,并且直接改变df
df.sort_values(by='salary',inplace=True)

plt.bar(df.index,df.salary,color=['r','y','b','g','orange','purple','brown']) # df.salary的写法等同于df['salary']
plt.xticks(edu, fontproperties=my_font)
plt.show()
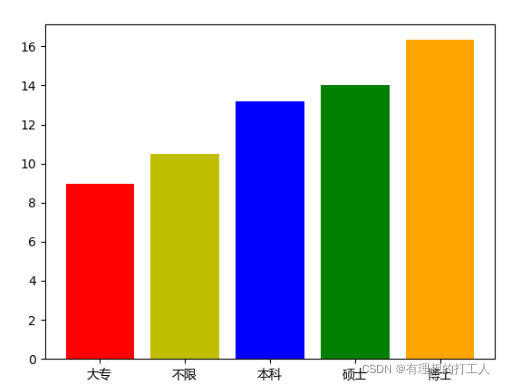
只是改了几个参数很简单对不对?
接下来我们继续完成第三个问题:分析工作年限对数据分析师的薪酬的影响。还是同样的套路:
import matplotlib.pyplot as plt
from matplotlib import font_manager
my_font = font_manager.FontProperties(fname=r"c:\windows\fonts\msyh.ttc", size=10)
workYear= []
salary = []
for year,table in data.groupby('workYear'):
    # 将city存储到城市列表
    workYear.append(year)
    # 将个城市平均底薪存储到salary列表
    salary.append(table['low_salary(K)'].mean())
# 构建DataFrame类型数据df,存储城市和平均底薪,方便进行排序
df=pd.DataFrame(data=salary,columns=['salary'],index=workYear)
# 使用sort_values()排序方法对df进行排序,并且直接改变df
df.sort_values(by='salary',inplace=True)
plt.bar(df.index,df.salary,color=['r','y','b','g','orange','purple','brown']) # df.salary的写法等同于df['salary']
plt.xticks(workYear, fontproperties=my_font)
plt.show()
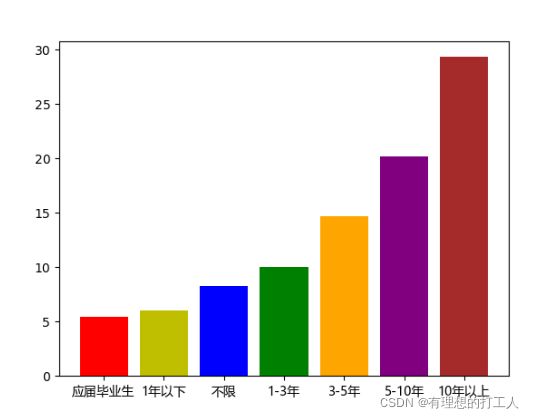
现在这个问题已经解决了,大家有什么收货吗?
这一系列的课程到今天就告一段落了,下课之后大家还要多多练习,博主日后还会努力给大家带来更多的文章的,让我们一起前进吧!
