Lumerical Python API学习(八)——在纳米线应用示例中使用 Python API
此示例演示了使用应用程序编程接口 (API) 将 Lumerical FDTD 与 Python 集成的可行性。 在此示例中,我们将基于 2D Mie 散射(2D Mie scattering )示例设置几何,然后使用 Python 脚本运行模拟。 模拟完成后,模拟结果将导入 Python,并提供模拟结果与理论结果的对比图以及 Ey 强度图。
要求:Lumerical 产品 2018a R4 或更新版本
•版本:示例文件是使用 Lumerical 2018a R4、Python 3.6(和 numpy)、matplotlib 0.99.1.1 和 Windows 7 创建的
•工作目录:应该可以根据需要将文件存储在任何位置。但是,建议将 Lumerical 和 Python 文件放在同一个文件夹中,以使上述脚本文件正常工作。检查 Lumerical 工作目录的路径是否正确也很重要,请参阅此处( here )了解更改 Lumerical 工作目录的说明。
Linux:/opt/lumerical/interconnect/api/python/
Windows:C:\Program Files\Lumerical\FDTD\api\python
在 Lumerical 产品安装过程中,应在此位置自动安装一个 lumapi.py 文件。
该模块是启用 Lumerical-Python API 连接的关键。将 lumapi 模块导入 Python 后,集成应该准备就绪。
注意:从 Python 运行 Lumerical 文件
如果您已经准备好 FDTD 模拟或脚本文件,则可以从 Python 运行它们。例如,下载 Lumerical 脚本文件( nanowire_build_script.lsf 和 nanowire_plotcs.lsf )和 nanowire_theory.csv 文本文件,然后在 Python 中运行以下脚本命令:
import lumapi
nw = lumapi.FDTD("nanowire_build_script.lsf")
nw.save("nanowire_test")
nw.run()
nw.feval("nanowire_plotcs.lsf")  # run the second script for plots
上面的命令首先运行 nanowire_build_script.lsf 来设置几何图形,然后运行 nanowire_plotcs.lsf 来绘制模拟和理论结果。 这些绘图是使用 Lumerical 可视化器创建的,与纳米线应用示例中的绘图相同。 在本页的其余部分中,将提供有关如何直接从 Python 构建几何和分析结果的说明。
一、导入模块
以下脚本行导入模块( importlib.util 、 numpy 和 matplotlib )和将在后面的脚本中使用的 Lumerical Python API。
import importlib.util
#The default paths for windows
spec_win = importlib.util.spec_from_file_location('lumapi', 'C:\\Program Files\\Lumerical\\2020a\\api\\python\\lumapi.py')
#Functions that perform the actual loading
lumapi = importlib.util.module_from_spec(spec_win) #
spec.loader.exec_module(lumapi)
import numpy as np
import matplotlib.pyplot as plt
用户也可以使用会话管理( session management)中提到的方法
二、从python设置几何图形
横截面结果取决于波长。 为了获得共振模式的场分布,我们需要运行两个模拟:第一个模拟计算共振波长,第二个模拟相应地调整场监视器的波长。 因此,我们定义了一个函数来设置几何形状并将场监视器波长作为参数:
def runNanowireSimulation(profile_monitor_wavelength=1e-6):
   configuration = (
       ("source", (("polarization angle", 0.),
                   ("injection axis", "y"),
                   ("x", 0.),
                   ("y", 0.),
                   ("x span", 100.0e-9),
                   ("y span", 100.0e-9),
                   ("wavelength start", 300.0e-9),
                   ("wavelength stop", 400.0e-9))),
        #see attached file for complete configuration
        #完整配置见附件
   )
为了设置几何,我们发现使用嵌套元组更高效、更简洁,但是,高级用户可以使用任何有序集合。 如果一个属性依赖于另一个属性的值,则顺序很重要。
for obj, parameters in configuration:
	for k, v in parameters:
    	fdtd.setnamed(obj, k, v)

fdtd.setnamed("profile", "wavelength center", float(profile_monitor_wavelength))
fdtd.setglobalmonitor("frequency points", 100.) # setting the global frequency resolution # 设置全局频率分辨率
fdtd.save("nanowire_test")
fdtd.run()
return fdtd.getresult("scat", "sigma"), fdtd.getresult("total", "sigma"), fdtd.getresult("profile", "E")
三、分析模型和理论结果
然后脚本调用该函数运行模拟,然后将模拟结果导入 Python。 理论结果也从 nanowire_theory.csv 文件中导入,并在模拟波长上进行插值:
nw = runNanowireSimulation() # recalls the function to run the simulation
# 调用函数来运行模拟

## run the simulation once, to determine resonance wavelength
## and get cross-sections from analysis objects
## 运行一次模拟,以确定共振波长
## 并从分析对象中获取横截面
sigmascat, sigmaabs, _ = runNanowireSimulation()
lam_sim = sigmascat['lambda'][:,0]
f_sim = sigmascat['f'][:,0]
sigmascat = sigmascat['sigma']
sigmaabs  = sigmaabs['sigma']
sigmaext = -sigmaabs + sigmascat

#load cross section theory from .csv file
#从 .csv 文件加载横截面理论结果
nw_theory=np.genfromtxt("nanowire_theory.csv", delimiter=",")
nw_theory.shape
lam_theory = nw_theory[:,0]*1.e-9
r23 = nw_theory[:,1:4]*2*23*1e-9
r24 = nw_theory[:,4:7]*2*24*1e-9
r25 = nw_theory[:,7:10]*2*25*1e-9
r26 = nw_theory[:,10:13]*2*26*1e-9
r27 = nw_theory[:,13:16]*2*27*1e-9

for i in range(0,3):  # interpolate theoretical data
   r23[:,i] = np.interp(lam_sim,lam_theory,r23[:,i])
   r24[:,i] = np.interp(lam_sim,lam_theory,r24[:,i])
   r25[:,i] = np.interp(lam_sim,lam_theory,r25[:,i])
   r26[:,i] = np.interp(lam_sim,lam_theory,r26[:,i])
   r27[:,i] = np.interp(lam_sim,lam_theory,r27[:,i])
四、绘制结果
使用 Lumerical Python API 的好处之一是我们可以利用高级 Python 模块。 在这个例子中,我们使用 matplotlib 模块中的 pyplot 来绘制结果。
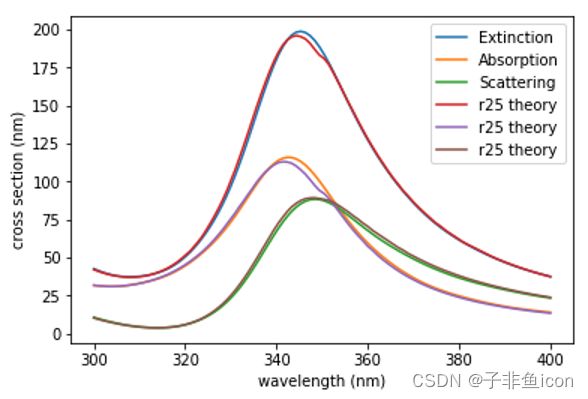
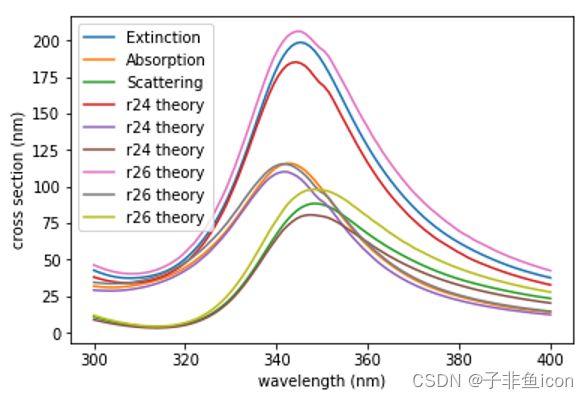
以下命令绘制模拟和理论结果以进行比较。
plt.plot(lam_sim*1e9, sigmaext*1e9,label='sigmaext')
plt.plot(lam_sim*1e9, -sigmaabs*1e9)
plt.plot(lam_sim*1e9, sigmascat*1e9)
plt.plot(lam_sim*1e9, r25*1e9)
plt.xlabel('wavelength (nm)')
plt.ylabel('cross section (nm)')
plt.legend(['Extinction','Absorption', 'Scattering', 'r25 theory', 'r25 theory',
'r25 theory'])
plt.show()

plt.plot(lam_sim*1e9, sigmaext*1e9,label='sigmaext')
plt.plot(lam_sim*1e9, -sigmaabs*1e9)
plt.plot(lam_sim*1e9, sigmascat*1e9)
plt.plot(lam_sim*1e9, r24*1e9)
plt.plot(lam_sim*1e9, r26*1e9)
plt.xlabel('wavelength (nm)')
plt.ylabel('cross section (nm)')
plt.legend(['Extinction','Absorption', 'Scattering', 'r24 theory', 'r24 theory',
'r24 theory', 'r26 theory', 'r26 theory','r26 theory'])

plt.show()
上图显示最大消光发生在 348nm 附近。 这可以通过使用 numpy.argmax 来实现。 为了显示该波长的场分布,调整场监视器的波长并使用以下命令第二次重新运行模拟:
## run the simulation again using the resonance wavelength
_, _, E = runNanowireSimulation(profile_monitor_wavelength=lam_sim[np.argmax(sigmascat)])

## show the field intensity profile
Ey = E["E"][:,:,0,0,1]
模拟完成后,我们可以提取剖面监视器结果并在 z=0 处绘制 |Ey|^2:
  plt.pcolor(np.transpose(abs(Ey)**2), vmax=5, vmin=0)
  plt.xlabel("x (nm)")
  plt.ylabel("y (nm)")
  plt.xticks(range(Ey.shape[0])[::25], [int(v) for v in E["x"][:,0][::25]*1e9])
  plt.yticks(range(Ey.shape[1])[::25], [int(v) for v in E["y"][:,0][::25]*1e9])
  plt.colorbar()
  plt.show()


