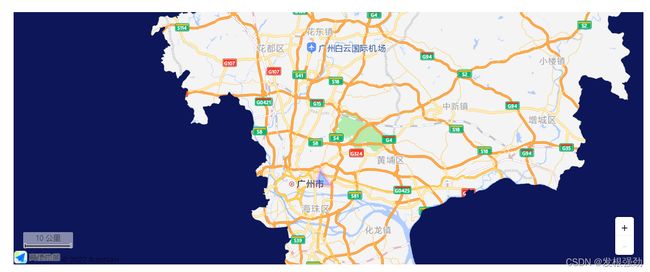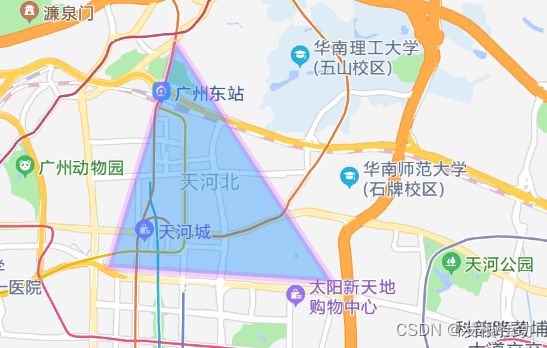

<template>
<div>
<div id="mapbox" class="mapbox">
<div id="map" class="map" />
</div>
</div>
</template>
<script>
export default {
name: '',
components: {},
props: {},
data() {
return {
map: null,
enclosureMap: [],
}
},
filters: {},
computed: {},
watch: {},
created() {},
mounted() {
localStorage.clear()
this.MapInit()
this.getEnclosure()
},
beforeDestroy() {},
methods: {
getEnclosure(val) {
const polygon = new AMap.Polygon({
path: [[113.327121,23.158636], [113.349489,23.127141], [113.317335,23.12907]],
strokeColor: '#FF33FF',
strokeWeight: 6,
strokeOpacity: 0.2,
fillOpacity: 0.4,
fillColor: '#1791fc',
zIndex: 50
})
this.map.add(polygon)
this.enclosureMap.push(polygon)
},
deleteEnclosure() {
this.map.remove(this.enclosureMap)
},
MapInit() {
const _this = this
_this.map = new AMap.Map('map', {
center: [113.364965, 23.107179],
mapStyle: 'amap://styles/10a0181b333c1a5927ca8bde490ab9d4',
expandZoomRange: true,
resizeEnable: true,
zoom: 12,
zooms: [10, 21]
})
_this.map.on('click', event => {
this.map.setZoomAndCenter(12, [113.364965, 23.107179],)
})
AMap.plugin('AMap.Weather', function() {
const weather = new AMap.Weather()
weather.getForecast('广州市', function(err, data) {
const weatherData = data
_this.$emit('weather', weatherData)
})
_this.drawBounds(_this.map)
})
AMap.plugin(['AMap.ToolBar', 'AMap.Scale'], function() {
_this.toolbar = new AMap.ToolBar({
ruler: false,
liteStyle: true,
position: 'RB'
})
_this.map.addControl(_this.toolbar)
_this.scale = new AMap.Scale()
_this.map.addControl(_this.scale)
})
},
drawBounds(map) {
const opts = {
subdistrict: 0,
extensions: 'all',
level: 'city'
}
const district = new AMap.DistrictSearch(opts)
district.setLevel('广州市')
district.search('广州市', (status, result) => {
const outer = [
new AMap.LngLat(-360, 90, true),
new AMap.LngLat(-360, -90, true),
new AMap.LngLat(360, -90, true),
new AMap.LngLat(360, 90, true)
]
const holes = result.districtList[0].boundaries
const pathArray = [outer]
pathArray.push.apply(pathArray, holes)
const polygon = new AMap.Polygon({
pathL: pathArray,
strokeColor: '#001826',
strokeWeight: 1,
strokeOpacity: 0.5,
fillColor: '#0d1659',
fillOpacity: 1,
strokeStyle: 'dashed',
strokeDasharray: [10, 2, 10]
})
polygon.setPath(pathArray)
map.add(polygon)
})
},
}
}
</script>
<style scoped lang="less">
.mapbox {
width: 1000px;
height: 400px;
margin: 0 auto;
.map {
width: 100%;
height: 100%;
}
}
</style>

