毫米波雷达障碍物检测算法介绍
Radar系列文章
传感器融合是将多个传感器采集的数据进行融合处理,以更好感知周围环境;这里首先介绍毫米波雷达的相关内容,包括毫米波雷达基本介绍,毫米波雷达数据处理方法(测距测速测角原理,2D FFT,CFAR,聚类,毫米波雷达障碍物识别实例)等。
系列文章目录
1. 毫米波雷达基本介绍
2. FMCW毫米波雷达原理
3. 毫米波雷达障碍物检测算法介绍
文章目录
-
- Radar系列文章
- FFT and FMCW
- 2D FFT
- 杂波噪声(Clutter noise)
- CFAR
- 聚类
- 卡尔曼(Kalman)跟踪
上一章我们讲到可以通过混频器(Mixer)的中频信号(beat frequency)解算出速度和距离信息。
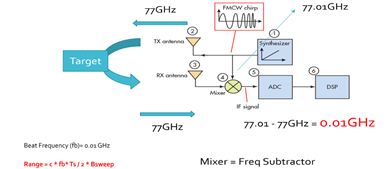
混频器出来的差频信号,首先需要进行ADC模数转换,转换成数字信号,再给到DSP处理。首先进行的是FFT频谱分析,将时域信号转换为频域信号,再提取有效信息,下面将介绍这一过程。

FFT and FMCW
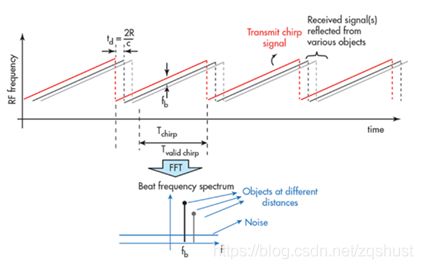
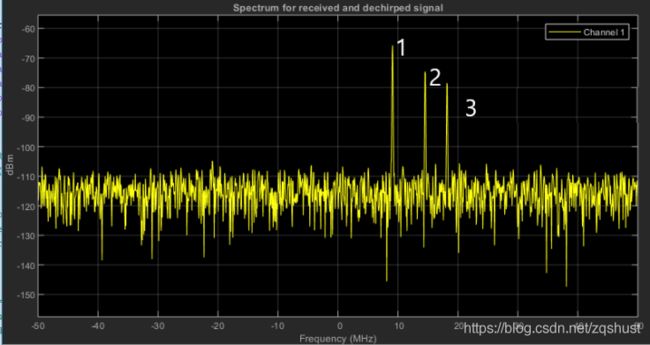
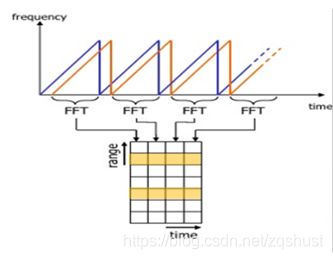
混频器回波后的差频信号,首先截取中间段的有效信号进行FFT频谱分析,每段采样N次,每次采样得到一个距离单元,从而得到一下Range FFT map图,获得N*(Number of chirps)单元。
以下是MATLAB进行FFT分析的程序示例。
Fs = 1000;            % Sampling frequency
T = 1/Fs;             % Sampling period
L = 1500;             % Length of signal
t = (0:L-1)*T;        % Time vector
% TODO: Form a signal containing a 77 Hz sinusoid of amplitude 0.7 and a 43Hz sinusoid of amplitude 2.
S = 0.7*sin(2*pi*77*t)+2*sin(2*pi*43*t);
% Corrupt the signal with noise
X = S + 2*randn(size(t));
% Plot the noisy signal in the time domain. It is difficult to identify the frequency components by looking at the signal X(t).
plot(1000*t(1:50) ,X(1:50))
title('Signal Corrupted with Zero-Mean Random Noise')
xlabel('t (milliseconds)')
ylabel('X(t)')
% TODO : Compute the Fourier transform of the signal.
signal_fft = fft(X);
% TODO : Compute the two-sided spectrum P2. Then compute the single-sided spectrum P1 based on P2 and the even-valued signal length L.
P2 = abs(signal_fft/L);
P1=P2(1:L/2+1);
% Plotting
f = Fs*(0:(L/2))/L;
plot(f,P1)
title('Single-Sided Amplitude Spectrum of X(t)')
xlabel('f (Hz)')
ylabel('|P1(f)|')
2D FFT
我们已经从Range FFT中获得了距离信息,下一步我们需要提取速度信息。这里我们需要对Range FFT信号再次进行FFT,获得获取多普勒频移 f d f_d fd,即可获得速度信息。多普勒频移是通过分析多个扫频波(chirps)的相位变化来获得的,因此需要在连续扫频波发射接收后,对距离多普勒进行2nd FFT,即2D FFT可获得频移/速度信息。

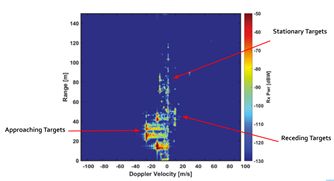
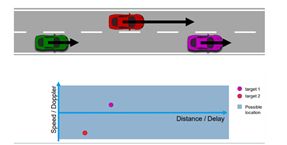
下图是真实场景中的2D FFT结果,距离多普勒图,纵轴(y)为距离信息,横轴(x)为多普勒速度。中间为静止目标,坐标为靠近的目标物,右边为远离的目标物。
2D FFT分析MATLAB实现如下:
% Take a 2D signal matrix
% Convert the signal in MxN matrix, where M is the size of Range FFT samples and N is the size of Doppler FFT samples
signal  = reshape(signal, [M, N]);
% Run the 2D FFT across both the dimensions
signal_fft = fft2(signal, M, N);
% Shift zero-frequency terms to the center of the array
signal_fft = fftshift(signal_fft);
% Take the absolute value
signal_fft = abs(signal_fft);
% plotted as an image use the imagesc function
imagesc(signal_fft);
杂波噪声(Clutter noise)
这里我们将讨论真实环境中所遇到的雷达杂波噪声问题,及其杂波噪声如何导致检测失效。
雷达应用于自动紧急制动中,会存在由于地面井盖,钉子,弯道两侧的电线杆,栅栏等无效目标产生突然的紧急制动。这是因为雷达反射波中不仅包含目标物的有用信号,还包括环境中的其他物体的信号。这些不想要的反射波统一称为杂波Clutter。
杂波信号的幅值主要取决于:
- 表面属性,包括地面,水,雪覆盖等(荒漠反射率比较大,而结冰表面反射率高);
- 表面的光滑程度;
- 照射角度,雷达波和表面所成的角度。
以下是包含许多杂波信号及多个目标物反射的回波信号。
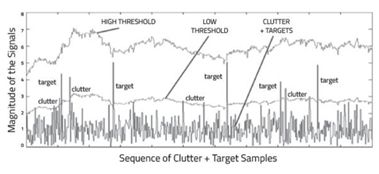
杂波阈值问题
为了防止车辆在没有障碍物时突然刹车,有必要过滤掉杂波噪声。一种办法是是去除多普勒速度为0的信号,因为正常驾驶场景中很多噪声是由静态物体反射过来的。缺点是无法检测道路上静态目标,从而造成漏检。
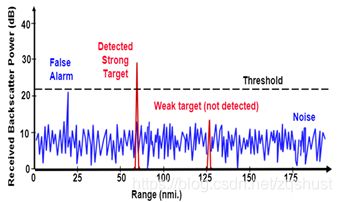
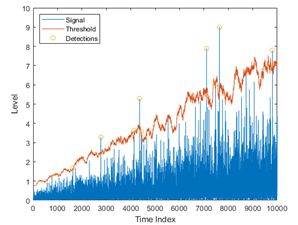
另外一种办法是使用固定的噪声限值,滤除低于限值的信号。对于这种方法,如果检测限值过高,误报率(False Alarm Rate)会比较低,但会忽略掉有效地目标。如果限值过低,则会导致过多的误报,即误报率会比较高。下图所示,固定阈值容易导致误报和低反射率目标的漏报。
误报率是雷达检测过程中因噪声或其他干扰信号导致的误报概率,是雷达在没有有效目标时检出雷达目标的度量。
动态阈值
另一种办法是使用动态阈值,即动态变化的阈值水平以降低误报率。这里我们将介绍一种动态阈值方法——CFAR(Constant False Alarm Rate),这种方法监控每个距离/速度多普勒单元的噪声,再加上一定的阈值,作为信号是否为目标的判定标准,这样就可以获得固定的误报率。下面主要介绍这种方法。
CFAR
CFAR (Constant False Alarm Rate)是一种保持较低的误报率而不丢失有效目标的一种解决方法。
CFAR估计雷达距离和多普勒单元周围的干扰值,根据车辆周边环境噪声大小变化判定阈值。CFAR将周围的距离和多普勒单元作为Training Cell,以估计当前单元(Cell Under Test)的噪声。原理是当存在噪声时,周围单元的信号幅值中也包含这个噪声的估计,即噪声空间均匀分布。理论上这种方法可以保持固定的误报率,与噪声或杂波幅值无关。
有以下种类的CFAR技术:
- Cell Averaging CFAR (CA-CFAR)
- Ordered Statistics CFAR (OS CFAR)
- Maximum Minimum Statistic (MAMIS CFAR)
- Multiple variants of CA-CFAR.
这里主要介绍基本的CA-CFAR)。
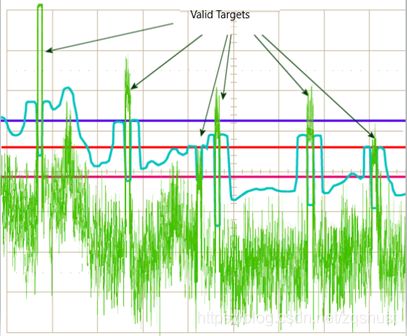
CA-CFAR
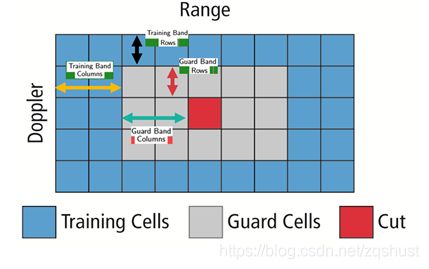
CA-CFAR是最常用的CFAR检测技术。上一小节中,我们通过对扫频波进行FFT获得了距离和多普勒/速度单元,CFAR使用滑动窗估计每个单元的噪声。
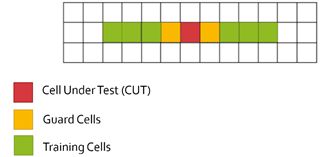
滑动窗包含以下单元:
被测单元CUT(Cell Under Test ):被测单元通过与噪声比较判断目标物的存在。
训练单元(Training Cells ):在训练单元中估计噪声值。训练单元可以单独使用被测单元前面或后面的单元,也可以同时使用前后的单元。训练单元的个数依环境而定,如果是嘈杂的交通环境需要使用较少的训练单元,此时近处的目标会被用作噪声估计。
隔离单元(Guard Cells):CUT旁边的单元,用于避免目标信号能量泄露到训练单元中,影响噪声估计,需要根据目标信号能量泄露的情况确定单元的数量,如果目标反射较强通常会泄露到周围单元中。
**阈值因子/偏置Threshold Factor (Offset) **:偏置估计的噪声幅值作为障碍物检测的阈值。
1D CFAR MATLAB实现
以下MATLAB 实现1D CFAR中,主要步骤如下:
- 确定训练单元数量
T和隔离单元数量G; - 循环迭代对所有的FFT 1D单元施加滑动窗,窗大小为2(T+G)+1;
- 对于每个单元,计算训练单元的信号(噪声)强度和,再求平均获取噪声幅值;
- 对噪声幅值进行偏置以获取CFAR阈值;
- 计算被测单元CUT的信号强度,即滑动窗开始T+G+1单元;
- 对比CUT信号强度与CFAR阈值,如果低于CFAR阈值,则CUT判断为无目标物。
% Implement 1D CFAR using lagging cells on the given noise and target scenario.
% Close and delete all currently open figures
close all;
% Data_points
Ns = 1000;
% Generate random noise
s=randn(Ns,1);
%Targets location. Assigning bin 100, 200, 300 and 700 as Targets with the amplitudes of 8, 9, 4, 11.
s([100 ,200, 300, 700])=[8 9 4 11];
%plot the output
plot(s);
% TODO: Apply CFAR to detect the targets by filtering the noise.
% 1. Define the following:
% 1a. Training Cells
T=12;
% 1b. Guard Cells
G=4;
% Offset : Adding room above noise threshold for desired SNR
offset=5;
% Vector to hold threshold values
threshold_cfar = [];
%Vector to hold final signal after thresholding
signal_cfar = [];
% 2. Slide window across the signal length
for i = 1:(Ns-(G+T+1))
    % 2. - 5. Determine the noise threshold by measuring it within the training cells
	noise_level=sum(s(i:i+T-1));
threshold=(noise_level/T)*offset;
threshold_cfar = [threshold_cfar,{ threshold }];
    % 6. Measuring the signal within the CUT
signal=s(i+G+T);
    % 8. Filter the signal above the threshold
if(signal< threshold)
	signal=0
end
    signal_cfar = [signal_cfar, {signal}];
end

% plot the filtered signal
plot (cell2mat(signal_cfar),'g--');

% plot original sig, threshold and filtered signal within the same figure.
figure,plot(s);
hold on,plot(cell2mat(circshift(threshold_cfar,G)),'r--','LineWidth',2)
hold on, plot (cell2mat(circshift(signal_cfar,(T+G))),'g--','LineWidth',4);
legend('Signal','CFAR Threshold','detection')
2D CFAR
2D CFAR和1D CFAR原理类似,但在距离多普勒单元的两个维度上都进行噪声估计。
2D CFAR主要步骤如下:
- 确定训练单元数量
Tr和Td隔离单元数量Gr和Gd; - 循环迭代对所有的FFT 2D单元施加滑动窗,窗大小为 (2Tr+2Gr+1)(2Td+2Gd+1),隔离单元即被测单元总数量为:(2Gr+1)(2Gd+1),训练单元数量为:(2Tr+2Gr+1)(2Td+2Gd+1) - (2Gr+1)(2Gd+1);
- 对于每个单元,计算训练单元的信号(噪声)强度和,再求平均获取噪声幅值;
- 对噪声幅值进行偏置以获取CFAR阈值;
- 计算被测单元CUT的信号强度,即滑动窗开始T+G+1单元;
- 对比CUT信号强度与CFAR阈值,如果低于CFAR阈值,则CUT判断为无目标物。
%% CFAR implementation

%Slide Window through the complete Range Doppler Map

% *%TODO* :
%Select the number of Training Cells in both the dimensions.
Tr = 10;
Td = 4;

% *%TODO* :
%Select the number of Guard Cells in both dimensions around the Cell under
%test (CUT) for accurate estimation
Gr = 4;
Gd = 2;

Training_size = (2*Tr+2*Gr+1)*(2*Td+2*Gd+1)-(2*Gr+1)*(2*Gd+1);

% *%TODO* :
% offset the threshold by SNR value in dB
offset = 15;

% *%TODO* :
%design a loop such that it slides the CUT across range doppler map by
%giving margins at the edges for Training and Guard Cells.
%For every iteration sum the signal level within all the training
%cells. To sum convert the value from logarithmic to linear using db2pow
%function. Average the summed values for all of the training
%cells used. After averaging convert it back to logarithimic using pow2db.
%Further add the offset to it to determine the threshold. Next, compare the
%signal under CUT with this threshold. If the CUT level > threshold assign
%it a value of 1, else equate it to 0.


% Vector to hold threshold values
threshold_cfar2D = zeros(size(RDM));
%Vector to hold final signal after thresholding
signal_cfar2D = zeros(size(RDM));

% Slide window across the both dimensions of the range doppler block
for i = Tr+Gr+1:(Nr/2-(Gr+Tr))
    for j = Td+Gd+1:(Nd-(Gd+Td))
        %Determine the noise threshold by measuring it within the training cells

        %Create a vector to store noise_level for each iteration on training cells
        noise_level = zeros(1,1);

        for m = i-(Tr+Gr):i+(Tr+Gr)
            for n = j-(Td+Gd):j+(Td+Gd)
                if(abs(i-m)>Gr || abs(j-n)>Gd)
                    noise_level = noise_level+db2pow(RDM(m,n));
                end
            end
        end
        threshold=pow2db(noise_level/Training_size)+offset;
        threshold_cfar2D(i,j) = threshold;
        %Filter the signal above the threshold
        if(RDM(i,j)> threshold_cfar2D(i,j))
            signal_cfar2D(i,j) = 1;
        else
            signal_cfar2D(i,j) = 0;
        end
    end
end

% *%TODO* :
% The process above will generate a thresholded block, which is smaller
%than the Range Doppler Map as the CUT cannot be located at the edges of
%matrix. Hence,few cells will not be thresholded. To keep the map size same
% set those values to 0.

% Alerady zero


% *%TODO* :
%display the CFAR output using the Surf function like we did for Range
%Doppler Response output.
figure,surf(doppler_axis,range_axis,signal_cfar2D);
colorbar;
2D-CFAR的结果如下图所示。

课程资源:radar-target-generation-and-detection
聚类
为实现自动驾驶中的感知,需要对多个目标物单独跟踪。目标跟踪相对计算量较大,同时跟踪多个目标物需要大量的计算能力和内存。
随着雷达技术的进步和持续增加的感知方案,雷达可以从目标物大量的散射点中检出目标物。如果跟踪器对目标物的每个反射点进行跟踪,会造成处理单元过载。因此有必要对目标物进行聚类再进行跟踪。
目前已经有很多聚类跟踪算法。汽车传感器需要同时跟踪多个目标,由于跟踪一个物体需要较高的算力,因此有必要只跟踪有效目标。因此首先需要使用聚类算法将所有从同一目标物反射点进行聚类。

基本聚类算法包括欧氏聚类,通过计算雷达反射点的欧氏距离进行分组。所有目标尺寸内的反射点聚类为一个目标,并入一个形心位置,并给每个聚类点赋值新的距离和速度(所有聚类点的均值),以对每个目标进行有效跟踪。
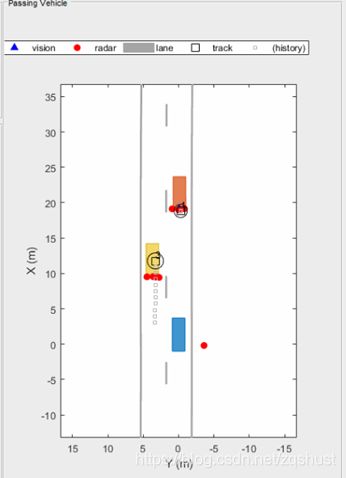
以上是聚类场景的示意图,蓝色车辆是自车,检测到来自黄色和橙色目标物的反射点。使用聚类算法可以将所有属于同一目标物的反射点聚类为一个目标点,实现有效检测和跟踪。
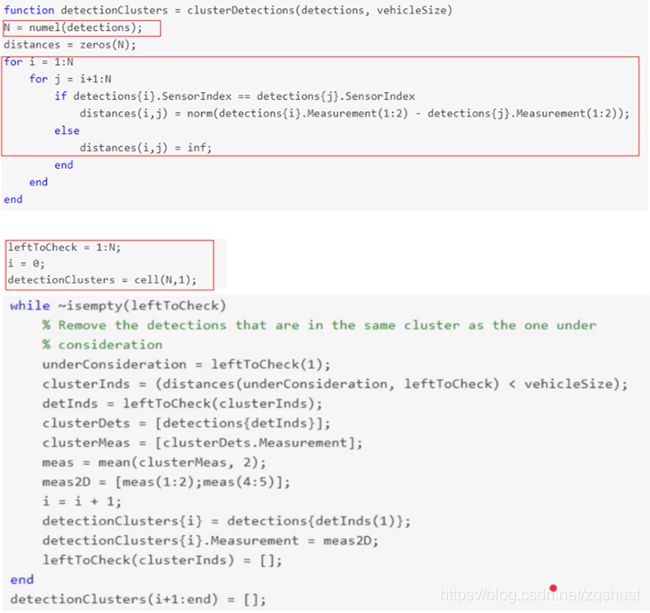
聚类算法实现步骤如下:
- 对于从同一传感器反射回的所有检测,迭代所有检测点并计算相互间的欧氏距离;
- While循环迭代以下内容:
卡尔曼(Kalman)跟踪
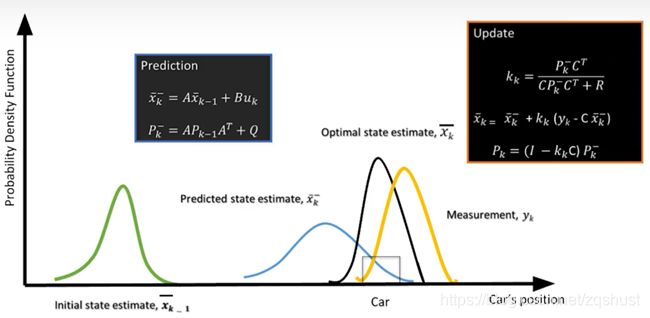
x k ^ \widehat{x_k} xk , k时刻车辆状态;
A A A, 状态迁移矩阵;
P k P_k Pk, 协方差矩阵 - 状态估计协方差;
B B B, 控制矩阵 - 外部控制变量的影响;
C C C, 观测/测量矩阵;
Q Q Q, 过程噪声的协方差;
R R R, 观测噪声的协方差;
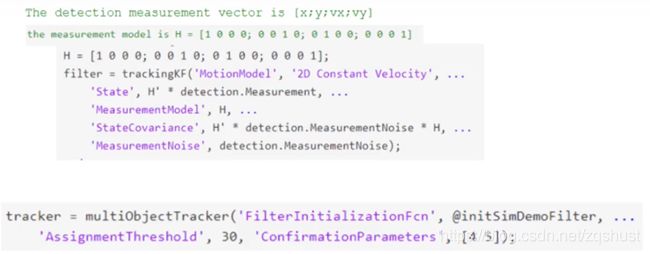
卡尔曼滤波器主要用于跟踪车辆的状态。这里车辆的状态向量包括位置,速度,加速度等被跟踪车辆的属性。卡尔曼滤波器使用包含噪声的观测值估计车辆的真实位置,是所有雷达跟踪系统的核心算法。
卡尔曼滤波器设计中,首先建立车辆的状态向量,状态迁移方程,协方差矩阵等,然后迭代预测(Prediction)、更新(Update);
预测步骤中,根据状态迁移矩阵和控制矩阵预测车辆的下一状态,并更新协方差;
更新步骤中,使用传感器反馈的包含噪声的测量值,融合预测的状态值,基于概率估计一个最可能的车辆状态。
