基于D3js以及Neo4j的知识图谱系统开发
因为要做这个知识图谱,对这方面完全是小白
D3js和这个Neo4j是啥咱也不清楚,学呗!
1前置知识
1.1D3.jshttps://www.d3js.org.cn/
据说,不同版本之间的坑很多(怎么办,我也很绝望)
D3js 是一个可以基于数据来操作文档的 JavaScript 库。可以帮助你使用 HTML, CSS, SVG 以及 Canvas 来展示数据。D3 遵循现有的 Web 标准,可以不需要其他任何框架独立运行在现代浏览器中,它结合强大的可视化组件来驱动 DOM 操作。
最新发行版或者插入如下代码来在线使用:
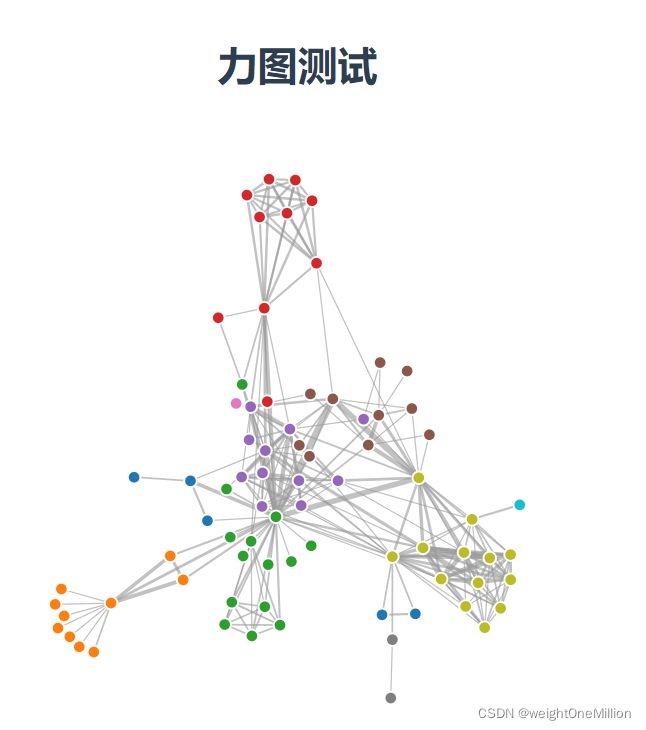
1.1.1力图
https://observablehq.com/@d3/force-directed-graph
miserable.json存放一些测试数据文件

1.1.2分析一下这些数据
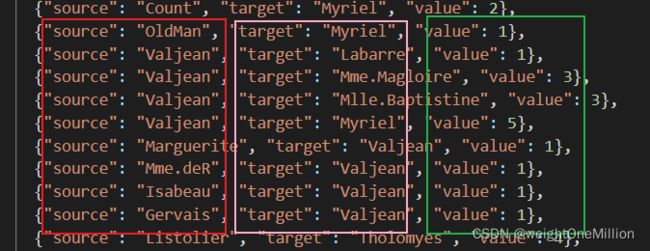
node(节点)节点的对象里有两个属性,一个是id,一个是group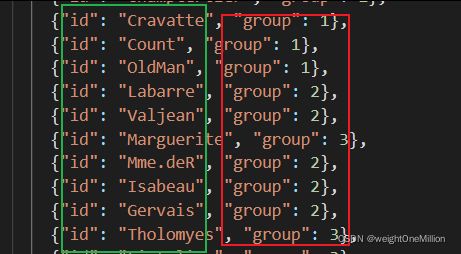 link(连接线)三个属性source(源节点id)、target(目标节点id)、value(线长)
1.1.3项目中安装d3
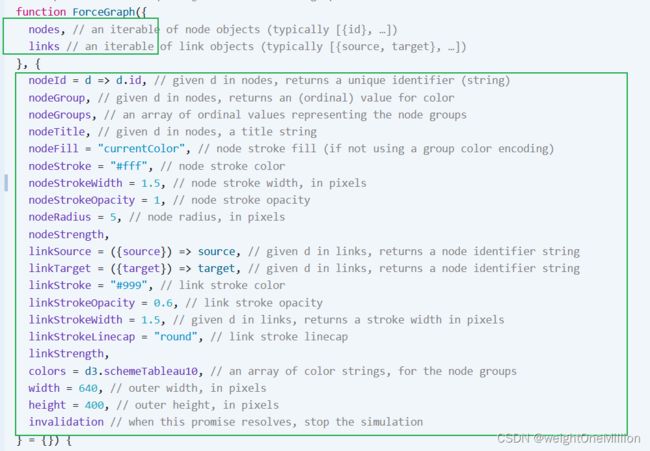
1.1.4认识初始化函数
可以看出,官网给的则个函数有两个参数,其中第一个参数是这个提供的数据,第二个参数(为啥可以这样写呢?是指定默认值吗)
1.1.5效果
代码
<template>
  <div class="hello">
    <h1>力图测试</h1>
  <div class="container">

  </div>
  </div>
</template>

<script>
import * as d3 from 'd3'

export default {
  name: 'HelloWorld',
  props: {},

  data() {
    return {
      testGraph : {
        "nodes": [
          {"id": "Myriel", "group": 1},
           。。。。。此处省略
        ],
        "links": [
          {"source": "Napoleon", "target": "Myriel", "value": 1},
        。。。。。此处省略

        ]
      }
    }
  },
  mounted() {

    this.initGraph(this.testGraph,{
      nodeId: d => d.id,
      nodeGroup: d => d.group,
      nodeTitle: d => `${d.id}\n${d.group}`,
      linkStrokeWidth: l => Math.sqrt(l.value),
      width :640,
      height: 600,
      // invalidation // a promise to stop the simulation when the cell is re-run
    })
  },
  methods: {
    initGraph({
      nodes, // an iterable of node objects (typically [{id}, …])
      links // an iterable of link objects (typically [{source, target}, …])
    }, {
      nodeId = d => d.id, // given d in nodes, returns a unique identifier (string)
      nodeGroup, // given d in nodes, returns an (ordinal) value for color
      nodeGroups, // an array of ordinal values representing the node groups
      nodeTitle, // given d in nodes, a title string
      nodeFill = "currentColor", // node stroke fill (if not using a group color encoding)
      nodeStroke = "#fff", // node stroke color
      nodeStrokeWidth = 1.5, // node stroke width, in pixels
      nodeStrokeOpacity = 1, // node stroke opacity
      nodeRadius = 5, // node radius, in pixels
      nodeStrength,
      linkSource = ({source}) => source, // given d in links, returns a node identifier string
      linkTarget = ({target}) => target, // given d in links, returns a node identifier string
      linkStroke = "#999", // link stroke color
      linkStrokeOpacity = 0.6, // link stroke opacity
      linkStrokeWidth = 1.5, // given d in links, returns a stroke width in pixels
      linkStrokeLinecap = "round", // link stroke linecap
      linkStrength,
      // colors = d3.schemeTableau10, // an array of color strings, for the node groups
      colors = d3.schemeCategory10,// -十个分类颜色的数组,表示为 RGB 十六进制字符串。
      width = 640, // outer width, in pixels
      height = 400, // outer height, in pixels
      //invalidation(失效)
      // invalidation // when this promise resolves, stop the simulation
    } = {}) {
      // Compute values.
      const N = d3.map(nodes, nodeId).map(intern);//生成一个map对象
      const LS = d3.map(links, linkSource).map(intern);
      const LT = d3.map(links, linkTarget).map(intern);
      if (nodeTitle === undefined) nodeTitle = (_, i) => N[i];
      const T = nodeTitle == null ? null : d3.map(nodes, nodeTitle);
      const G = nodeGroup == null ? null : d3.map(nodes, nodeGroup).map(intern);
      const W = typeof linkStrokeWidth !== "function" ? null : d3.map(links, linkStrokeWidth);
      const L = typeof linkStroke !== "function" ? null : d3.map(links, linkStroke);


      // Replace the input nodes and links with mutable(可变的) objects for the simulation.
      nodes = d3.map(nodes, (_, i) => ({id: N[i]}));
      links = d3.map(links, (_, i) => ({source: LS[i], target: LT[i]}));

      // Compute default domains.
      if (G && nodeGroups === undefined) nodeGroups = d3.sort(G);

      // Construct the scales(规模,等级,尺寸).序数比例尺,将一组命名类别映射到一组颜色
      const color = nodeGroup == null ? null : d3.scaleOrdinal(nodeGroups, colors);

      // Construct the forces.
      const forceNode = d3.forceManyBody();
      const forceLink = d3.forceLink(links).id(({index: i}) => N[i]);
      if (nodeStrength !== undefined) forceNode.strength(nodeStrength);
      if (linkStrength !== undefined) forceLink.strength(linkStrength);

      const simulation = d3.forceSimulation(nodes)
          .force("link", forceLink)
          .force("charge", forceNode)
          .force("center",  d3.forceCenter())
          .on("tick", ticked);

      // const svg = d3.create("svg")
      //     .attr("width", width)
      //     .attr("height", height)
      //     .attr("viewBox", [-width / 2, -height / 2, width, height])
      //     .attr("style", "max-width: 100%; height: auto; height: intrinsic;");
      //重写,node和link的容器
      const svg = d3.select(".container")
        .append("svg")
        .attr("width", width)
        .attr("height", height)
        .attr("viewBox", [-width / 2, -height / 2, width, height])
        .attr("style", "max-width: 100%; height: auto; height: intrinsic;");

      const link = svg.append("g")
          .attr("stroke", typeof linkStroke !== "function" ? linkStroke : null)
          .attr("stroke-opacity", linkStrokeOpacity)
          .attr("stroke-width", typeof linkStrokeWidth !== "function" ? linkStrokeWidth : null)
          .attr("stroke-linecap", linkStrokeLinecap)
        .selectAll("line")
        .data(links)
        .join("line");

      const node = svg.append("g")
          .attr("fill", nodeFill)
          .attr("stroke", nodeStroke)
          .attr("stroke-opacity", nodeStrokeOpacity)
          .attr("stroke-width", nodeStrokeWidth)
        .selectAll("circle")
        .data(nodes)
        .join("circle")
          .attr("r", nodeRadius)
          // .call(drag(simulation)
          .call(drag(simulation));

      if (W) link.attr("stroke-width", ({index: i}) => W[i]);
      if (L) link.attr("stroke", ({index: i}) => L[i]);
      if (G) node.attr("fill", ({index: i}) => color(G[i]));
      if (T) node.append("title").text(({index: i}) => T[i]);//鼠标悬浮时,节点显示的信息
      // node.append('title').text(d => d.id);
      // if (invalidation != null) invalidation.then(() => simulation.stop());


      //intern(实习生,扣留)
      //传给迭代器函数map的函数,用来筛选值
      function intern(value) {
        return value !== null && typeof value === "object" ? value.valueOf() : value;
      }
      //tick 给……打勾
      function ticked() {
        link
          .attr("x1", d => d.source.x)
          .attr("y1", d => d.source.y)
          .attr("x2", d => d.target.x)
          .attr("y2", d => d.target.y);

        node
          .attr("cx", d => d.x)
          .attr("cy", d => d.y);
      }

      function drag(simulation) {
        //拖动开始
        function dragstarted(event) {
          if (!event.active) simulation.alphaTarget(0.3).restart();
          event.subject.fx = event.subject.x;
          event.subject.fy = event.subject.y;
        }
        //拖动
        function dragged(event) {
          event.subject.fx = event.x;
          event.subject.fy = event.y;
        }
        //拖动结束
        function dragended(event) {
          if (!event.active) simulation.alphaTarget(0);
          event.subject.fx = null;
          event.subject.fy = null;
        }
        //绑定返回
        return d3.drag()
          .on("start", dragstarted)
          .on("drag", dragged)
          .on("end", dragended);
      }

      //Object.assign()合并两个对象
      return Object.assign(svg.node(), {scales: {color}});
    }

  },
}
</script>

<!-- Add "scoped" attribute to limit CSS to this component only -->
<style scoped>

</style>
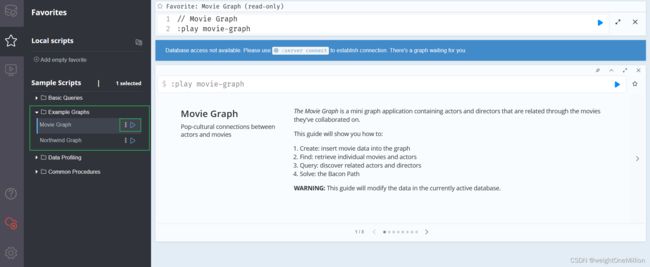
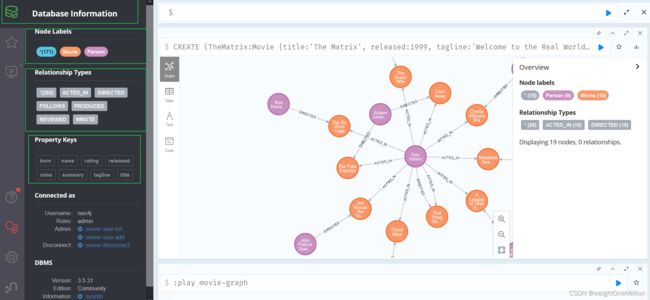
1.2Neo4j
-
Open Neo4j Browser
Start Up the Neo4j Browser Visit: http://localhost:7474/
 Default login is username ‘neo4j’ and password ‘neo4j’ (full installation instructions below)
然后可以重设用户名密码

SpringBoot连接Neo4j
https://spring.io/guides/gs/accessing-data-neo4j/文档
做的时候和文档不太一样
org.springframework.boot
spring-boot-starter-data-neo4j
spring.neo4j.uri=bolt://localhost:7687
spring.data.neo4j.username=neo4j
spring.data.neo4j.password=secret
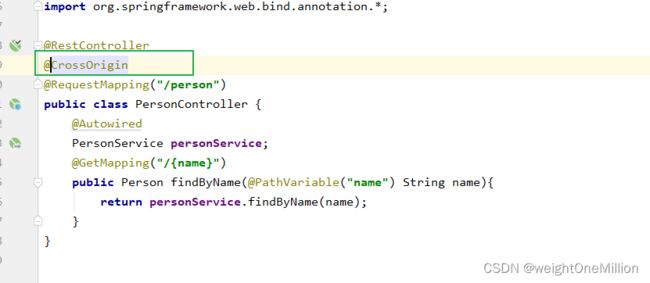
跨域
测试
前端
this.axios.get('http://localhost:8329/person/'+'Kiefer Sutherland')
   .then((relove)=>{
     console.log(relove)
   })
   .catch((error)=>{
     console.log(error)
   })
后端
 @GetMapping("/{name}")
    public Person findByName(@PathVariable("name") String name){
        return personServiindByName(name);
    }
1.3其他
vue咱学过了,咱会哈
VSCODE搭建vue脚手架
 vue create 01_vue,选择的是vue2,3咱还不会
2 一个实践
前后端分离,从数据库中获得人物与电影之间的关系,生成力图
just be like:
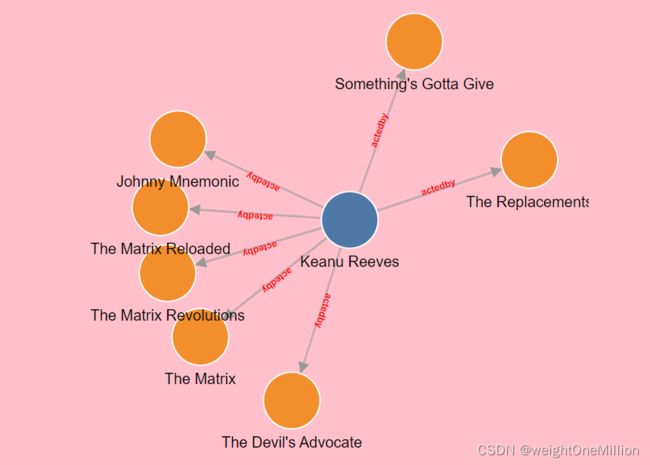
2.1从后端获取节点和连接线的数据,并初始化svg
mounted(){
    var _this = this
    console.log(this.testGraph)
    this.axios.get('http://localhost:8329/person/queryNodes/'+'actedby'+'/'+'Keanu Reeves')
    .then((resolve)=>{
      console.log(resolve)
      _this.testGraph["nodes"] = resolve.data;
      _this.axios.get('http://localhost:8329/person/queryLinks/'+'actedby'+'/'+'Keanu Reeves')
      .then((resolve)=>{
        console.log(resolve)
        _this.testGraph["links"] = resolve.data;
         this.ForceGraph(_this.testGraph, {
          nodeId: d => d.id,
          nodeGroup: d => d.group,
          nodeTitle: d => `${d.id}\n${d.group}`,
          linkStrokeWidth: l => Math.sqrt(l.value),
          width: 640,
          height: 600,
          // invalidation // a promise to stop the simulation when the cell is re-run
        })
      })
      .catch((error)=>{
        console.log(error);
      })
    })
    .catch((error)=>{
      console.log(error);
    })

  },
本来想把异步函数(获取数据的axios)写在created里,但是不知道为什么初始化时获得的数据为空,可能是。。。还不清楚是什么问题,如果有人解答,感激不尽
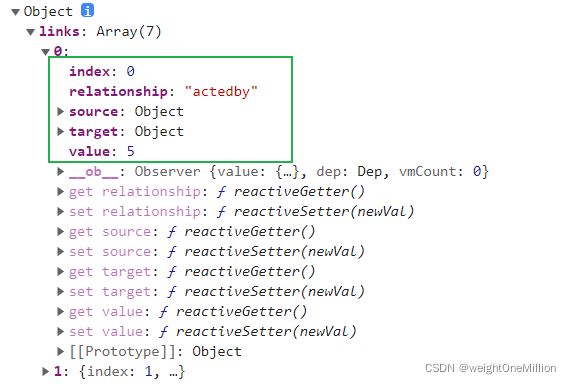
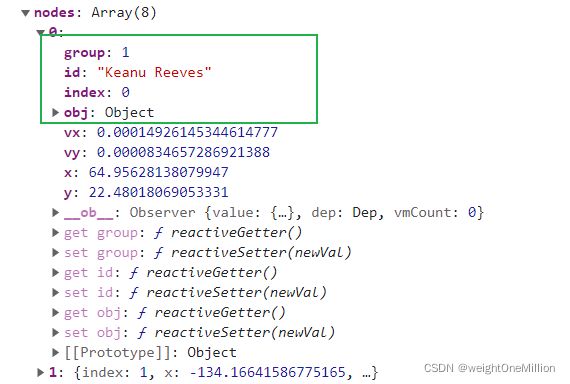
看一眼前端数据的格式
2.2生成节点和节点内容
const node = svg.append("g")
          .attr("fill", nodeFill)
          .attr("stroke", nodeStroke)
          .attr("stroke-opacity", nodeStrokeOpacity)
          .attr("stroke-width", nodeStrokeWidth)
      .selectAll("circle")
      .data(nodes)
      .join("circle")
          .attr("r", nodeRadius)
          .call(drag(simulation));


      const nodeText = svg.append("g")
        .selectAll("text")
        .data(nodes)
        .join("text")
        .text(d => d.id)//填充的内容
        .attr("dx",function () {//水平方向上偏移,是文本内容宽度的一半
          return this.getBoundingClientRect().width/2*(-1)
        })
        .attr("dy",50)
        .attr("class","nodeText")
ticked函数
 node
  .attr("cx", d => d.x)
  .attr("cy", d => d.y);

nodeText
  .attr("x",d => d.x)
  .attr("y",d => d.y);
2.3 生成线
将线的类型从line改为path,更为灵活
const link = svg.append("g")
          .attr("stroke", typeof linkStroke !== "function" ? linkStroke : null)
          .attr("stroke-opacity", linkStrokeOpacity)
          .attr("stroke-width", typeof linkStrokeWidth !== "function" ? linkStrokeWidth : null)
          .attr("stroke-linecap", linkStrokeLinecap)
          .attr("marker-end", "url(#positiveMarker)")//在末尾处进行标记,url指明标记的内容,这个用于生成连接线末尾的标记,具体看2.4
      .selectAll("path")//path 比line更加灵活
      .data(links)
      .join("path")
      //给path增加一个属性id,使得文字能够依附在线上,这个用于将连接线上的内容与连接线绑定,具体看2.5
      .attr("id",d => d.source.id+"_"+d.relationship+"_"+d.target.id);
ticked函数
link
   //意为起点的(x1,y1)到终点的(x2,y2)之间的连线
    // .attr("x1", d => d.source.x)
    // .attr("y1", d => d.source.y)
    // .attr("x2", d => d.target.x)
    // .attr("y2", d => d.target.y);
    //path和line指明路径的方式不一样
    //意为画笔移动到(Move)(d.source.x,d.source.y)画一条线(Line)到点(d.target.x,d.target.y)
    .attr("d",d=>'M'+d.source.x+" "+d.source.y+"L"+d.target.x+" "+d.target.y)
2.4 生成末尾箭头
const marker = svg.append("marker")
        .attr("id","positiveMarker")//给一个id属性,link就能获得这个id
        .attr("orient","auto")//自动调整方向
        .attr("stroke-width",2)//箭头粗细
        .attr("markerUnits", "strokeWidth")//匹配调整粗细的问题
        .attr("markerUnits", "userSpaceOnUse")//匹配调整粗细的问题
        .attr("viewBox", "0 -5 10 10")//箭头所在的可视范围
        .attr("refX", 35)//偏移
        .attr("refY", 0)//
        .attr("markerWidth", 12)
        .attr("markerHeight", 12)
        .append("path")
        .attr("d", "M 0 -5 L 10 0 L 0 5")//path的形状
        .attr('fill', '#999')
        .attr("stroke-opacity", 0.6);
2.5 生成连接线上的内容
const linksName = svg.append("g")
        .selectAll("text")
        .data(links)
        .join("text")
        .attr('x',100)
        .attr('y',80)
        .style('text-anchor','middle')
        .style('fill', 'red')
        .style('font-size', '10px')
        .style('font-weight', 'bold')
        .append('textPath')//将textpath的g标签放在text下
        //path的id
        .attr(
          'xlink:href',d =>"#"+d.source.id+"_"+d.relationship+"_"+d.target.id
        )
        .text(d => d.relationship);
2.6 完整代码
注释没有删,而且没有搞明白为什么在
<template>
  <div>
    <div class="container">

    </div>
  </div>
</template>

<script>
import * as d3 from 'd3'


export default {
  name: 'Test01',
  props: {},

  data() {
    return {
      nodes: [],
      links: [],
      testGraph : {
        "nodes": [],
        "links": []
      }
      // testGraph : {

      // }
    }
  },

  mounted(){
    var _this = this
    console.log(this.testGraph)

    this.axios.get('http://localhost:8329/person/queryNodes/'+'actedby'+'/'+'Keanu Reeves')
    .then((resolve)=>{
      console.log(resolve)
      _this.testGraph["nodes"] = resolve.data;
      _this.axios.get('http://localhost:8329/person/queryLinks/'+'actedby'+'/'+'Keanu Reeves')
      .then((resolve)=>{
        console.log(resolve)
        _this.testGraph["links"] = resolve.data;
         this.ForceGraph(_this.testGraph, {
          nodeId: d => d.id,
          nodeGroup: d => d.group,
          nodeTitle: d => `${d.id}\n${d.group}`,
          linkStrokeWidth: l => Math.sqrt(l.value),
          width: 640,
          height: 600,
          // invalidation // a promise to stop the simulation when the cell is re-run
        })
      })
      .catch((error)=>{
        console.log(error);
      })
    })
    .catch((error)=>{
      console.log(error);
    })

  },

  methods: {
    ForceGraph({
      nodes, // an iterable of node objects (typically [{id}, …])
      links // an iterable of link objects (typically [{source, target}, …])
    }, {
      nodeId = d => d.id, // given d in nodes, returns a unique identifier (string)
      nodeGroup, // given d in nodes, returns an (ordinal) value for color
      nodeGroups, // an array of ordinal values representing the node groups
      nodeTitle, // given d in nodes, a title string
      nodeFill = "currentColor", // node stroke fill (if not using a group color encoding)
      nodeStroke = "#fff", // node stroke color
      nodeStrokeWidth = 1.5, // node stroke width, in pixels
      nodeStrokeOpacity = 1, // node stroke opacity
      nodeRadius = 30, // node radius, in pixels
      nodeStrength,
      linkSource = ({source}) => source, // given d in links, returns a node identifier string
      linkTarget = ({target}) => target, // given d in links, returns a node identifier string
      linkStroke = "#999", // link stroke color
      linkStrokeOpacity = 0.6, // link stroke opacity
      linkStrokeWidth = 1.5, // given d in links, returns a stroke width in pixels
      linkStrokeLinecap = "round", // link stroke linecap
      linkStrength,
      colors = d3.schemeTableau10, // an array of color strings, for the node groups
      width = 640, // outer width, in pixels
      height = 400, // outer height, in pixels
      // invalidation // when this promise resolves, stop the simulation
    } = {}) {

      // Compute values.
      const N = d3.map(nodes, nodeId).map(intern);
      const LS = d3.map(links, linkSource).map(intern);
      const LT = d3.map(links, linkTarget).map(intern);
      if (nodeTitle === undefined) nodeTitle = (_, i) => N[i];
      const T = nodeTitle == null ? null : d3.map(nodes, nodeTitle);
      const G = nodeGroup == null ? null : d3.map(nodes, nodeGroup).map(intern);
      const W = typeof linkStrokeWidth !== "function" ? null : d3.map(links, linkStrokeWidth);
      const L = typeof linkStroke !== "function" ? null : d3.map(links, linkStroke);

      // Replace the input nodes and links with mutable objects for the simulation.
      // nodes = d3.map(nodes, (_, i) => ({id: N[i]}));
      // links = d3.map(links, (_, i) => ({source: LS[i], target: LT[i]}));

      // Compute default domains.
      if (G && nodeGroups === undefined) nodeGroups = d3.sort(G);

      // Construct the scales.
      const color = nodeGroup == null ? null : d3.scaleOrdinal(nodeGroups, colors);

      // Construct the forces.
      const forceNode = d3.forceManyBody();
      const forceLink = d3.forceLink(links).id(({index: i}) => N[i]).distance(200);
      if (nodeStrength !== undefined) forceNode.strength(nodeStrength);
      if (linkStrength !== undefined) forceLink.strength(linkStrength);

      const simulation = d3.forceSimulation(nodes)
          .force("link", forceLink)
          .force("charge", forceNode)
          .force("center",  d3.forceCenter())
          .on("tick", ticked);

      // const svg = d3.create("svg")
      //     .attr("width", width)
      //     .attr("height", height)
      //     .attr("viewBox", [-width / 2, -height / 2, width, height])
      //     .attr("style", "max-width: 100%; height: auto; height: intrinsic;");
       //重写,node和link的容器
      const svg = d3.select(".container")
        .append("svg")
        .attr("width", width)
        .attr("height", height)
        .attr("viewBox", [-width / 2, -height / 2, width, height])
        .attr("style", "max-width: 100%; height: auto; height: intrinsic;");

      const marker = svg.append("marker")
        .attr("id","positiveMarker")//指明方向
        .attr("orient","auto")//自动调整方向
        .attr("stroke-width",2)//箭头粗细
        .attr("markerUnits", "strokeWidth")//匹配调整粗细的问题
        .attr("markerUnits", "userSpaceOnUse")//匹配调整粗细的问题
        .attr("viewBox", "0 -5 10 10")//箭头所在的可视范围
        .attr("refX", 35)//偏移
        .attr("refY", 0)//
        .attr("markerWidth", 12)
        .attr("markerHeight", 12)
        .append("path")
        .attr("d", "M 0 -5 L 10 0 L 0 5")//path的形状
        .attr('fill', '#999')
        .attr("stroke-opacity", 0.6);
        // const negativeMarker = this.svgArea.append("marker")
        //     .attr("id","negativeMarker")
        //     .attr("orient","auto")
        //     .attr("stroke-width",2)
        //     .attr("markerUnits", "strokeWidth")
        //     .attr("markerUnits", "userSpaceOnUse")
        //     .attr("viewBox", "0 -5 10 10")
        //     .attr("refX", -25)
        //     .attr("refY", 0)
        //     .attr("markerWidth", 12)
        //     .attr("markerHeight", 12)
        //     .append("path")
        //     .attr("d", "M 10 -5 L 0 0 L 10 5")
        //     .attr('fill', '#999')
        //     .attr("stroke-opacity", 0.6);

      const link = svg.append("g")
          .attr("stroke", typeof linkStroke !== "function" ? linkStroke : null)
          .attr("stroke-opacity", linkStrokeOpacity)
          .attr("stroke-width", typeof linkStrokeWidth !== "function" ? linkStrokeWidth : null)
          .attr("stroke-linecap", linkStrokeLinecap)
          .attr("marker-end", "url(#positiveMarker)")//在末尾处进行标记,url指明标记的内容
      .selectAll("path")//path 比line更加灵活
      // .data(links)
      .data(links)
      .join("path")
      //给path增加一个属性id,使得文字能够依附在线上
      .attr("id",d => d.source.id+"_"+d.relationship+"_"+d.target.id);


      const linksName = svg.append("g")
        .selectAll("text")
        .data(links)
        .join("text")
        .attr('x',100)
        .attr('y',80)
        .style('text-anchor','middle')
        .style('fill', 'red')
        .style('font-size', '10px')
        .style('font-weight', 'bold')
        .append('textPath')//将textpath的g标签放在text下
        //path的id
        .attr(
          'xlink:href',d =>"#"+d.source.id+"_"+d.relationship+"_"+d.target.id
        )
        .text(d => d.relationship);


      const node = svg.append("g")
          .attr("fill", nodeFill)
          .attr("stroke", nodeStroke)
          .attr("stroke-opacity", nodeStrokeOpacity)
          .attr("stroke-width", nodeStrokeWidth)
      .selectAll("circle")
      .data(nodes)
      .join("circle")
          .attr("r", nodeRadius)
          .call(drag(simulation));


      const nodeText = svg.append("g")
        .selectAll("text")
        .data(nodes)
        .join("text")
        .text(d => d.id)
        .attr("dx",function () {
          return this.getBoundingClientRect().width/2*(-1)
        })
        .attr("dy",50)
        .attr("class","nodeText")


      if (W) link.attr("stroke-width", ({index: i}) => W[i]);
      if (L) link.attr("stroke", ({index: i}) => L[i]);
      if (G) node.attr("fill", ({index: i}) => color(G[i]));
      if (T) node.append("title").text(({index: i}) => T[i]);
      // if (invalidation != null) invalidation.then(() => simulation.stop());

      function intern(value) {
        return value !== null && typeof value === "object" ? value.valueOf() : value;
      }

      function ticked() {
        link
            //意为起点的(x1,y1)到终点的(x2,y2)之间的连线
            // .attr("x1", d => d.source.x)
            // .attr("y1", d => d.source.y)
            // .attr("x2", d => d.target.x)
            // .attr("y2", d => d.target.y);
            //path和line指明路径的方式不一样
            //意为起点移动到(Move)(d.source.x,d.source.y)画一条线(Line)到点(d.target.x,d.target.y)
            .attr("d",d=>'M'+d.source.x+" "+d.source.y+"L"+d.target.x+" "+d.target.y)

        node
            .attr("cx", d => d.x)
            .attr("cy", d => d.y);

        nodeText
            .attr("x",d => d.x)
            .attr("y",d => d.y);
      }

      function drag(simulation) {
        function dragstarted(event) {
            if (!event.active) simulation.alphaTarget(0.3).restart();
            event.subject.fx = event.subject.x;
            event.subject.fy = event.subject.y;
        }

        function dragged(event) {
            event.subject.fx = event.x;
            event.subject.fy = event.y;
        }

        function dragended(event) {
            if (!event.active) simulation.alphaTarget(0);
            event.subject.fx = null;
            event.subject.fy = null;
        }

        return d3.drag()
            .on("start", dragstarted)
            .on("drag", dragged)
            .on("end", dragended);
      }

      return Object.assign(svg.node(), {scales: {color}});
    }
  },
}
</script>

<!-- Add "scoped" attribute to limit CSS to this component only -->
<style scoped>
body{
  margin: 0px;
}
.container{
  background-color : pink;
}
.node{
  stroke:#fff;
  stroke-width:1;
  cursor: pointer;
}

.node:hover{
  stroke-width:5;
}

.nodeText{
  fill:white;
}
</style>
参考
B站视频地址:https://www.bilibili.com/video/BV11Q4y1M7MS?p=1
D3API:https://www.d3js.org.cn/document/
svg起步:https://www.d3js.org.cn/svg/get_start/

