【Machine Learning】2.代价函数和梯度下降
代价函数和梯度下降
- 1.理论
-
- 1.1 代价函数
- 1.2 梯度下降
- 2.函数实现
-
- 2.1 代价估计
- 2.2 梯度下降
- 3.课后作业
本文包括代价计算和梯度下降的理论部分和实践部分,并留有课后作业
1.理论
1.1 代价函数
一个用来预测的线性模型 f w , b ( x ( i ) ) f_{w,b}(x^{(i)}) fw,b(x(i)):
f w , b ( x ( i ) ) = w x ( i ) + b (1) f_{w,b}(x^{(i)}) = wx^{(i)} + b \tag{1} fw,b(x(i))=wx(i)+b(1)
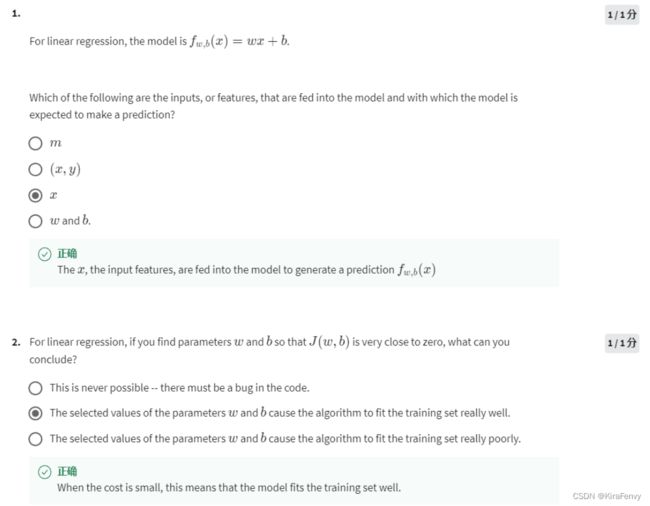
In linear regression, you utilize input training data to fit the parameters w w w, b b b by minimizing a measure of the error between our predictions f w , b ( x ( i ) ) f_{w,b}(x^{(i)}) fw,b(x(i)) and the actual data y ( i ) y^{(i)} y(i). (最小化预测值和实际值之间的误差,即代价)The measure is called the c o s t cost cost, J ( w , b ) J(w,b) J(w,b). In training you measure the cost over all of our training samples x ( i ) , y ( i ) x^{(i)},y^{(i)} x(i),y(i)
J ( w , b ) = 1 2 m ∑ i = 0 m − 1 ( f w , b ( x ( i ) ) − y ( i ) ) 2 (2) J(w,b) = \frac{1}{2m} \sum\limits_{i = 0}^{m-1} (f_{w,b}(x^{(i)}) - y^{(i)})^2\tag{2} J(w,b)=2m1i=0∑m−1(fw,b(x(i))−y(i))2(2)
- f w , b ( x ( i ) ) f_{w,b}(x^{(i)}) fw,b(x(i)) is our prediction for example i i i using parameters w , b w,b w,b. 这是预测结果
- ( f w , b ( x ( i ) ) − y ( i ) ) 2 (f_{w,b}(x^{(i)}) -y^{(i)})^2 (fw,b(x(i))−y(i))2 is the squared difference between the target value and the prediction. 目标值和预测值之差的平方
- These differences are summed over all the m m m examples and divided by
2mto produce the cost, J ( w , b ) J(w,b) J(w,b). 所有m个差之和除以2m
Note, in lecture summation ranges are typically from 1 to m, while code will be from 0 to m-1.
1.2 梯度下降
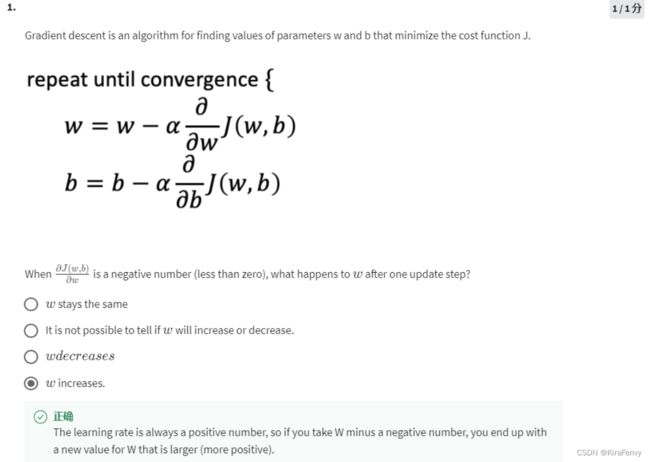
梯度下降 gradient descent was described as:
repeat until convergence:重复直到收敛 { w = w − α ∂ J ( w , b ) ∂ w b = b − α ∂ J ( w , b ) ∂ b } \begin{align*} \text{repeat}&\text{ until convergence:重复直到收敛} \; \lbrace \newline \; w &= w - \alpha \frac{\partial J(w,b)}{\partial w} \tag{3} \; \newline b &= b - \alpha \frac{\partial J(w,b)}{\partial b} \newline \rbrace \end{align*} repeatwb} until convergence:重复直到收敛{=w−α∂w∂J(w,b)=b−α∂b∂J(w,b)(3)
where, parameters w w w, b b b are updated simultaneously.(w和b同时更新,即计算所用的w值和b值均为旧值)
The gradient is defined as: 梯度定义时代入的计算式:
∂ J ( w , b ) ∂ w = 1 m ∑ i = 0 m − 1 ( f w , b ( x ( i ) ) − y ( i ) ) x ( i ) ∂ J ( w , b ) ∂ b = 1 m ∑ i = 0 m − 1 ( f w , b ( x ( i ) ) − y ( i ) ) \begin{align} \frac{\partial J(w,b)}{\partial w} &= \frac{1}{m} \sum\limits_{i = 0}^{m-1} (f_{w,b}(x^{(i)}) - y^{(i)})x^{(i)} \tag{4}\\ \frac{\partial J(w,b)}{\partial b} &= \frac{1}{m} \sum\limits_{i = 0}^{m-1} (f_{w,b}(x^{(i)}) - y^{(i)}) \tag{5}\\ \end{align} ∂w∂J(w,b)∂b∂J(w,b)=m1i=0∑m−1(fw,b(x(i))−y(i))x(i)=m1i=0∑m−1(fw,b(x(i))−y(i))(4)(5)
2.函数实现
2.1 代价估计
def compute_cost(x, y, w, b):
    """
    Computes the cost function for linear regression.

    Args:
      x (ndarray (m,)): Data, m examples
      y (ndarray (m,)): target values
      w,b (scalar)    : model parameters

    Returns
        total_cost (float): The cost of using w,b as the parameters for linear regression
               to fit the data points in x and y
    """
    # number of training examples
    m = x.shape[0]

    cost_sum = 0
    for i in range(m):
        f_wb = w * x[i] + b
        cost = (f_wb - y[i]) ** 2
        cost_sum += cost
    total_cost = (1 / (2 * m)) * cost_sum

    return total_cost
2.2 梯度下降
梯度计算,即
∂ J ( w , b ) ∂ w = 1 m ∑ i = 0 m − 1 ( f w , b ( x ( i ) ) − y ( i ) ) x ( i ) ∂ J ( w , b ) ∂ b = 1 m ∑ i = 0 m − 1 ( f w , b ( x ( i ) ) − y ( i ) ) \begin{align} \frac{\partial J(w,b)}{\partial w} &= \frac{1}{m} \sum\limits_{i = 0}^{m-1} (f_{w,b}(x^{(i)}) - y^{(i)})x^{(i)} \tag{4}\\ \frac{\partial J(w,b)}{\partial b} &= \frac{1}{m} \sum\limits_{i = 0}^{m-1} (f_{w,b}(x^{(i)}) - y^{(i)}) \tag{5}\\ \end{align} ∂w∂J(w,b)∂b∂J(w,b)=m1i=0∑m−1(fw,b(x(i))−y(i))x(i)=m1i=0∑m−1(fw,b(x(i))−y(i))(4)(5)
def compute_gradient(x, y, w, b):
    """
    Computes the gradient for linear regression
    Args:
      x (ndarray (m,)): Data, m examples
      y (ndarray (m,)): target values
      w,b (scalar)    : model parameters
    Returns
      dj_dw (scalar): The gradient of the cost w.r.t. the parameters w
      dj_db (scalar): The gradient of the cost w.r.t. the parameter b
     """

    # Number of training examples
    m = x.shape[0]
    dj_dw = 0
    dj_db = 0

    for i in range(m):
        f_wb = w * x[i] + b
        dj_dw_i = (f_wb - y[i]) * x[i]
        dj_db_i = f_wb - y[i]
        dj_db += dj_db_i
        dj_dw += dj_dw_i
    dj_dw = dj_dw / m
    dj_db = dj_db / m

    return dj_dw, dj_db
梯度下降,即
repeat until convergence:重复直到收敛 { w = w − α ∂ J ( w , b ) ∂ w b = b − α ∂ J ( w , b ) ∂ b } \begin{align*} \text{repeat}&\text{ until convergence:重复直到收敛} \; \lbrace \newline \; w &= w - \alpha \frac{\partial J(w,b)}{\partial w} \tag{3} \; \newline b &= b - \alpha \frac{\partial J(w,b)}{\partial b} \newline \rbrace \end{align*} repeatwb} until convergence:重复直到收敛{=w−α∂w∂J(w,b)=b−α∂b∂J(w,b)(3)
def gradient_descent(x, y, w_in, b_in, alpha, num_iters, cost_function, gradient_function):
    """
    Performs gradient descent to fit w,b. Updates w,b by taking
    num_iters gradient steps with learning rate alpha

    Args:
      x (ndarray (m,))  : Data, m examples
      y (ndarray (m,))  : target values
      w_in,b_in (scalar): initial values of model parameters
      alpha (float):     Learning rate
      num_iters (int):   number of iterations to run gradient descent
      cost_function:     function to call to produce cost
      gradient_function: function to call to produce gradient

    Returns:
      w (scalar): Updated value of parameter after running gradient descent
      b (scalar): Updated value of parameter after running gradient descent
      J_history (List): History of cost values
      p_history (list): History of parameters [w,b]
      """

    w = copy.deepcopy(w_in) # avoid modifying global w_in
    # An array to store cost J and w's at each iteration primarily for graphing later
    J_history = []
    p_history = []
    b = b_in
    w = w_in

    for i in range(num_iters):
        # Calculate the gradient and update the parameters using gradient_function
        dj_dw, dj_db = gradient_function(x, y, w , b)

        # Update Parameters using equation (3) above
        b = b - alpha * dj_db
        w = w - alpha * dj_dw

        # Save cost J at each iteration
        if i<100000:      # prevent resource exhaustion
            J_history.append( cost_function(x, y, w , b))
            p_history.append([w,b])
        # Print cost every at intervals 10 times or as many iterations if < 10
        if i% math.ceil(num_iters/10) == 0:
            print(f"Iteration {i:4}: Cost {J_history[-1]:0.2e} ",
                  f"dj_dw: {dj_dw: 0.3e}, dj_db: {dj_db: 0.3e}  ",
                  f"w: {w: 0.3e}, b:{b: 0.5e}")

    return w, b, J_history, p_history #return w and J,w history for graphing


调用:
# initialize parameters
w_init = 0
b_init = 0
# some gradient descent settings
iterations = 10000
tmp_alpha = 1.0e-2
# run gradient descent
w_final, b_final, J_hist, p_hist = gradient_descent(x_train ,y_train, w_init, b_init, tmp_alpha,
                                                    iterations, compute_cost, compute_gradient)
print(f"(w,b) found by gradient descent: ({w_final:8.4f},{b_final:8.4f})")

结果:
Iteration    0: Cost 7.93e+04  dj_dw: -6.500e+02, dj_db: -4.000e+02   w:  6.500e+00, b: 4.00000e+00
Iteration 1000: Cost 3.41e+00  dj_dw: -3.712e-01, dj_db:  6.007e-01   w:  1.949e+02, b: 1.08228e+02
Iteration 2000: Cost 7.93e-01  dj_dw: -1.789e-01, dj_db:  2.895e-01   w:  1.975e+02, b: 1.03966e+02
Iteration 3000: Cost 1.84e-01  dj_dw: -8.625e-02, dj_db:  1.396e-01   w:  1.988e+02, b: 1.01912e+02
Iteration 4000: Cost 4.28e-02  dj_dw: -4.158e-02, dj_db:  6.727e-02   w:  1.994e+02, b: 1.00922e+02
Iteration 5000: Cost 9.95e-03  dj_dw: -2.004e-02, dj_db:  3.243e-02   w:  1.997e+02, b: 1.00444e+02
Iteration 6000: Cost 2.31e-03  dj_dw: -9.660e-03, dj_db:  1.563e-02   w:  1.999e+02, b: 1.00214e+02
Iteration 7000: Cost 5.37e-04  dj_dw: -4.657e-03, dj_db:  7.535e-03   w:  1.999e+02, b: 1.00103e+02
Iteration 8000: Cost 1.25e-04  dj_dw: -2.245e-03, dj_db:  3.632e-03   w:  2.000e+02, b: 1.00050e+02
Iteration 9000: Cost 2.90e-05  dj_dw: -1.082e-03, dj_db:  1.751e-03   w:  2.000e+02, b: 1.00024e+02
(w,b) found by gradient descent: (199.9929,100.0116)
绘制matplotlib图:
# plot cost versus iteration
fig, (ax1, ax2) = plt.subplots(1, 2, constrained_layout=True, figsize=(12,4))  # 一行两列
ax1.plot(J_hist[:100]) # 数组的前100个数绘图
ax2.plot(1000 + np.arange(len(J_hist[1000:])), J_hist[1000:]) #从第1000个以后绘图
ax1.set_title("Cost vs. iteration(start)");  ax2.set_title("Cost vs. iteration (end)")
ax1.set_ylabel('Cost')            ;  ax2.set_ylabel('Cost')
ax1.set_xlabel('iteration step')  ;  ax2.set_xlabel('iteration step')
plt.show()


