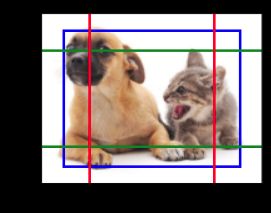
动手学深度学习(二十八)——目标物体检测+多尺度目标检测
文章目录
-
- 一、目标检测任务概述
- 二、目标检测和边界框
-
- 2.1 锚框定义及相关基础知识
- 2.2 基于锚框的目标检测算法
-
- 2.2.1 怎么去进行目标检测?
- 2.2.2 生成训练锚框+交并比比较锚框相似度
- 2.2.3 怎么去赋予锚框标号?
- 2.2.4 使用非极大值抑制(NMS)输出(每个类别保留一个框)
- 2.3 动手代码实现锚框
- 三、多尺度目标检测
-
- 3.1 多尺度目标检测综述
- 3.2 多尺度特征检测锚框生成示例
- 四、参考整理
一、目标检测任务概述
一是分类(Classification),即是将图像结构化为某一类别的信息,用事先确定好的类别(string)或实例ID来描述图片。这一任务是最简单、最基础的图像理解任务,也是深度学习模型最先取得突破和实现大规模应用的任务。其中,ImageNet是最权威的评测集,每年的ILSVRC催生了大量的优秀深度网络结构,为其他任务提供了基础。在应用领域,人脸、场景的识别等都可以归为分类任务。
二是检测(Detection)。分类任务关心整体,给出的是整张图片的内容描述,而检测则关注特定的物体目标,要求同时获得这一目标的类别信息和位置信息。相比分类,检测给出的是对图片前景和背景的理解,我们需要从背景中分离出感兴趣的目标,并确定这一目标的描述(类别和位置),因而,检测模型的输出是一个列表,列表的每一项使用一个数据组给出检出目标的类别和位置(常用矩形检测框的坐标表示)。
三是分割(Segmentation)。分割包括语义分割(semantic segmentation)和实例分割(instance segmentation),前者是对前背景分离的拓展,要求分离开具有不同语义的图像部分,而后者是检测任务的拓展,要求描述出目标的轮廓(相比检测框更为精细)。分割是对图像的像素级描述,它赋予每个像素类别(实例)意义,适用于理解要求较高的场景,如无人驾驶中对道路和非道路的分割。
参考:https://zhuanlan.zhihu.com/p/34142321
二、目标检测和边界框
2.1 锚框定义及相关基础知识
Hightly comments:https://zhuanlan.zhihu.com/p/63024247
直观地用代码解释和展开一下什么是锚框:
%matplotlib inline
import torch
from d2l import torch as d2l
import matplotlib.pyplot as plt
import matplotlib.image as mpimg
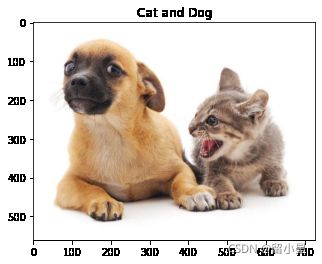
加在一张图片进行测试
# 加载示例图像
img_path = "./data/Coco/catdog.jpg"
img_data = mpimg.imread(img_path)

plt.figure()
# plt.axis('off')
plt.imshow(img_data)
plt.title("Cat and Dog")
plt.show()
定义两个函数进行两种不同边框表示方法的转换
def box_corner_to_center(boxes):
    """从(左上,右下)转换到(中间,宽度,高度)"""
    x1,y1,x2,y2 = boxes[:,0],boxes[:,1],boxes[:,2],boxes[:,3]
    cx = (x1+x2)/2
    cy = (y1+y2)/2
    w = x2 - x1
    h = y2 - y1
    boxes = torch.stack((cx,cy,w,h),axis=-1)
    return boxes

def box_center_to_corner(boxes):
    """从(中间,宽度,高度)转换到(左上,右下)"""
    cx,cy,w,h = boxes[:,0],boxes[:,1],boxes[:,2],boxes[:,3]
    x1 = cx-0.5*w
    y1 = cy-0.5*h
    x2 = cx+0.5*w
    y2 = cy+0.5*h
    boxes = torch.stack((x1,y1,x2,y2),axis=-1)
    return boxes
# 定义图像中猫狗的边界
# bbox是边界框的英文缩写
dog_bbox, cat_bbox = [60.0, 45.0, 378.0, 516.0], [400.0, 112.0, 655.0, 493.0]
# 将边界框绘制出来
def bbox_to_rect(bbox,color):
    return plt.Rectangle((bbox[0],bbox[1]),bbox[2]-bbox[0],bbox[3]-bbox[1],fill=False,edgecolor=color,linewidth=2)

fig = d2l.plt.imshow(img_data)
fig.axes.add_patch(bbox_to_rect(dog_bbox,'blue'))
fig.axes.add_patch(bbox_to_rect(cat_bbox,'red'))
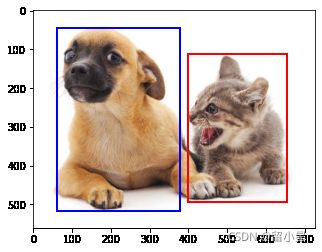
上面的篮框和红框就是我们手动添加的两个锚框了,我们结下来的目的就是自动添加更多不同尺度大小的锚框,用来覆盖整个feature map中的不同特征。
2.2 基于锚框的目标检测算法
2.2.1 怎么去进行目标检测?
- 提出多个被称为锚框的区域(边缘框)
- 预测每个锚框里是否含有关注的物体
- 如果目标物体在锚框之中,预测从这个锚框到真实边缘的偏移
2.2.2 生成训练锚框+交并比比较锚框相似度
IoU-交并比:用来比较两个框之间的相似度
- 0 表示无重叠,1表示重合
- 用Jacquard指数的特殊表达式表示
J ( A , B ) = ∣ A ⋂ B ∣ ∣ A ⋃ B ∣ J(A,B) = \frac{|A \bigcap B|}{|A \bigcup B|} J(A,B)=∣A⋃B∣∣A⋂B∣
2.2.3 怎么去赋予锚框标号?
- 每个锚框是一个训练样本
- 将每个锚框,要么标注为背景,要么关联上一个真实边缘框
- 我们将会生成大量的锚框(会导致大量的负类样本)
边缘框是真实的框,而锚框是我们假定的框,当两个框之间的IoU值最高,表示相关性最强。
依次排序获取到最佳的结果
2.2.4 使用非极大值抑制(NMS)输出(每个类别保留一个框)
每个锚框预测一个边缘框
NMS可以合并相似的预测
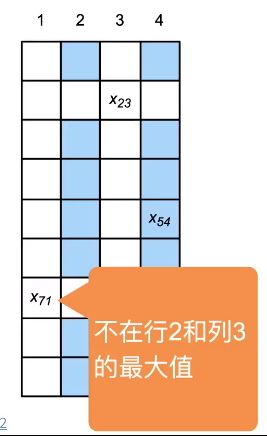
- 选中是非背景类的最大预测值
- 去掉所有其他和它IoU值大于 θ \theta θ的预测
- 重复上面的步骤直到所有的预测要么被选中要么被去掉
2.3 动手代码实现锚框
%matplotlib inline
import torch
from d2l import torch as d2l

torch.set_printoptions(2)  # 精简打印精度
假设输入图像的高度为 h h h,宽度为 w w w。我们以图像的每个像素为中心生成不同形状的锚框:比例 为 s ∈ ( 0 , 1 ] s\in (0, 1] s∈(0,1],宽高比(宽高比)为 r > 0 r > 0 r>0。那么锚框的宽度和高度分别是 w s r ws\sqrt{r} wsr 和 h s / r hs/\sqrt{r} hs/r。 请注意,当中心位置给定时,已知宽和高的锚框是确定的。 (其实我自己这里推导出来的宽高和沐神推导的还不太相同,但是这里还是按照沐神给的结果进行的代码编写!)
要生成多个不同形状的锚框,让我们设置一系列刻度 s 1 , … , s n s_1,\ldots, s_n s1,…,sn 和一系列宽高比 r 1 , … , r m r_1,\ldots, r_m r1,…,rm。当使用这些比例和长宽比的所有组合以每个像素为中心时,输入图像将总共有 w h n m whnm whnm 个锚框。尽管这些锚框可能会覆盖所有地面真实边界框,但计算复杂性很容易过高。
在实践中,(我们只考虑)包含 s 1 s_1 s1 或 r 1 r_1 r1 的(组合:)
( s 1 , r 1 ) , ( s 1 , r 2 ) , … , ( s 1 , r m ) , ( s 2 , r 1 ) , ( s 3 , r 1 ) , … , ( s n , r 1 ) . (s_1, r_1), (s_1, r_2), \ldots, (s_1, r_m), (s_2, r_1), (s_3, r_1), \ldots, (s_n, r_1). (s1,r1),(s1,r2),…,(s1,rm),(s2,r1),(s3,r1),…,(sn,r1). 也就是说,以同一像素为中心的锚框的数量是 n + m − 1 n+m-1 n+m−1。对于整个输入图像,我们将共生成 w h ( n + m − 1 ) wh(n+m-1) wh(n+m−1) 个锚框。
# 生成多个锚框
# 输入图像、尺寸列表、宽高列表,返回所有的锚框
def multibox_prior(data,sizes,ratios):
    """生成以每个像素为中心具有不同形状的锚框。"""
    in_height, in_width = data.shape[-2:]
    device, num_sizes, num_ratios = data.device, len(sizes), len(ratios)
    boxes_per_pixel = (num_sizes + num_ratios - 1)
    size_tensor = torch.tensor(sizes, device=device)
    ratio_tensor = torch.tensor(ratios, device=device)

    # 为了将锚点移动到像素的中心,需要设置偏移量。
    # 因为一个像素的的高为1且宽为1,我们选择偏移我们的中心0.5
    offset_h, offset_w = 0.5, 0.5
    steps_h = 1.0 / in_height  # Scaled steps in y axis
    steps_w = 1.0 / in_width  # Scaled steps in x axis

    # 生成锚框的所有中心点,并做了归一化
    center_h = (torch.arange(in_height, device=device) + offset_h) * steps_h
    center_w = (torch.arange(in_width, device=device) + offset_w) * steps_w
    shift_y, shift_x = torch.meshgrid(center_h, center_w)
    shift_y, shift_x = shift_y.reshape(-1), shift_x.reshape(-1)

    # 生成“boxes_per_pixel”个高和宽,
    # 之后用于创建锚框的四角坐标 (xmin, xmax, ymin, ymax)
    w = torch.cat((size_tensor * torch.sqrt(ratio_tensor[0]),
                   sizes[0] * torch.sqrt(ratio_tensor[1:])))\
                   * in_height / in_width  # Handle rectangular inputs
    h = torch.cat((size_tensor / torch.sqrt(ratio_tensor[0]),
                   sizes[0] / torch.sqrt(ratio_tensor[1:])))
    # 除以2来获得半高和半宽
    anchor_manipulations = torch.stack(
        (-w, -h, w, h)).T.repeat(in_height * in_width, 1) / 2

    # 每个中心点都将有“boxes_per_pixel”个锚框,
    # 所以生成含所有锚框中心的网格,重复了“boxes_per_pixel”次
    out_grid = torch.stack([shift_x, shift_y, shift_x, shift_y],
                           dim=1).repeat_interleave(boxes_per_pixel, dim=0)
    output = out_grid + anchor_manipulations
    return output.unsqueeze(0)
img = d2l.plt.imread('./data/Coco/catdog.jpg')
print("The shape of figure: {}".format(img.shape))
h, w = img.shape[:2]

print("The width of figure {} pixel,and the height of figure:{} pixel".format(w, h))
X = torch.rand(size=(1, 3, h, w))
# 我们可以看到[**返回的锚框变量 `Y` 的形状**]是(批量大小,锚框的数量,4)。
Y = multibox_prior(X, sizes=[0.75, 0.5, 0.25], ratios=[1, 2, 0.5])
Y.shape
The shape of figure: (561, 728, 3)
The width of figure 728 pixel,and the height of figure:561 pixel
torch.Size([1, 2042040, 4])
将锚框变量 Y 的形状更改为(图像高度、图像宽度、以同一像素为中心的锚框的数量,4)后,我们就可以获得以指定像素的位置为中心的所有锚框了。在接下来的内容中,我们[访问以 (250, 250) 为中心的第一个锚框]。它有四个元素:锚框左上角的 ( x , y ) (x, y) (x,y) 轴坐标和右下角的 ( x , y ) (x, y) (x,y) 轴坐标。将两个轴的坐标分别除以图像的宽度和高度后,所得的值就介于 0 和 1 之间。
boxes = Y.reshape(h, w, 5, 4)
boxes[250, 250, 0, :]
tensor([0.06, 0.07, 0.63, 0.82])
#@save
def show_bboxes(axes, bboxes, labels=None, colors=None):
    """显示所有边界框。"""
    def _make_list(obj, default_values=None):
        if obj is None:
            obj = default_values
        elif not isinstance(obj, (list, tuple)):
            obj = [obj]
        return obj

    labels = _make_list(labels)
    colors = _make_list(colors, ['b', 'g', 'r', 'm', 'c'])
    for i, bbox in enumerate(bboxes):
        color = colors[i % len(colors)]
        rect = d2l.bbox_to_rect(bbox.detach().numpy(), color)
        axes.add_patch(rect)
        if labels and len(labels) > i:
            text_color = 'k' if color == 'w' else 'w'
            axes.text(rect.xy[0], rect.xy[1], labels[i], va='center',
                      ha='center', fontsize=9, color=text_color,
                      bbox=dict(facecolor=color, lw=0))
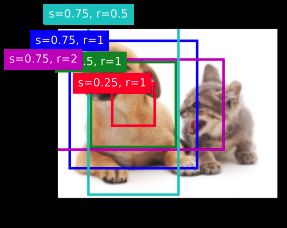
正如我们刚才看到的,变量 boxes 中 x x x 轴和 y y y 轴的坐标值已分别除以图像的宽度和高度。绘制锚框时,我们需要恢复它们原始的坐标值。因此,我们在下面定义了变量 bbox_scale 。现在,我们可以绘制出图像中所有以(250、250)为中心的锚框了。如下所示,尺度为 0.75 且宽高比为 1 的蓝色锚框很好地围绕着图像中的狗。
d2l.set_figsize()
bbox_scale = torch.tensor((w, h, w, h))
fig = d2l.plt.imshow(img)
show_bboxes(fig.axes, boxes[250, 250, :, :] * bbox_scale, [
    's=0.75, r=1', 's=0.5, r=1', 's=0.25, r=1', 's=0.75, r=2', 's=0.75, r=0.5'
])
三、多尺度目标检测
3.1 多尺度目标检测综述
参考:
- https://www.zhihu.com/question/309488424
- https://zhuanlan.zhihu.com/p/54163567
- https://arxiv.org/abs/1809.02165
多尺度目标检测方法可以大致分为三类:
- 将多层特征进行组合后进行预测PVANET(NIPSW16)
- 分别在不同的层进行预测RFBnet(CVPR18)
- 组合以上两种方法FPN(CVPR17)
Faster R-CNN对应图b,SSD对应图c,FPN对应图d
这里我们采用SSD的方法进行讨论,首先我们针对一张任意的feature map进行分析。假设我们以输入像素为中心生成多个锚框,561*728的图像每个像素5个大小不同的锚框,最终会生成超过200万个锚框
%matplotlib inline
import torch
from d2l import torch as d2l

img = d2l.plt.imread("./data/Coco/catdog.jpg")
h,w = img.shape[:2]
h,w
(561, 728)
3.2 多尺度特征检测锚框生成示例
在特征图(fmap)上生成锚框(anchors),由于锚框中的(x,y)轴坐标值(anchors)已经被除以特征图(fmap)的高度和宽度,所以这些值都是介于[0,1]之间的,表示了特征图中锚框的相对位置。
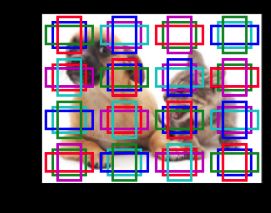
由于锚框(anchors)的中心分布于特征图(fmap)上的所有单位,因此这些中心必须根据其相对空间位置在任何输入图像上均匀分布。更具体地说,给定特征图的宽度和高度 fmap_w 和 fmap_h ,以下函数将 均匀地 对任何输入图像中 fmap_h 行和 fmap_w 列中的像素进行采样。
以这些均匀采样的像素为中心,将会生成大小为 s(假设列表 s 的长度为 1)且宽高比( ratios )不同的锚框。
def display_anchors(fmap_w, fmap_h, s):
    d2l.set_figsize()
    # 前两个维度上的值(batch_size,channels)不影响输出
    fmap = torch.zeros((1, 10, fmap_h, fmap_w))
    anchors = d2l.multibox_prior(fmap, sizes=s, ratios=[1, 2, 0.5])
    bbox_scale = torch.tensor((w, h, w, h))
    d2l.show_bboxes(d2l.plt.imshow(img).axes, anchors[0] * bbox_scale)
# 设置锚框的尺寸尺度为0.15,特征图的高度和宽度设置为4
display_anchors(fmap_w=4, fmap_h=4, s=[0.15])
然后,我们[将特征图的高度和宽度减小一半,然后使用较大的锚框来检测较大的目标]。
当尺度设置为 0.4 时,一些锚框将彼此重叠。
display_anchors(fmap_w=2, fmap_h=2, s=[0.4])
最后,我们进一步[将特征图的高度和宽度减小一半,然后将锚框的尺度增加到0.8]。
此时,锚框的中心即是图像的中心。
display_anchors(fmap_w=1, fmap_h=1, s=[0.8])
四、参考整理
最后整理一下Cite,感谢沐神和各位Blog大佬们!!!
- 沐神视频: https://space.bilibili.com/1567748478/channel/detail?cid=175509&ctype=0
- 沐神的书籍(多版本、免费的哦):https://zh-v2.d2l.ai/
- 目标检测任务概述:https://zhuanlan.zhihu.com/p/34142321
- 目标检测框基础知识:https://zhuanlan.zhihu.com/p/63024247
- 多尺度目标检测
- https://www.zhihu.com/question/309488424
- https://zhuanlan.zhihu.com/p/54163567
- https://arxiv.org/abs/1809.02165

