Python机器学习案例-使用集成学习进行客户流失预测
目录
-
- 1. 概述
-
- 1.1 背景
- 1.2 数据说明
- 1.3 目的
- 2. 正文
-
- 2.1 加载数据
- 2.2 数据清洗
- 2.3 特征工程
- 2.4 建模
-
- 2.4.1 逻辑斯蒂回归
- 2.4.2 SVC
- 2.4.3 随机森林
- 2.4.4 XGBoost
- 2.4.5 VotingClassifier
- 2.4.6 算法对比
- 3. 结论
1. 概述
1.1 背景
什么是客户流失?
客户流失是指客户或订户停止与公司或服务开展业务。
电信行业的客户可以从各种服务提供商中进行选择,并积极地从一个服务提供商切换到另一个服务提供商。在这个竞争激烈的市场上,电信业务的年流失率为15-25%。
个性化的客户保留是困难的,因为大多数公司都有大量的客户,不能为每个客户投入太多时间。成本太高,超过了额外收入。然而,如果一家公司能够预测哪些客户可能提前离开,那么它可以将客户保留工作的重点放在这些“高风险”客户身上。最终目标是扩大其覆盖范围并获得更多的客户忠诚度。在这个市场上取得成功的核心在于客户本身。
客户流失是一个关键指标,因为留住现有客户的成本要比获得新客户的成本低得多。
为了减少客户流失,电信公司需要预测哪些客户面临高流失风险。
为了发现潜在客户流失的早期迹象,首先必须对客户及其在多个渠道之间的互动进行全面的了解,其中包括商店/分支机构访问、产品购买历史、客户服务电话、基于Web的交易和社交媒体互动等。
因此,通过解决客户流失问题,这些企业不仅可以保持其市场地位,还可以发展壮大。他们网络中的客户越多,发起成本越低,利润越大。因此,公司成功的关键重点是减少客户流失和实施有效的保留战略。
1.2 数据说明
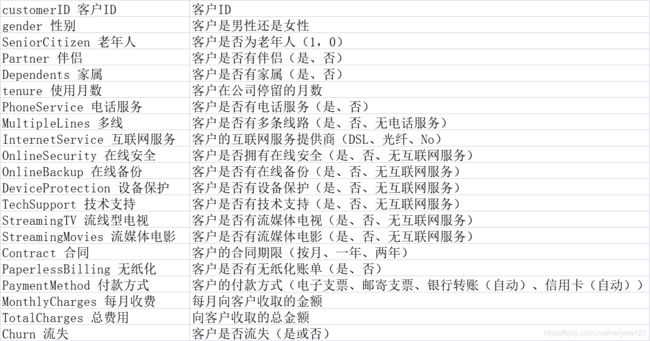
数据来源kaggle公开数据集(链接点击),共21个特征,7043行数据。
不便注册下载的朋友可点击网盘下载
链接:https://pan.baidu.com/s/1rzt0WPYVaPZkWxKqyhM2oQ
提取码:vc9r
1.3 目的
本文没有进行大量的EDA探索性分析,主要侧重于算法的使用与调参,最后利用集成学习预测客户流失。
2. 正文
2.1 加载数据
导入使用的库
import pandas as pd
import numpy as np
import matplotlib.pyplot as plt
import seaborn as sns
plt.rcParams['font.sans-serif'] = ['SimHei']  # 用来正常显示中文标签
plt.rcParams['axes.unicode_minus'] = False  # 用来正常显示负号
import warnings
warnings.filterwarnings('ignore')

from scipy import stats
from sklearn.preprocessing import StandardScaler
from imblearn.over_sampling import SMOTE
from sklearn.model_selection import train_test_split, cross_val_score, GridSearchCV, KFold
from sklearn.feature_selection import RFE
from sklearn.linear_model import LogisticRegression
from sklearn.svm import SVC
from sklearn.ensemble import RandomForestClassifier, VotingClassifier, ExtraTreesClassifier
import xgboost as xgb
from sklearn import metrics
import prettytable
- 有关客户的人口统计信息:性别、年龄以及他们是否有伴侣和家属
- 每个客户注册的服务信息:电话、多线、互联网、在线安全、在线备份、设备保护、技术支持以及流媒体电视和电影
- 客户账户信息:他们成为客户的时间、合同、付款方式、无纸账单、月费和总费用
加载数据集并查看数据大致情况
data = pd.read_csv('WA_Fn-UseC_-Telco-Customer-Churn.csv')
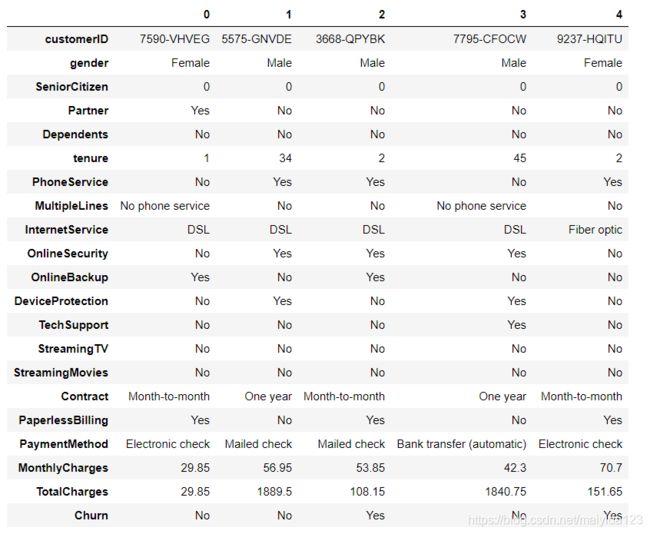
data.head().T
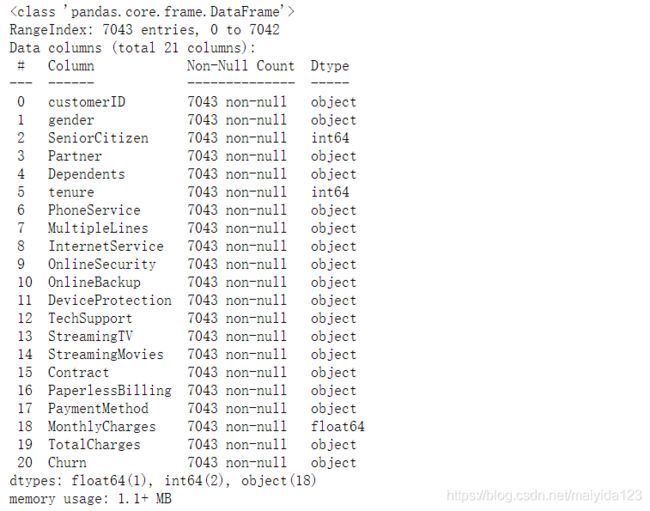
data.info()
- 没有缺失值,TotalCharges为字符串,后续需要转换为数值型格式
2.2 数据清洗
删除客户ID,因为它没有包含有效信息,对建模没有帮助。
data.drop("customerID", axis=1, inplace=True)
将TotalCharges转换为数值型格式
# 转换成连续型变量
data['TotalCharges'] = pd.to_numeric(data.TotalCharges, errors='coerce')
# 查看是否存在缺失值
data['TotalCharges'].isnull().sum()
- 结果为11
查看缺失值分布
# 查看缺失值分布
data.loc[data['TotalCharges'].isnull()].T
- 可以看到其在网停留月数为0
查看在网月数为0的数量
data.query("tenure == 0").shape[0]
- 结果为11,可见在网月数为0的客户与总消费缺失的客户重合
由于缺失数据数量11条不多,这里直接删除数据
data = data.query("tenure != 0")
# 重置索引
data = data.reset_index().drop('index',axis=1)
2.3 特征工程
查看各类别特征频数
# 查看各类别特征频数
for i in data.select_dtypes(include="object").columns:
    print(data[i].value_counts())
    print('-'*50)
- 可以看到各类别特征的频数,没有极端数量的类别存在,所以不对其进行处理。
将流失率转化为01分布
data.Churn = data.Churn.map({'No':0,'Yes':1})
查看数值型特征的频数分布
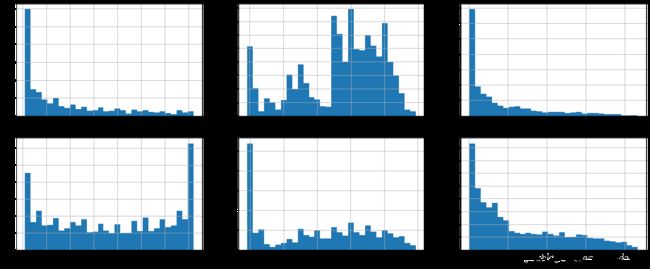
fig, ax= plt.subplots(nrows=2, ncols=3, figsize = (20,8))
for i, feature in enumerate(['tenure','MonthlyCharges','TotalCharges']):
    data.loc[data.Churn == 1, feature].hist(ax=ax[0][i], bins=30)
    data.loc[data.Churn == 0, feature].hist(ax=ax[1][i], bins=30, )
    ax[0][i].set_xlabel(feature+' Churn=0')
    ax[1][i].set_xlabel(feature+' Churn=1')
- tenure、MonthlyCharges、TotalCharges在流失与否的分布有差异
- 将tenure、MonthlyCharges分箱处理
- 将TotalCharges进行box-cox转换为近似正态分布
稍后再进行处理,先创造新特征
因为 客户总消费 = 在网月数 * 平均月消费,数据集中的MonthlyCharges我理解为最近一次套餐月费,通过tenure * MonthlyCharges - TotalCharges的结果正负,我们可以推断出客户的月费套餐是否有变更以及变高、变低,从而创建出新的特征。
data['TotalCharges_diff'] = data.tenure * data.MonthlyCharges - data.TotalCharges

def func(x):
    if x > 0:
        res = 2  # 2表示月费增加
    elif x == 0:
        res = 1  # 1表示月费持平
    else:
        res = 0  # 0表示月费减少
    return res
data['TotalCharges_diff1'] = data['TotalCharges_diff'].apply(lambda x:func(x))
data.drop('TotalCharges_diff', axis=1, inplace=True)
创建新特征之后,再进行之前的数值型特征转换
data['tenure'] = pd.qcut(data['tenure'], q=5, labels=['tenure_'+str(i) for i in range(1,6)])
data['MonthlyCharges'] = pd.qcut(data['MonthlyCharges'], q=5, labels=['MonthlyCharges_'+str(i) for i in range(1,6)])
data['TotalCharges'], _ = stats.boxcox(data['TotalCharges'])
接着,划分自变量与因变量
X = data[data.columns.drop('Churn')]
y = data.Churn
哑变量处理
# 生成哑变量
X = pd.get_dummies(X)
数据标准化
# 标准化
scaler = StandardScaler()
scale_data = scaler.fit_transform(X)
X = pd.DataFrame(scale_data, columns = X.columns)
查看因变量样本是否均衡
y.value_counts()
- 样本不均衡,流失的数量相对少很多,一般我们可以采样或者在算法中加权,本次的数据集较小,为避免发生过拟合,进行过采样处理。
model_smote = SMOTE(random_state=10)  # 建立SMOTE模型对象
X_smote, y_smote = model_smote.fit_resample(X, y)
查看采样之后的因变量
y_smote.value_counts()
- 因变量样本已平衡
查看训练集的特征数量,特征的数量将影响到模型运行的速度,通常我们可以进行降维或者特征选择来减少特征数量。
X_smote.shape[1]
- 结果为54
常见的降维方法PCA,由于其无法解释特征,所以这里使用特征选择,选择最重要的30个特征进行后续建模。
etc = ExtraTreesClassifier(random_state=9)  # ExtraTree,用于EFE的模型对象
selector = RFE(etc, 30)
selected_data = selector.fit_transform(X_smote, y_smote)  # 训练并转换数据
X_smote = pd.DataFrame(selected_data, columns = X_smote.columns[selector.get_support()])
2.4 建模
划分训练集、测试集
X_train, X_test, y_train, y_test = train_test_split(X_smote, y_smote, stratify=y_smote, random_state=11)
定义模型训练、调参使用的函数
# 交叉验证输出f1得分
def score_cv(model, X, y):
    kfold = KFold(n_splits=5, random_state=42, shuffle=True)
    f1= cross_val_score(model, X, y, scoring='f1', cv=kfold).mean()
    return f1

# 网格搜索
def gridsearch_cv(model, test_param, cv=5):
    gsearch = GridSearchCV(estimator=model, param_grid=test_param, scoring='f1', n_jobs=-1, cv=cv)
    gsearch.fit(X_train, y_train)
    print('Best Params: ', gsearch.best_params_)
    print('Best Score: ', gsearch.best_score_)
    return gsearch.best_params_

# 输出预测结果及混淆矩阵等相关指标
def model_pred(model):
    model.fit(X_train, y_train)
    pred = model.predict(X_test)
    print('test f1-score: ', metrics.f1_score(y_test, pred))
    print('-'*50)
    print('classification_report \n',metrics.classification_report(y_test, pred))
    print('-'*50)
    tn, fp, fn, tp = metrics.confusion_matrix(y_test, pred).ravel()  # 获得混淆矩阵
    confusion_matrix_table = prettytable.PrettyTable(['','actual-1','actual-0'])  # 创建表格实例
    confusion_matrix_table.add_row(['prediction-1',tp,fp])  # 增加第一行数据
    confusion_matrix_table.add_row(['prediction-0',fn,tn])  # 增加第二行数据
    print('confusion matrix \n',confusion_matrix_table)
2.4.1 逻辑斯蒂回归
使用默认参数训练
lr = LogisticRegression(random_state=10)
lr_f1 = score_cv(lr, X_train, y_train)
lr_f1
- 得分:0.7858476629776509
查看其在测试集上的表现
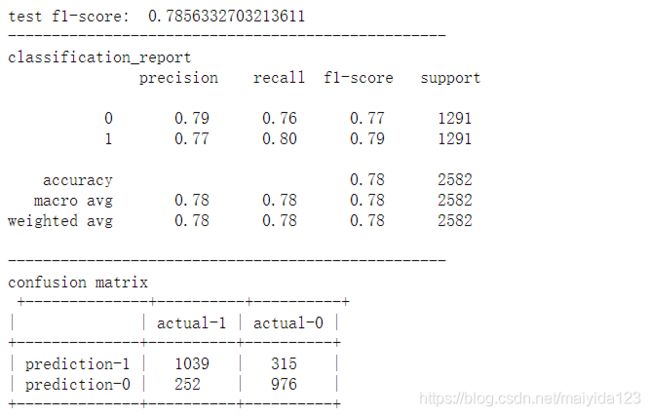
model_pred(lr)
- 验证集f1得分与测试集接近
- 模型成功预测出1039位流失客户,但也将315位未流失的客户错误归类为流失客户,同时遗漏了252位实际流失客户。
结果一般,调参试试
lr_params = {
    'C': [0.001, 0.01, 0.1, 1, 10, 100, 1000],
    'max_iter': [10, 100, 500],
    'penalty': ['l1','l2'],
    }
lr_best_params = gridsearch_cv(lr, lr_params)
有提高,缩小范围再次调参
%%time
lr_params1 = {'C': [0.001, 0.01, 0.05, 0.1],
              'max_iter': [10, 30, 60, 100],
              'penalty': ['l2'],
             }

lr_best_params = gridsearch_cv(lr, lr_params1)
- 得分没有变化,预计f1得分提升不会很多,这里就不再缩小范围了
查看调参后的测试集效果
lr_best = LogisticRegression(**lr_best_params, random_state=10)
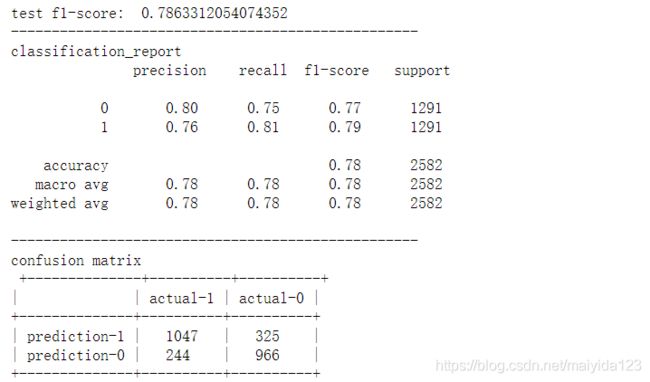
model_pred(lr_best)
- 调参之后训练集与测试集上的表现有提升,但是提升幅度不大
2.4.2 SVC
svc = SVC(random_state=12, probability=True)  # probability默认为False,为True时会输出概率,但是速度会变慢
svc_f1 = score_cv(svc, X_train, y_train)
svc_f1
- 结果:0.8316116213986324,比逻辑回归好不少,SVM果然优秀。
查看其测试集效果
model_pred(svc)
SVM的调参开销较大,所以先从核函数的选择开始
import time

for kernel in ["linear","poly","rbf","sigmoid"]:
    time_start = time.time()
    model = SVC(kernel = kernel,
              gamma="auto",
             )
    f1 = score_cv(model, X_train, y_train)
    time_end = time.time()
    print("{} test f1-score: {:.6f}, cost time: {:.6f}s ".format(kernel, f1, time_end-time_start))
- 高斯核的f1交叉验证得分较高,所以选择高斯核进行接下来的调参
%%time
svc_params = {
    "kernel":['rbf'],
    "C":[0.1, 1, 10, 50],
    "gamma": [1, 0.1, 0.01]
}
svc_best_params = gridsearch_cv(svc, svc_params)
%%time
svc_params2 = {
    "kernel":['rbf'],
    "C":[1, 5, 10, 25, 50],
    "gamma": [0.5, 0.1, 0.05]
}
svc_best_params = gridsearch_cv(svc, svc_params2)
%%time
svc_params2 = {
    "kernel":['rbf'],
    "C":[1, 3, 5, 7, 10],
    "gamma": [0.5, 0.1, 0.05]
}
svc_best_params = gridsearch_cv(svc, svc_params2)
- 最佳参数没有发生变化,停止调参
通过网格调参可见SVC f1得分有了一定的提高,查看其测试集的效果如何
svc_best = SVC(**svc_best_params, probability=True, random_state=10)
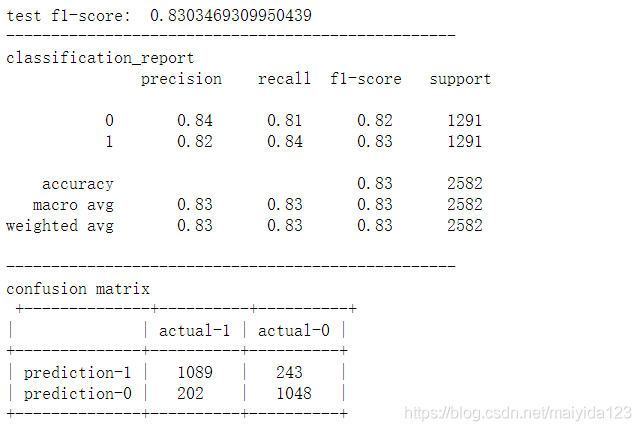
model_pred(svc_best)
- f1得分相较为调参时提高了0.04
2.4.3 随机森林
rfc = RandomForestClassifier(random_state=11)
rfc_f1 = score_cv(rfc, X_train, y_train)
rfc_f1
- 结果:0.8448649653070515,比起逻辑斯蒂回归与支持向量机有不少的提高
查看其测试集上的效果
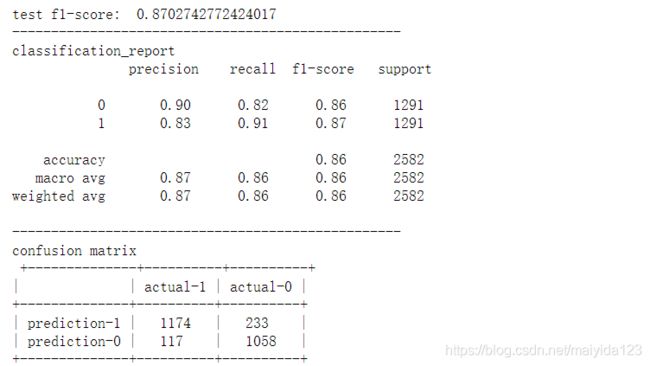
model_pred(rfc)
# 查看特征重要性
rfc.fit(X_train, y_train)
feature_importance= (pd.DataFrame({'feature': X_train.columns,
                                   'feature_importance': rfc.feature_importances_})
                       .sort_values('feature_importance', ascending=False)
                       .round(4))

# 绘制barh图查看特征重要性排序
plt.figure(figsize=(12, 10))
sns.barplot(x='feature_importance', y='feature', data=feature_importance)
plt.show()
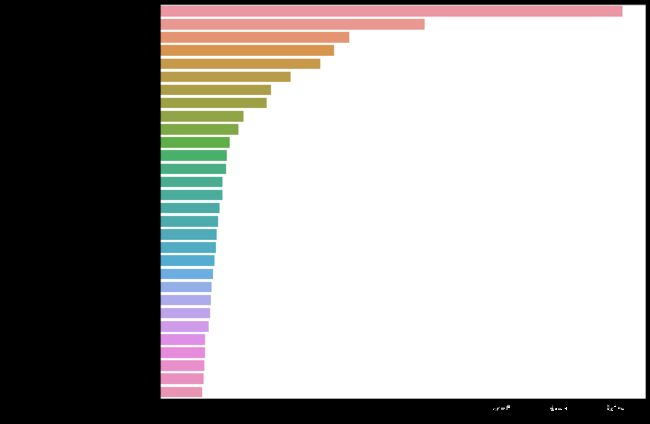
- 从上图可以看到对于模型重要性排名,总消费对于是否流失最为关键,emmmmm…正确的废话
调参
先调整n_estimators
%%time
score_list = []
n_estimators_range = range(10,501,20)
for i in n_estimators_range:
    rfc_model = RandomForestClassifier(n_estimators=i,
#                                  min_samples_split=20,
#                                  min_samples_leaf=20,
#                                  max_depth=8,
#                                  max_features='sqrt',
                                 random_state=10
                                )
    score = score_cv(rfc_model, X_train, y_train)
    score_list.append(score)
score_df = pd.DataFrame(score_list, index = n_estimators_range)
best_score = score_df.max()[0]
best_n_estimators = score_df.idxmax()[0]
print("best n_estimators is {}, best f1-score is {}".format(best_n_estimators, best_score))
plt.figure(figsize=[20,5])
plt.plot(n_estimators_range, score_list)
plt.show()
- 可见n_estimators在200以上时,模型表现已趋于稳定了
缩小范围
%%time
score_list1 = []
n_estimators_range1 = range(330, 370, 2)
for i in n_estimators_range1:
    rfc_model = RandomForestClassifier(n_estimators=i,
                                 random_state=10
                                )
    score = score_cv(rfc_model, X_train, y_train)
    score_list1.append(score)
score_df1 = pd.DataFrame(score_list1, index = n_estimators_range1)
best_score1 = score_df1.max()[0]
best_n_estimators1 = score_df1.idxmax()[0]
print("best n_estimators is {}, best f1-score is {}".format(best_n_estimators1, best_score1))
plt.figure(figsize=[20,5])
plt.plot(n_estimators_range1, score_list1)
plt.show()
- 可见n_estimators=352时,f1得分最高
调整max_depth
%%time
rfc_params = {
    'n_estimators':[352],
    'max_depth':np.arange(2, 30, 1)
}

rfc_best_params = gridsearch_cv(rfc, rfc_params)
- 有提升
调整max_features
%%time
rfc_params1 = {
    'n_estimators':[352],
    'max_depth':[14],
    'max_features':np.arange(2, 30, 1)
}

rfc_best_params = gridsearch_cv(rfc, rfc_params1)
- 有轻微提升
调整min_samples_leaf
%%time

rfc_params2 = {
    'n_estimators':[352],
    'max_depth':[14],
    'max_features':[3],
    'min_samples_leaf':np.arange(1, 11, 1)
}

rfc_best_params = gridsearch_cv(rfc, rfc_params2)
- 没有提升,这里就不再尝试了
查看调参之后的测试集效果
rfc_best = RandomForestClassifier(**rfc_best_params)
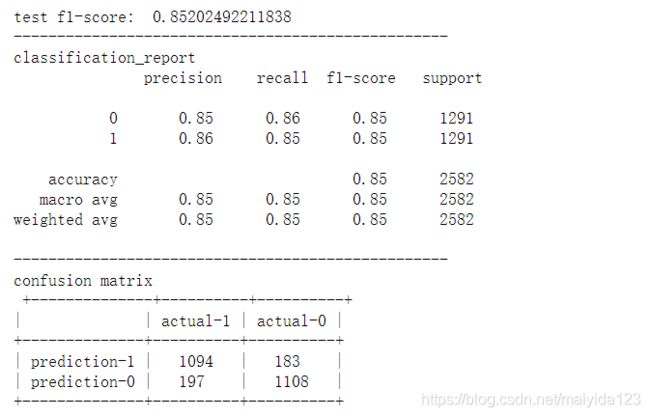
model_pred(rfc_best)
- 训练集与测试集在调参之后均有0.01左右的提升
2.4.4 XGBoost
来康康竞赛大杀器XGBoost的表现如何
xgbc = xgb.XGBClassifier(random_state=10)
xgbc_f1 = score_cv(xgbc, X_train, y_train)
xgbc_f1
- 结果:0.8479896095615043
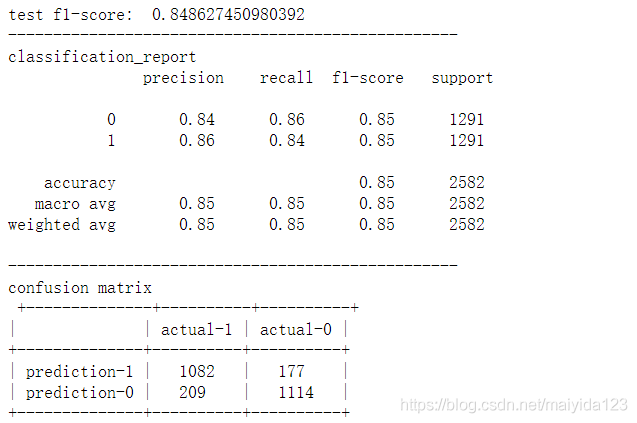
model_pred(xgbc)
- 训练集与测试集的得分为四个模型中最高的
调参
使用模型自带的cv进行调参n_estimators
def model_cv(model, X, y, cv_folds=5, early_stopping_rounds=50, seed=0):
    xgb_param = model.get_xgb_params()
    xgtrain = xgb.DMatrix(X, label=y)
    cvresult = xgb.cv(xgb_param, xgtrain, num_boost_round=model.get_params()['n_estimators'], nfold=cv_folds,
                    metrics='auc', seed=seed, callbacks=[
            xgb.callback.print_evaluation(show_stdv=False),
            xgb.callback.early_stop(early_stopping_rounds)
       ])
    num_round_best = cvresult.shape[0] - 1
    print('Best round num: ', num_round_best)
    return num_round_best
# 设置初始参数
xgbc_params = {
    'n_estimators':5000,
    'seed':0,
    'max_depth':3,
    'min_child_weight':7,
    'gamma':0,
    'subsample':0.8,
    'colsample_bytree':0.8,
    'scale_pos_weight':1,
    'reg_alpha':1,
    'reg_lambda': 1e-5,
    'learning_rate': 0.1,
    'objective':'binary:logistic',
}

xgbc_model = xgb.XGBClassifier(**xgbc_params)
num_round = model_cv(xgbc_model, X_train, y_train)
- 由于自带的交叉验证没有f1得分,需要自定义,所以使用auc得分来选择最佳树的数量
调参max_depth 和 min_child_weight
%%time
xgbc_param1 = {
    'n_estimators':[181],
    'max_depth': range(3, 10, 2),
    'min_child_weight': range(1, 10, 2)
}
xgbc_best_params = gridsearch_cv(xgbc, xgbc_param1)
- 有较大的提升
缩小范围
%%time
xgbc_param2 = {
    'n_estimators':[181],
    'max_depth': range(2, 5, 1),
    'min_child_weight': range(4, 7, 1)
}
xgbc_best_params = gridsearch_cv(xgbc, xgbc_param2)
- 有小幅提升
接下来调整 gamma
%%time
xgbc_param3 = {
    'n_estimators':[181],
    'max_depth': [2],
    'min_child_weight': [5],
    'gamma':[0, 0.1, 1, 10]
}
xgbc_best_params = gridsearch_cv(xgbc, xgbc_param3)
结果:
- 没有变化
subsample与colsample_bytree
xgbc_param4 = {
    'n_estimators':[181],
    'max_depth': [2],
    'min_child_weight': [5],
    'subsample': np.linspace(0.6, 1, 9),
    'colsample_bytree': np.linspace(0.6, 1, 9)
}
xgbc_best_params = gridsearch_cv(xgbc, xgbc_param4)
结果:
![]()
- 有一点点提升
reg_alpha与reg_lambda
%%time
xgbc_param5 = {
    'n_estimators':[181],
    'max_depth': [2],
    'min_child_weight': [5],
    'subsample': [1],
    'colsample_bytree': [0.85],
    'reg_alpha': [1e-5, 1e-2, 0.1, 1, 100, 1000],
    'reg_lambda': [1e-5, 1e-2, 0.1, 1, 100, 1000]
}
xgbc_best_params = gridsearch_cv(xgbc, xgbc_param5)
- 没有变化
最后调整学习率
%%time
xgbc_param6 = {
    'n_estimators':[181],
    'max_depth': [2],
    'min_child_weight': [5],
    'subsample': [1],
    'colsample_bytree': [0.85],
    'learning_rate':np.linspace(0.01, 0.4, 40)
}
xgbc_best_params = gridsearch_cv(xgbc, xgbc_param6)
- 也没有变化,调参完毕
查看测试集效果
xgbc_best = xgb.XGBClassifier(**xgbc_best_params, random_state=10)
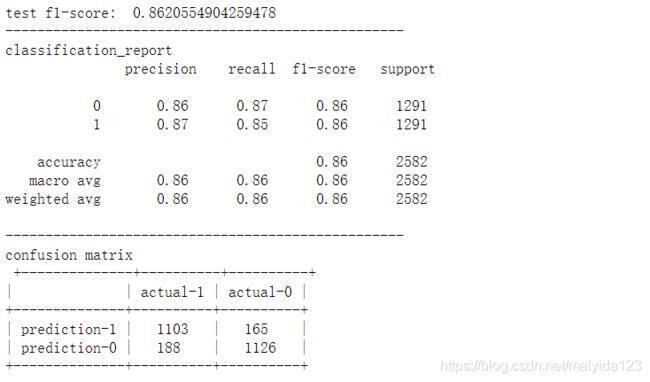
model_pred(xgbc_best)
- 调参前后得分有一定的提升
2.4.5 VotingClassifier
常见的投票方式分为两种:
- Hard Voting :根据少数服从多数来定最终结果;
- Soft Voting :将所有模型预测样本为某一类别的概率的平均值作为标准,概率最高的对应的类型为最终的预测结果
一般情况下soft voting的效果要好于hard voting,我们可以进行验证。
考虑到逻辑回归的得分不高,所以不加入投票。
未调参hard voting
%%time
estimators = [('rfc', rfc), ('xgbc', xgbc),('svc', svc)]  # 建立组合评估器列表
voting_hard = VotingClassifier(estimators=estimators,
                          voting='hard',
                          n_jobs=-1)  # 建立组合评估模型
voting_hard_f1 = score_cv(voting_hard, X_train, y_train)
voting_hard_f1
- 结果:0.8535435082835885
测试集效果
model_pred(voting_hard)
- 不截图占地方了,就放个f1得分:0.8530659467797919
未调参soft voting
voting_soft = VotingClassifier(estimators=estimators,
                          voting='soft',
                          n_jobs=-1)  # 建立组合评估模型
voting_soft_f1 = score_cv(voting_soft, X_train, y_train)
voting_soft_f1
- 结果:0.8573929728116363
测试集效果
model_pred(voting_soft)
- f1得分:0.8575815738963533
接下来来看调参之后的表现
hard voting
estimators1 = [('rfc_best', rfc_best), ('xgbc_best', xgbc_best),('svc_best', svc_best)]  # 建立组合评估器列表
voting_hard1 = VotingClassifier(estimators=estimators1,
                          voting='hard',
                          n_jobs=-1)  # 建立组合评估模型
voting_hard1_f1 = score_cv(voting_hard1, X_train, y_train)
voting_hard1_f1
- 结果:0.8575966523259982
测试集效果
model_pred(voting_hard1)
- 结果:0.8649468892261002
soft voting
voting_soft1 = VotingClassifier(estimators=estimators1,
                          voting='soft',
                          n_jobs=-1)  # 建立组合评估模型
voting_soft1_f1 = score_cv(voting_soft1, X_train, y_train)
voting_soft1_f1
- 结果:0.8676556751155337
测试集效果
model_pred(voting_soft1)
2.4.6 算法对比
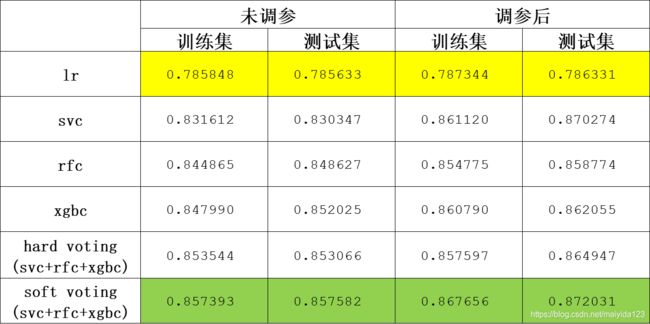
观察图中结果:
- 逻辑斯蒂回归的结果最差,所以一般是用来作参考
- svc调参后有较大的提升,而随机森林与XGBoost的默认参数效果较好,但调参提升效果有限,其原因在于调整的参数较多,网格搜索消耗太大,而单个参数调整容易得到局部最优解
- soft voting的效果最好,在默认参数训练数据集也能得到较为不错的结果。
- 调参效果提升并不太大,一方面参数还有待优化,另一方面也说明,传统的机器学习算法调参的重要性可能也没有想象的那么重要,调参其实也只能在一定的程度上提升效果,俗话说‘garbage in, garbage out’,数据质量与手撕特征才是建模时候的重点。
3. 结论
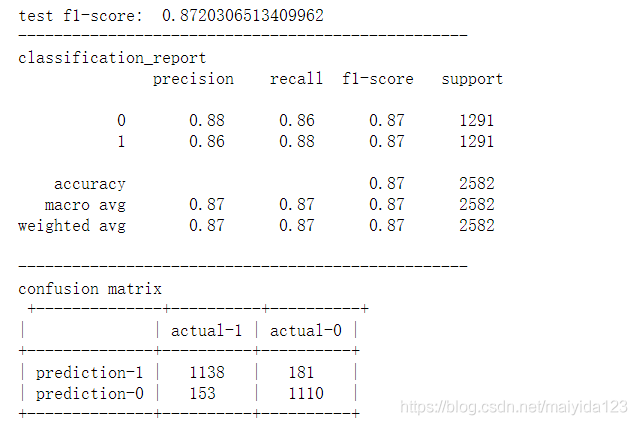
通过Soft Voting Classifier正确预测流失客户1138人,错误的将流失客户预测为非流失客户153人,错误的将非流失客户预测为流失客户181人,正确预测非流失客户1110。准确率0.8706,精确率0.8628,召回率0.8815,f1得分0.8720。
