逻辑回归 logistic regression 解决分类问题
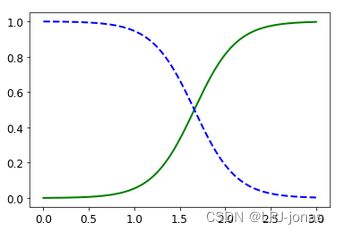
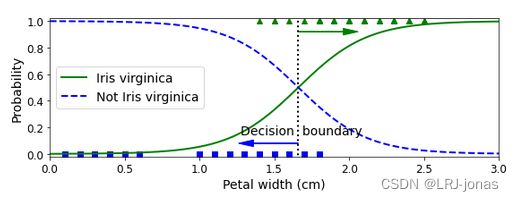
示例,鸢尾花数据集,使用逻辑回归模型根据其中一个或两个特征进行分类。
加载数据集:
from sklearn import datasets
iris = datasets.load_iris()
list(iris.keys
我们这里先使用花瓣宽度(petal_width)进行分类,看看是否可行:
X = iris["data"][:, 3:] # petal width
y = (iris["target"] == 2).astype(np.int) # 1 if Iris virginica, else 0
sklearn库可以调用逻辑回归的方法:
from sklearn.linear_model import LogisticRegression
log_reg = LogisticRegression(solver="lbfgs", random_state=42)
log_reg.fit(X, y)
X_new = np.linspace(0, 3, 1000).reshape(-1, 1)
y_proba = log_reg.predict_proba(X_new)plt.plot(X_new, y_proba[:, 1], "g-", linewidth=2, label="Iris virginica")
plt.plot(X_new, y_proba[:, 0], "b--", linewidth=2, label="Not Iris virginica")
为了更方便理解,绘制更复杂的图表如下:
再使用两个特征进行分类,并且临界的probability修改为0.5以为外的其他数字试试:
from sklearn.linear_model import LogisticRegression
X = iris["data"][:, (2, 3)] # petal length, petal width
y = (iris["target"] == 2).astype(np.int)log_reg = LogisticRegression(solver="lbfgs", C=10**10, random_state=42)
log_reg.fit(X, y)x0, x1 = np.meshgrid( #meshgrid函数,绘制坐标网格
np.linspace(2.9, 7, 500).reshape(-1, 1),
np.linspace(0.8, 2.7, 200).reshape(-1, 1),
)
X_new = np.c_[x0.ravel(), x1.ravel()]y_proba = log_reg.predict_proba(X_new)
plt.figure(figsize=(10, 4))
plt.plot(X[y==0, 0], X[y==0, 1], "bs")
plt.plot(X[y==1, 0], X[y==1, 1], "g^")zz = y_proba[:, 1].reshape(x0.shape)
contour = plt.contour(x0, x1, zz, cmap=plt.cm.brg) #配色方案
left_right = np.array([2.9, 7])
boundary = -(log_reg.coef_[0][0] * left_right + log_reg.intercept_[0]) / log_reg.coef_[0][1]plt.clabel(contour, inline=1, fontsize=12)
plt.plot(left_right, boundary, "k--", linewidth=3)
plt.text(3.5, 1.5, "Not Iris virginica", fontsize=14, color="b", ha="center")
plt.text(6.5, 2.3, "Iris virginica", fontsize=14, color="g", ha="center")
plt.xlabel("Petal length", fontsize=14)
plt.ylabel("Petal width", fontsize=14)
plt.axis([2.9, 7, 0.8, 2.7]) #定义x轴和y轴的范围
save_fig("logistic_regression_contour_plot")
plt.show()
绿色线是将临界概率 修改为0.9的结果,即认为其是virginica的概率超过0.9才算virginica的分界线。


