利用Python统计各乡镇各地类面积
利用Python统计各乡镇各地类面积
导入相关模块
import arcpy
from arcpy import env
import arcpy.sa as sa
import numpy as np
import pandas as pd
from dbfread import DBF
import geopandas as gpd
import matplotlib.pyplot as plt
env.workspace = r"F:\ArcGIS\ArcGIS文件\EX02数据准备"
创建文件地理数据库
# Import system modules
import os
import sys


# Set local variables
out_folder_path = "F:\ArcGIS\ArcGIS文件\EX02数据准备"
out_name = "myfgdb.gdb"
# Execute CreateFileGDB
arcpy.CreateFileGDB_management(out_folder_path, out_name)
print(out_name+'创建成功!')
批量投影
我们进行面积计算都是需要投影坐标系的,这里的地理坐标统一成投影坐标CGCS2000_3_Degree_GK_Zone_35。
# Local variables:
input_features = ["面状要素_土地利用数据_Clip.shp", "面状要素_乡镇行政边界.shp", "点状要素_乡镇驻地.shp"]
out_workspace = "F:\\ArcGIS\\ArcGIS文件\\EX02数据准备\\myfgdb.gdb"


# Process: 批量投影
arcpy.BatchProject_management(input_features, out_workspace, "PROJCS['CGCS2000_3_Degree_GK_Zone_35',GEOGCS['GCS_China_Geodetic_Coordinate_System_2000',DATUM['D_China_2000',SPHEROID['CGCS2000',6378137.0,298.257222101]],PRIMEM['Greenwich',0.0],UNIT['Degree',0.0174532925199433]],PROJECTION['Gauss_Kruger'],PARAMETER['False_Easting',35500000.0],PARAMETER['False_Northing',0.0],PARAMETER['Central_Meridian',105.0],PARAMETER['Scale_Factor',1.0],PARAMETER['Latitude_Of_Origin',0.0],UNIT['Meter',1.0]]", "", "")
## 我也不知道为什么这个投影名称这么长,应该用CGCS2000_3_Degree_GK_Zone_35就行了
空间连接
## 由于我的镇界没有属性信息,所以进行空间连接
target_features = r"F:/ArcGIS/ArcGIS文件/EX02数据准备/myfgdb.gdb/面状要素_乡镇行政边界_shp"
join_features = r"F:/ArcGIS/ArcGIS文件/EX02数据准备/myfgdb.gdb/点状要素_乡镇驻地_shp"
out_feature_class = r"F:/ArcGIS/ArcGIS文件/EX02数据准备/myfgdb.gdb/乡镇边界_空间连接_shp"

arcpy.SpatialJoin_analysis(target_features, join_features, out_feature_class)
标识
# IdentityWells.py
# Description: Simple example showing use of Identity tool

# Import system modules
import arcpy
from arcpy import env

# Set the workspace
env.workspace = "F:/ArcGIS/ArcGIS文件/EX02数据准备/myfgdb.gdb"

# Set local parameters
inFeatures = "面状要素_土地利用数据_Clip_shp"
idFeatures = "乡镇边界_空间连接_shp"
outFeatures = "乡镇_土地_面积"

# Process: Use the Identity function
arcpy.Identity_analysis (inFeatures, idFeatures, outFeatures)
数据透视
data = gpd.read_file(env.workspace,layer='乡镇_土地_面积')
data.head()
## 数据清洗
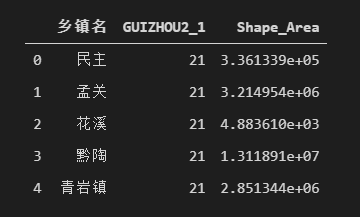
df = data[['乡镇名','GUIZHOU2_1','Shape_Area']]
df.head()
df.shape
## 重命名列
df = df.rename(columns={'乡镇名':'乡镇','GUIZHOU2_1':'地类','Shape_Area':'面积'})
df.head()
## 数据透视
pivot_df = pd.pivot_table(df,index=['乡镇','地类'],values='面积',aggfunc=np.sum)
#显示所有列
pd.set_option('display.max_columns', None)

#显示所有行
pd.set_option('display.max_rows', None)

#设置value的显示长度为100,默认为50
pd.set_option('max_colwidth',100)
pivot_df
## 计算百分比
pivot_df['占比'] = round(pivot_df.面积 / pivot_df.groupby(level=0).面积.transform(sum) * 100,2).astype(str) + '%'
pivot_df
保存数据
df.to_excel('各村土地利用分布表.xlsx')

pivot_df.to_excel('各村土地利用数据透视表.xlsx')
总结
先是利用arcpy进行空间分析,然后利用pandas、geopandas等进行数据透视,注意计算面积一定用的是投影坐标系,因为我数据放在gdb里面,要是shp文件的话,还有进行计算几何。


