matplotlib教程(一)统计图形
matplotlib统计图形汇总
文章目录
- matplotlib统计图形汇总
- 图表组成元素的函数
-
- plot()——展现变量趋势变化
- scatter()——寻找变量之间的关系
- xlim()——设置x轴的数值显示范围
- xlabel()——设置x轴的标签文本
- grid()——绘制刻度线的网格线
- axhline()——绘制平行于x轴的水平参考线
- axvspan()——绘制垂直于x轴的参考区域
- annotate()——添加图形内容细节的指向型注释文本
- text()——添加图形内容细节的无指向型注释文本
- title()——添加图形内容的标题
- legend()——标示不同图形的文本标签图例
- 统计函数绘制简单图形
-
- bar()——用于绘制柱状图
- barh()——用于绘制条形图
- hist()——用于绘制直方图
- pie()——用于绘制饼图
- polar()——用于绘制极线图
- scatter()——用于绘制气泡图
- stem()——用于绘制棉棒图
- boxplot()——用于绘制箱线图
- errorbar()——用于绘制误差棒图
- 绘制统计图形
-
- 柱状图
-
- 条形图
- 堆积图柱状图
- 堆积条形图
- 多数据并列分块图
- 多数据平行条形图
- 装饰柱体
- stackplot()绘制堆积折线图
- broken_barh()绘制间断条形图
- step()绘制阶梯图
- 直方图
-
- 堆积直方图
- 阶梯直方图
- 饼图
-
- 内嵌环形饼图
- boxplot()箱线图
-
- 水平方向的箱线图
- 误差棒图
-
- 带误差棒的柱状图
- 完善统计图形
-
- 函数legend()和函数title()——添加图例和标题
-
- lengend()
- title()
图表组成元素的函数
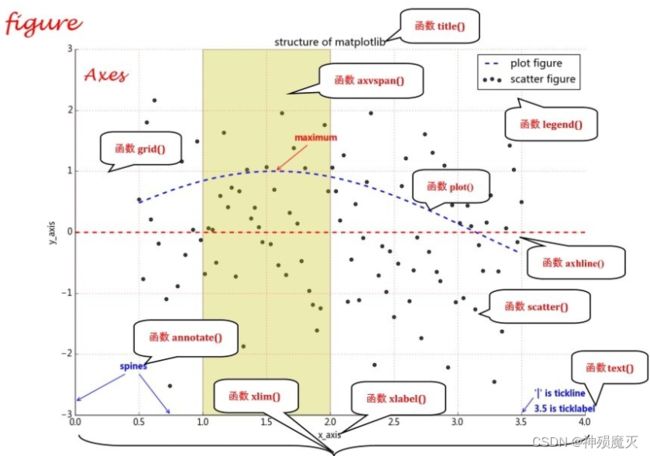
plot()——展现变量趋势变化
plt.plot(x, y, ls="-", lw = 2, label = "plot figure")
- 参数说明
- x:x轴上的数值。
- y:y轴上的数值。
- ls:折线图的线条风格。
- lw:折线图的线条宽度。
- label:标记图形内容的标签文本。
scatter()——寻找变量之间的关系
plt.scatter(x,y,c="b",label="scatterfigure")
- 参数说明
- x:x轴上的数值。
- y:y轴上的数值。
- c:散点图中的标记的颜色。
- label:标记图形内容的标签文本。
xlim()——设置x轴的数值显示范围
plt.xlim(xmin,xmax)
- 参数说明
- xmin:x轴上的最小值。
- xmax:x轴上的最大值。
- 平移到函数ylim()。
xlabel()——设置x轴的标签文本
plt.xlabel(string)
- string:标签文本内容。
- ylabel()
grid()——绘制刻度线的网格线
plt.grid(linestyle=":",color="r")
- linestyle:网格线的线条风格。
- color:网格线的线条颜色。
axhline()——绘制平行于x轴的水平参考线
plt.axhline(y=0.0,c="r",ls="--",lw=2)
- y:水平参考线的出发点。
- c:参考线的线条颜色。
- ls:参考线的线条风格。
- lw:参考线的线条宽度。
- axvline()
axvspan()——绘制垂直于x轴的参考区域
plt.axvspan(xmin=1.0,xmax=2.0,facecolor="y",alpha=0.3)。
- xmin:参考区域的起始位置。-
- xmax:参考区域的终止位置。
- facecolor:参考区域的填充颜色。
- alpha:参考区域的填充颜色的透明度。
- axhspan()
annotate()——添加图形内容细节的指向型注释文本
plt.annotate(string,xy=(np.pi/2,1.0),xytext = ((np.pi/2)+0.15,1.5),weight="bold",color="b",arrowprops=dict(arrowstyle="->",connectionstyle="arc3",color="b"))
- string:图形内容的注释文本。
- xy:被注释图形内容的位置坐标。
- xytext:注释文本的位置坐标。
- weight:注释文本的字体粗细风格。
- color:注释文本的字体颜色。
- arrowprops:指示被注释内容的箭头的属性字典。
text()——添加图形内容细节的无指向型注释文本
plt.text(x,y,string,weight="bold",color="b")
- x:注释文本内容所在位置的横坐标。
- y:注释文本内容所在位置的纵坐标。
- string:注释文本内容。
- weight:注释文本内容的粗细风格。
- color:注释文本内容的字体颜色。
title()——添加图形内容的标题
plt.title(string)
- string:图形内容的标题文本。
legend()——标示不同图形的文本标签图例
plt.legend(loc="lower left")
- loc:图例在图中的地理位置。
统计函数绘制简单图形
bar()——用于绘制柱状图
plt.bar(x,y)
- x:标示在x轴上的定性数据的类别。
- y:每种定性数据的类别的数量。
barh()——用于绘制条形图
plt.barh(x,y)
- x:标示在y轴上的定型数据的类别。
- y:每种定性数据的类别的数量。
hist()——用于绘制直方图
于柱状图不同的地方在于,它更像折线图一样是连续的。
plt.hist(x)
- x:在x轴上绘制箱体的定量数据输入值
pie()——用于绘制饼图
plt.pie(x)
- x:定性数据的不同类别的百分比
polar()——用于绘制极线图
plt.polar(theta,r)
- theta:每个标记所在射线与极径的夹角。
- r:每个标记到原点的距离。
scatter()——用于绘制气泡图
plt.scatter(x,y)
- x:x轴上的数值。
- y:y轴上的数值。
- s:散点标记的大小。
- c:散点标记的颜色。
- cmap:将浮点数映射成颜色的颜色映射表。
stem()——用于绘制棉棒图
- x:指定棉棒的x轴基线上的位置。
- y:绘制棉棒的长度。
- linefmt:棉棒的样式。
- markerfmt:棉棒末端的样式。
- basefmt:指定基线的样式。
boxplot()——用于绘制箱线图
plt.boxplot(x)
- x:绘制箱线图的输入数据
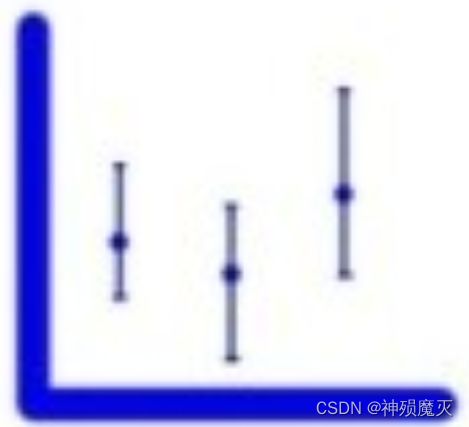
errorbar()——用于绘制误差棒图
plt.errorbar(x,y,yerr=a,xerr=b)
- x:数据点的水平位置。
- y:数据点的垂直位置。
- yerr:y轴方向的数据点的误差计算方法。
- xerr:x轴方向的数据点的误差计算方法。
绘制统计图形
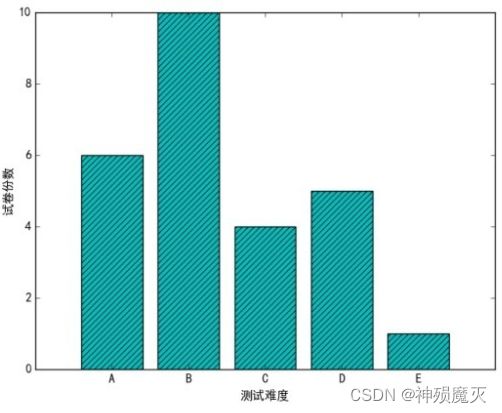
柱状图
定性数据的分布展示
bar(x,y,align="center",color="b",tick_label=["A","B","C","D","E"],alpha=0.6)
- x:柱状图中的柱体标签值。
- y:柱状图中的柱体高度。
- align:柱体对齐方式。
- color:柱体颜色。
- tick_label:刻度标签值。
- alpha:柱体的透明度。
注意:柱状图适合离散数据,当为连续数据时,很容易使数据“无法显示”,因为x轴太多而导致间隔太大,显示不出
解决办法:
方法1:重新设置一个索引,不以datetime作为轴
df.reset_index(inplace=True)
方法2:理论上来说,将datetime重新变成离散的str或object也可行,不过我试了一下
#转换为obj不行
df['dt'] = df['dt'].astype('object')
如果有懂的大佬麻烦解决一下
条形图
barh(x,y,align="center",color="k",tick_label=["A","B","C","D","E"])

堆积图柱状图
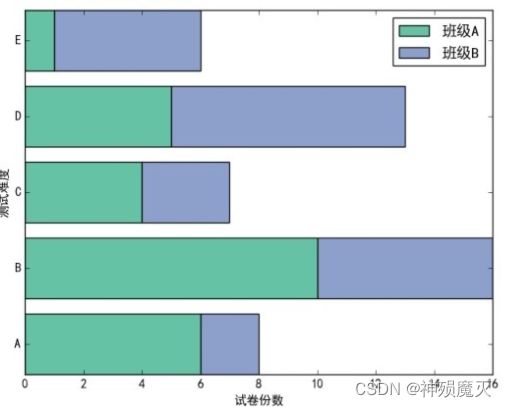
plt.bar(x,y,align="center",color="#66c2a5",tick_label=["A","B","C","D","E"],label="班级A") plt.bar(x,y1,align="center",bottom=y,color="#8da0cb",label="班级B")

堆积条形图
plt.barh(x,y,align="center",color="#66c2a5",tick_label=["A","B","C","D","E"],label="班级A") plt.barh(x,y1,align="center",left=y,color="#8da0cb",label="班级B")
多数据并列分块图
plt.bar(x,y,bar_width,color="c",align="center",label="班级A",alpha=0.5) plt.bar(x+bar_width,y1,bar_width,color="b",align="center",label="班级B",alpha=0.5)

多数据平行条形图
plt.barh(x,y,bar_width,color="c",align="center",label="班级A",alpha=0.5) plt.barh(x+bar_width,y1,bar_width,color="b",align="center",label="班级B", alpha=0.5)

装饰柱体
plt.bar(x,y,align="center",color="c",tick_label=["A","B","C","D","E"],ha tch="///")
stackplot()绘制堆积折线图
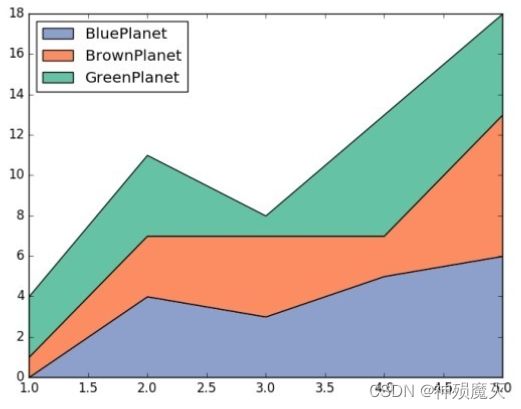
plt.stackplot(x,y,y1,y2,labels=labels,colors=colors)
broken_barh()绘制间断条形图
plt.broken_barh([(30,100),(180,50),(260,70)],(20,8),facecolors="#1f78b4") plt.broken_barh([(60,90),(190,20),(230,30),(280,60)],(10,8),facecolors=("#7fc97f","#beaed4","#fdc086","#ffff99"))
step()绘制阶梯图
plt.step(x,y,color="#8dd3c7", where="pre",lw=2)
直方图
hist(x,bins=bins,color="b",histtype="bar",label="score",rwidth=10)
- x:连续型数据输入值。
- bins:用于确定柱体的个数或是柱体边缘范围。
- color:柱体的颜色。
- histtype:柱体类型。
- label:图例内容。
- rwidth:柱体宽度
堆积直方图
plt.hist(x,bins=bins,color=colors,histtype="bar",rwidth=10,stacked=True,label=labels)
- stacked
阶梯直方图
plt.hist(x,bins=bins,color=colors,histtype="stepfilled",rwidth=10,stacked=True,label=labels)
- histtype: stepfilled
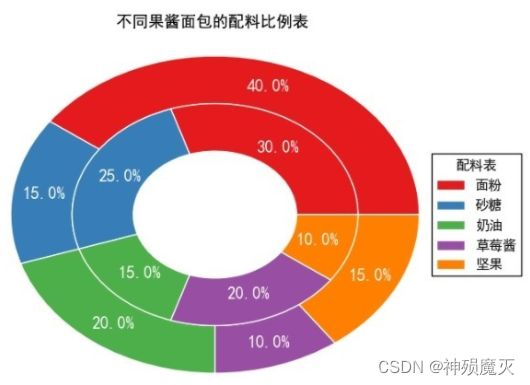
饼图
定性数据的比例展示
pie(students,explode=explode,labels=labels,autopct="%3.1f%%",startangle=45,shadow=True,colors=colors)
- students:饼片代表的百分比。
- explode:饼片边缘偏离半径的百分比。
- labels:标记每份饼片的文本标签内容。
- autopct:饼片文本标签内容对应的数值百分比样式。
- startangle:从x轴作为起始位置,第一个饼片逆时针旋转的角度。
- shadow:是否绘制饼片的阴影。
- colors:饼片的颜色。

内嵌环形饼图
boxplot()箱线图
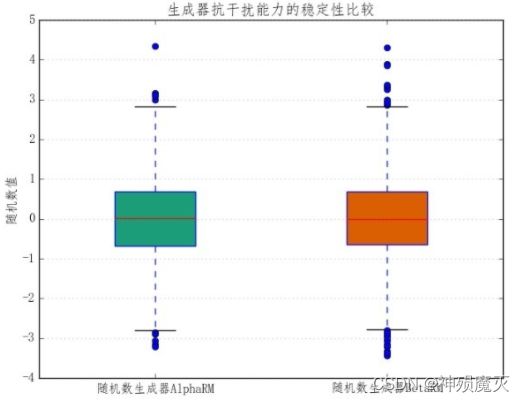
bplot = plt.boxplot(testList,whis=whis,widths=width,sym="o",labels=labels,patch_artist=True)
- testList:绘制箱线图的输入数据。
- whis:四分位间距的倍数,用来确定箱须包含数据的范围的大小。
- widths:设置箱体的宽度。
- sym:离群值的标记样式。
- labels:绘制每一个数据集的刻度标签。
- patch_artist:是否给箱体添加颜色。
水平方向的箱线图
plt.boxplot(x,vert=False)
误差棒图
定量数据的误差范围
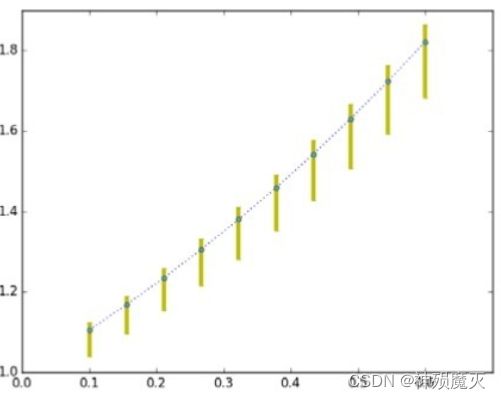
误差棒的计算方法可以有很多种:单一数值、置信区间、标准差和标准误等
plt.errorbar(x,y,yerr=error_limit,fmt=":o",ecolor="y",elinewidth=4,ms=5,mfc="c",mec='r',capthick=1,capsize=2)
- x,y:数据点的位置。
- yerr:单一数值的非对称形式误差范围。
- fmt:数据点的标记样式和数据点标记的连接线样式。
- ecolor:误差棒的线条颜色。
- elinewidth:误差棒的线条粗细。
- ms:数据点的大小。
- mfc:数据点的标记颜色。
- mec:数据点的标记边缘颜色。
- capthick:误差棒边界横杠的厚度。
- capsize:误差棒边界横杠的大小。
带误差棒的柱状图
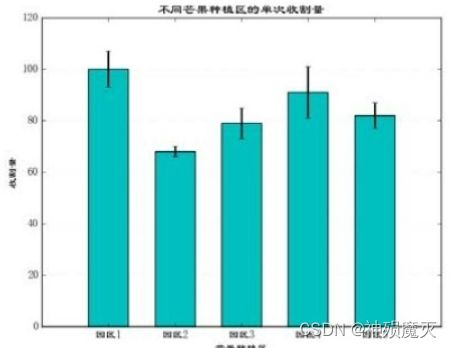
error_attri =dict(elinewidth=2,ecolor="black",capsize=3)
plt.bar(x,y,color="c",width=0.6,align="center",yerr=std_err,error_kw=error_attri,tick_label=["园区1","园区2","园区3","园区4","园区5"])
完善统计图形
函数legend()和函数title()——添加图例和标题
lengend()
plt.legend(loc="upper left",bbox_to_anchor=(0.05,0.95),ncol=3,title="powerfunction",shadow=True,fancybox=True)
- bbox_to_anchor:线框位置参数
- shadow:线框阴影
- fancybox:线框圆角处理参数
title()
plt.title("Left Demo",loc="left",fontdict={"size":"xx-large","color":"r","family":"Times New Roman"})plt.title("right demo",loc="right",family="Comic Sans MS",size=20,style="oblique",color="c")

