S变换介绍(附代码)
1、S变换
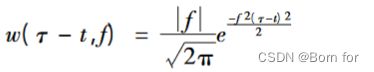
作为小波变换和短时傅里叶变换的继承和发展, S 变换采用高斯窗函数且窗宽与频率的倒数成正比,免去了窗函数的选择和改善了窗宽固定的缺陷,并且时频表示中各频率分量的相位谱与原始信号保持直接的联系,使其在 PQD 分析中可以采用更多的特征量,同时, S 变换提取的特征量对噪声不敏感。因此,在电能电能质量扰动、轴承故障诊断领域运用广泛。适用于非平稳信号的时频分析方法,其定义为:


2、S变换matlab代码
unction [st,t,f] = st(timeseries,minfreq,maxfreq,samplingrate,freqsamplingrate)
% Returns the Stockwell Transform of the timeseries.
% Code by Robert Glenn Stockwell.
% DO NOT DISTRIBUTE
% BETA TEST ONLY
% Reference is "Localization of the Complex Spectrum: The S Transform"
% from IEEE Transactions on Signal Processing, vol. 44., number 4, April 1996, pages 998-1001.
%
%-------Inputs Needed------------------------------------------------
%
%   *****All frequencies in (cycles/(time unit))!******
%	"timeseries" - vector of data to be transformed
%-------Optional Inputs ------------------------------------------------
%
%"minfreq" is the minimum frequency in the ST result(Default=0)
%"maxfreq" is the maximum frequency in the ST result (Default=Nyquist)
%"samplingrate" is the time interval between samples (Default=1)
%"freqsamplingrate" is the frequency-sampling interval you desire in the ST result (Default=1)
%Passing a negative number will give the default ex.  [s,t,f] = st(data,-1,-1,2,2)
%-------Outputs Returned------------------------------------------------
%
% st     -a complex matrix containing the Stockwell transform.
%			 The rows of STOutput are the frequencies and the
%         columns are the time values ie each column is
%         the "local spectrum" for that point in time
%  t      - a vector containing the sampled times
%  f      - a vector containing the sampled frequencies
%--------Additional details-----------------------
%   %  There are several parameters immediately below that
%  the user may change. They are:
%[verbose]    if true prints out informational messages throughout the function.
%[removeedge] if true, removes a least squares fit parabola
%                and puts a 5% hanning taper on the edges of the time series.
%                This is usually a good idea.
%[analytic_signal]  if the timeseries is real-valued
%                      this takes the analytic signal and STs it.
%                      This is almost always a good idea.
%[factor]     the width factor of the localizing gaussian
%                ie, a sinusoid of period 10 seconds has a
%                gaussian window of width factor*10 seconds.
%                I usually use factor=1, but sometimes factor = 3
%                to get better frequency resolution.
%   Copyright (c) by Bob Stockwell
%   $Revision: 1.2 $  $Date: 1997/07/08  $


% This is the S transform wrapper that holds default values for the function.
TRUE = 1;
FALSE = 0;
%%% DEFAULT PARAMETERS  [change these for your particular application]
verbose = TRUE;
removeedge= FALSE;
analytic_signal =  FALSE;
factor = 1;
%%% END of DEFAULT PARAMETERS


%%%START OF INPUT VARIABLE CHECK
% First:  make sure it is a valid time_series
%         If not, return the help message

if verbose disp(' '),end  % i like a line left blank

if nargin == 0
   if verbose disp('No parameters inputted.'),end
   st_help
   t=0;,st=-1;,f=0;
   return
end

% Change to column vector
if size(timeseries,2) > size(timeseries,1)
	timeseries=timeseries';
end

% Make sure it is a 1-dimensional array
if size(timeseries,2) > 1
   error('Please enter a *vector* of data, not matrix')
	return
elseif (size(timeseries)==[1 1]) == 1
	error('Please enter a *vector* of data, not a scalar')
	return
end

% use defaults for input variables

if nargin == 1
   minfreq = 0;
   maxfreq = fix(length(timeseries)/2);
   samplingrate=1;
   freqsamplingrate=1;
elseif nargin==2
   maxfreq = fix(length(timeseries)/2);
   samplingrate=1;
   freqsamplingrate=1;
   [ minfreq,maxfreq,samplingrate,freqsamplingrate] =  check_input(minfreq,maxfreq,samplingrate,freqsamplingrate,verbose,timeseries);
elseif nargin==3
   samplingrate=1;
   freqsamplingrate=1;
   [ minfreq,maxfreq,samplingrate,freqsamplingrate] =  check_input(minfreq,maxfreq,samplingrate,freqsamplingrate,verbose,timeseries);
elseif nargin==4
   freqsamplingrate=1;
   [ minfreq,maxfreq,samplingrate,freqsamplingrate] =  check_input(minfreq,maxfreq,samplingrate,freqsamplingrate,verbose,timeseries);
elseif nargin == 5
      [ minfreq,maxfreq,samplingrate,freqsamplingrate] =  check_input(minfreq,maxfreq,samplingrate,freqsamplingrate,verbose,timeseries);
else
   if verbose disp('Error in input arguments: using defaults'),end
   minfreq = 0;
   maxfreq = fix(length(timeseries)/2);
   samplingrate=1;
   freqsamplingrate=1;
end
if verbose
   disp(sprintf('Minfreq = %d',minfreq))
   disp(sprintf('Maxfreq = %d',maxfreq))
   disp(sprintf('Sampling Rate (time   domain) = %d',samplingrate))
   disp(sprintf('Sampling Rate (freq.  domain) = %d',freqsamplingrate))
   disp(sprintf('The length of the timeseries is %d points',length(timeseries)))

   disp(' ')
end
%END OF INPUT VARIABLE CHECK

% If you want to "hardwire" minfreq & maxfreq & samplingrate & freqsamplingrate do it here

% calculate the sampled time and frequency values from the two sampling rates
t = (0:length(timeseries)-1)*samplingrate;
spe_nelements =ceil((maxfreq - minfreq+1)/freqsamplingrate)   ;
f = (minfreq + [0:spe_nelements-1]*freqsamplingrate)/(samplingrate*length(timeseries));
if verbose disp(sprintf('The number of frequency voices is %d',spe_nelements)),end


% The actual S Transform function is here:
st = strans(timeseries,minfreq,maxfreq,samplingrate,freqsamplingrate,verbose,removeedge,analytic_signal,factor);
% this function is below, thus nicely encapsulated

%WRITE switch statement on nargout
% if 0 then plot amplitude spectrum
if nargout==0
   if verbose disp('Plotting pseudocolor image'),end
   pcolor(t,f,abs(st))
end


return


%^^^^^^^^^^^^^^^^^^^^^^^^^^^^^^^^^^^^^^^^^^^^^^^^^^^^^^^^^^^^^^^^^^^^^^^^^^^^^^^^^^^^^^
%^^^^^^^^^^^^^^^^^^^^^^^^^^^^^^^^^^^^^^^^^^^^^^^^^^^^^^^^^^^^^^^^^^^^^^^^^^^^^^^^^^^^^^
%^^^^^^^^^^^^^^^^^^^^^^^^^^^^^^^^^^^^^^^^^^^^^^^^^^^^^^^^^^^^^^^^^^^^^^^^^^^^^^^^^^^^^^
%^^^^^^^^^^^^^^^^^^^^^^^^^^^^^^^^^^^^^^^^^^^^^^^^^^^^^^^^^^^^^^^^^^^^^^^^^^^^^^^^^^^^^^
%^^^^^^^^^^^^^^^^^^^^^^^^^^^^^^^^^^^^^^^^^^^^^^^^^^^^^^^^^^^^^^^^^^^^^^^^^^^^^^^^^^^^^^


function st = strans(timeseries,minfreq,maxfreq,samplingrate,freqsamplingrate,verbose,removeedge,analytic_signal,factor);
% Returns the Stockwell Transform, STOutput, of the time-series
% Code by R.G. Stockwell.
% Reference is "Localization of the Complex Spectrum: The S Transform"
% from IEEE Transactions on Signal Processing, vol. 44., number 4,
% April 1996, pages 998-1001.
%
%-------Inputs Returned------------------------------------------------
%         - are all taken care of in the wrapper function above
%
%-------Outputs Returned------------------------------------------------
%
%	ST    -a complex matrix containing the Stockwell transform.
%			 The rows of STOutput are the frequencies and the
%			 columns are the time values
%
%
%-----------------------------------------------------------------------

% Compute the length of the data.
n=length(timeseries);
original = timeseries;
if removeedge
    if verbose disp('Removing trend with polynomial fit'),end
 	 ind = [0:n-1]';
    r = polyfit(ind,timeseries,2);
    fit = polyval(r,ind) ;
	 timeseries = timeseries - fit;
    if verbose disp('Removing edges with 5% hanning taper'),end
    sh_len = floor(length(timeseries)/10);
    wn = hanning(sh_len);
    if(sh_len==0)
       sh_len=length(timeseries);
       wn = 1&[1:sh_len];
    end
    % make sure wn is a column vector, because timeseries is
   if size(wn,2) > size(wn,1)
      wn=wn';
   end

   timeseries(1:floor(sh_len/2),1) = timeseries(1:floor(sh_len/2),1).*wn(1:floor(sh_len/2),1);
	timeseries(length(timeseries)-floor(sh_len/2):n,1) = timeseries(length(timeseries)-floor(sh_len/2):n,1).*wn(sh_len-floor(sh_len/2):sh_len,1);

end

% If vector is real, do the analytic signal

if analytic_signal
   if verbose disp('Calculating analytic signal (using Hilbert transform)'),end
   % this version of the hilbert transform is different than hilbert.m
   %  This is correct!
   ts_spe = fft(real(timeseries));
   h = [1; 2*ones(fix((n-1)/2),1); ones(1-rem(n,2),1); zeros(fix((n-1)/2),1)];
   ts_spe(:) = ts_spe.*h(:);
   timeseries = ifft(ts_spe);
end

% Compute FFT's
tic;vector_fft=fft(timeseries);tim_est=toc;
vector_fft=[vector_fft,vector_fft];
tim_est = tim_est*ceil((maxfreq - minfreq+1)/freqsamplingrate)   ;
if verbose disp(sprintf('Estimated time is %f',tim_est)),end

% Preallocate the STOutput matrix
st=zeros(ceil((maxfreq - minfreq+1)/freqsamplingrate),n);
% Compute the mean
% Compute S-transform value for 1 ... ceil(n/2+1)-1 frequency points
if verbose disp('Calculating S transform...'),end
if minfreq == 0
   st(1,:) = mean(timeseries)*(1&[1:1:n]);
else
  	st(1,:)=ifft(vector_fft(minfreq+1:minfreq+n).*g_window(n,minfreq,factor));
end

%the actual calculation of the ST
% Start loop to increment the frequency point
for banana=freqsamplingrate:freqsamplingrate:(maxfreq-minfreq)
   st(banana/freqsamplingrate+1,:)=ifft(vector_fft(minfreq+banana+1:minfreq+banana+n).*g_window(n,minfreq+banana,factor));
end   % a fruit loop!   aaaaa ha ha ha ha ha ha ha ha ha ha
% End loop to increment the frequency point
if verbose disp('Finished Calculation'),end

%%% end strans function

%------------------------------------------------------------------------
function gauss=g_window(length,freq,factor)

% Function to compute the Gaussion window for
% function Stransform. g_window is used by function
% Stransform. Programmed by Eric Tittley
%
%-----Inputs Needed--------------------------
%
%	length-the length of the Gaussian window
%
%	freq-the frequency at which to evaluate
%		  the window.
%	factor- the window-width factor
%
%-----Outputs Returned--------------------------
%
%	gauss-The Gaussian window
%

vector(1,:)=[0:length-1];
vector(2,:)=[-length:-1];
vector=vector.^2;
vector=vector*(-factor*2*pi^2/freq^2);
% Compute the Gaussion window
gauss=sum(exp(vector));

%-----------------------------------------------------------------------

%^^^^^^^^^^^^^^^^^^^^^^^^^^^^^^^^^^^^^^^^^^^^^^^^^^^^^^^^^^^^^^^^^^^^^^^^^^%
function [ minfreq,maxfreq,samplingrate,freqsamplingrate] =  check_input(minfreq,maxfreq,samplingrate,freqsamplingrate,verbose,timeseries)
% this checks numbers, and replaces them with defaults if invalid

% if the parameters are passed as an array, put them into the appropriate variables
s = size(minfreq);
l = max(s);
if l > 1
   if verbose disp('Array of inputs accepted.'),end
   temp=minfreq;
   minfreq = temp(1);;
   if l > 1  maxfreq = temp(2);,end;
   if l > 2  samplingrate = temp(3);,end;
   if l > 3  freqsamplingrate = temp(4);,end;
   if l > 4
      if verbose disp('Ignoring extra input parameters.'),end
   end;

end

   if minfreq < 0 | minfreq > fix(length(timeseries)/2);
      minfreq = 0;
      if verbose disp('Minfreq < 0 or > Nyquist. Setting minfreq = 0.'),end
   end
   if maxfreq > length(timeseries)/2  | maxfreq < 0
      maxfreq = fix(length(timeseries)/2);
      if verbose disp(sprintf('Maxfreq < 0 or > Nyquist. Setting maxfreq = %d',maxfreq)),end
   end
      if minfreq > maxfreq
      temporary = minfreq;
      minfreq = maxfreq;
      maxfreq = temporary;
      clear temporary;
      if verbose disp('Swapping maxfreq <=> minfreq.'),end
   end
   if samplingrate <0
      samplingrate = abs(samplingrate);
      if verbose disp('Samplingrate <0. Setting samplingrate to its absolute value.'),end
   end
   if freqsamplingrate < 0   % check 'what if freqsamplingrate > maxfreq - minfreq' case
      freqsamplingrate = abs(freqsamplingrate);
      if verbose disp('Frequency Samplingrate negative, taking absolute value'),end
   end

% bloody odd how you don't end a function

%^^^^^^^^^^^^^^^^^^^^^^^^^^^^^^^^^^^^^^^^^^^^^^^^^^^^^^^^^^^^^^^^^^^^^^^^^^%
function st_help
   disp(' ')
	disp('st()  HELP COMMAND')
	disp('st() returns  - 1 or an error message if it fails')
	disp('USAGE::    [localspectra,timevector,freqvector] = st(timeseries)')
  	disp('NOTE::   The function st() sets default parameters then calls the function strans()')
   disp(' ')
   disp('You can call strans() directly and pass the following parameters')
   disp(' **** Warning!  These inputs are not checked if strans() is called directly!! ****')
  	disp('USAGE::  localspectra = strans(timeseries,minfreq,maxfreq,samplingrate,freqsamplingrate,verbose,removeedge,analytic_signal,factor) ')

   disp(' ')
   disp('Default parameters (available in st.m)')
	disp('VERBOSE          - prints out informational messages throughout the function.')
	disp('REMOVEEDGE       - removes the edge with a 5% taper, and takes')
   disp('FACTOR           -  the width factor of the localizing gaussian')
   disp('                    ie, a sinusoid of period 10 seconds has a ')
   disp('                    gaussian window of width factor*10 seconds.')
   disp('                    I usually use factor=1, but sometimes factor = 3')
   disp('                    to get better frequency resolution.')
   disp(' ')
   disp('Default input variables')
   disp('MINFREQ           - the lowest frequency in the ST result(Default=0)')
   disp('MAXFREQ           - the highest frequency in the ST result (Default=nyquist')
   disp('SAMPLINGRATE      - the time interval between successive data points (Default = 1)')
   disp('FREQSAMPLINGRATE  - the number of frequencies between samples in the ST results')

% end of st_help procedure
代码引用来源IEEE Transactions on Signal Processing, vol. 44., number 4, April 1996, pages 998-1001.