不知道你有没有遇到这种情况,Go服务总是是不是的响应非常慢排查发现所有的依赖还都挺快,感觉是Go服务自身慢又不知道怎么慢在哪里;或者说请求甚至完全没响应,Go服务明明在正常运行,请求去哪儿了呢?或者说Go服务内存占用总是居高不下,内存都浪费在哪呢?这些问题都可以通过pprof分析,本篇文章将为你演示如何基于pprof分析程序性能(问题)。
pprof概述
为什么pprof可以帮助我们分析Go程序性能呢?因为它可以采集程序运行时数据:比如说协程栈,这样服务阻塞在哪里是不是一目了然了;比如说内存分配情况包括调用栈,这样哪里耗费内存是不是也清楚了。
当然想要通过pprof分析程序性能,也是要引入一丢丢代码吧,毕竟采集程序运行时数据,是需要耗费一些资源的。引入pprof采样也非常简单,几行代码就能搞定:
package main

import (
    "net/http"
    _ "net/http/pprof"
)

func main() {
    go func() {
        http.ListenAndServe("0.0.0.0:6060", nil)
    }()
}
就是这么简单就可以了。那怎么看pprof采集的数据呢?同样很简单,浏览器访问某个接口就可以,接口返回页面如下:

pprof采集的数据指标说明如下:
//浏览器输入:
http://127.0.0.1:8888/debug/pprof/

//内存分配采样,只有引入net/http/pprof才会采集
allocs: A sampling of all past memory allocations

//采集协程阻塞事件,默认不开启;可通过runtime.SetBlockProfileRate开启
block: Stack traces that led to blocking on synchronization primitives

//程序启动命令
cmdline: The command line invocation of the current program

//协程调用栈桢
goroutine: Stack traces of all current goroutines

//与allocs采样数据一样,但是可用来采样存活对象内存分配(采样前可运行GC)
heap: A sampling of memory allocations of live objects. You can specify the gc GET parameter to run GC before taking the heap sample.

//采集锁事件,默认不开启;可通过runtime.SetMutexProfileFraction开启
mutex: Stack traces of holders of contended mutexes

//CPU采样,可以通过参数seconds指定采样时间;可用来分析程序热点
profile: CPU profile. You can specify the duration in the seconds GET parameter. After you get the profile file, use the go tool pprof command to investigate the profile.

//线程创建调用栈
threadcreate: Stack traces that led to the creation of new OS threads

//记录Go服务在做什么,采集包括协程调度,GC,系统调用等事件
trace: A trace of execution of the current program. You can specify the duration in the seconds GET parameter. After you get the trace file, use the go tool trace command to investigate the trace.
举一个例子,goroutine指标输出所有线程栈桢,可用于分析程序阻塞情况。比如,大量协程阻塞在获取锁这一处,那是不是因为锁没被释放导致死锁了;比如,大量协程阻塞在管道写操作(生产消费业务),那是不是因为消费协程处理太慢了,导致管道数据满了,生产者无法写入数据了,等等。goroutine指标输出内容如下:
http://127.0.0.1:8888/debug/pprof/goroutine?debug=1

//第一个数字表示协程数
1 @ 0x10390d6 0x1032357 0x1063929 0x10d0372 0x10d16da 0x10d16c8 0x1126c29 0x1135d85 0x131dc9f 0x1069921
#    0x1063928    internal/poll.runtime_pollWait+0x88        /go1.18/src/runtime/netpoll.go:302
#    0x10d0371    internal/poll.(*pollDesc).wait+0x31        /go1.18/src/internal/poll/fd_poll_runtime.go:83
#    0x10d16d9    internal/poll.(*pollDesc).waitRead+0x259    /go1.18/src/internal/poll/fd_poll_runtime.go:88
#    0x10d16c7    internal/poll.(*FD).Read+0x247            /go1.18/src/internal/poll/fd_unix.go:167
#    0x1126c28    net.(*netFD).Read+0x28                /go1.18/src/net/fd_posix.go:55
#    0x1135d84    net.(*conn).Read+0x44                /go1.18/src/net/net.go:183
#    0x131dc9e    net/http.(*connReader).backgroundRead+0x3e    /go1.18/src/net/http/server.go:672

......
为什么只是引入net/http/pprof就能采集这些数据指标呢(当然只是部分),注意上面的代码事例,我们还启动了一个web服务,而且没有设置HTTP请求处理器;引入引入net/http/pprof包的时候,init方法就默认注册好HTTP请求处理器了,所以我们才能通过这些接口获取这些数据指标。
func init() {
    //前缀匹配,包含allocs、heap、goroutine等
    http.HandleFunc("/debug/pprof/", Index)

    http.HandleFunc("/debug/pprof/cmdline", Cmdline)
    http.HandleFunc("/debug/pprof/profile", Profile)
    http.HandleFunc("/debug/pprof/symbol", Symbol)
    http.HandleFunc("/debug/pprof/trace", Trace)
}
内存
内存的指标可通过heap或者allocs查看,这两个指标采样的数据是一样,但是heap可以用来采样存活对象的内存分配(采样前可运行GC,这样剩下的都是存活对象了)。以heap为例,内存指标展示如下:
http://127.0.0.1:8888/debug/pprof/heap?debug=1

//heap profile 汇总数据:
//10: 29728 [16: 54144] 含义为 inuse对象数目(已分配的,去除了已释放的): inuse字节 [已分配对象数目: 已分配字节]
//heap/1048576 平均采样频率1048576字节
heap profile: 10: 29728 [16: 54144] @ heap/1048576

//1: 18432 [1: 18432] 含义同上面;该调用栈内存分配情况
1: 18432 [1: 18432] @ 0x1363bc9 0x1365cce 0x13660f8 0x1366c51 0x1366c46 0x1669517 0x1045c06 0x1045b51 0x1045b51 0x1045b51 0x1045b51 0x1045b51 0x1038c33 0x1069881
#    0x1363bc8    regexp.onePassCopy+0x48                    /go1.18/src/regexp/onepass.go:226
#    0x1365ccd    regexp.compileOnePass+0x14d                /go1.18/src/regexp/onepass.go:498
......

//其他调用栈


//总的内存统计指标
# runtime.MemStats
# Alloc = 1311912        //已分堆内存字节数,不包含已释放内存,与一致(分配时累加,释放减)
# TotalAlloc = 5007040    //总的分配堆内存字节数,包含已释放内存
# Sys = 16598024        //从操作系统申请的内存总数(包括栈,堆,还有Go的一些原生对象等)
# Mallocs = 34063        //内存分配数(分配的mspan内存块数目之和)
# Frees = 25879            //内存释放数(释放也就是回收的mspan内存块数目之和)
# HeapAlloc = 1311912    //同Alloc
# HeapSys = 7602176        //从操作系统申请的,仅用于堆
# HeapIdle = 4104192    //mspan没被分配就是idle状态,HeapIdle等于这些状态的mspan内存之和
# HeapInuse = 3497984    //mspan部分内存被分配了就是inuse状态,HeapInuse等于这些状态的mspan内存之和
# HeapReleased = 2449408    //归还给操作系统的堆内存
# HeapObjects = 8184        //堆对象数目,等于Mallocs-Frees
# Stack = 786432 / 786432    //inuse的栈内存/向操作系统申请的栈内存

# NextGC = 4194304            //下次GC结束后的堆内存目标大小
# LastGC = 1663660279482080000    //上次GC结束时间
# PauseNs = [42600 .......]        //stopTheWorld暂停时间,单位纳秒;256大小的循环数组
# PauseEnd = [1663582175653806000 ......]    //GC结束时间;256大小的循环数组
# GCCPUFraction = 2.6664927576867443e-06    //GC耗费CPU时间占整体的比例
# MaxRSS = 14467072                            //进程分配的常驻内存大小
//省略了部分
可以看到,内存指标还是比较完善的,包括当前内存分配一些指标,历时GC指标,以及每个调用栈的内存分配器情况都有(当然只是采样)。问题来了,怎么采集到内存分配调用栈呢?而且就算只是采样,也是会消耗资源的,假设我没开启pprof也不分析这些数据,会采集吗?当然不会了。
首先,要采集内存分配调用栈,肯定是需要在内存分配入口也就是mallocgc采集了,如果判断需要采样,则记录当前调用栈以及内存分配大小;貌似还不够,调用栈的内存分配指标是inuse状态分配的内存/对象,也就是内存被释放后,需要去除在外的,如果只在mallocgc处采集数据的话,显然是不够的。所以,真正的逻辑应该是,mallocgc时采集内存分配,垃圾回收sweep时采集内存回收,这两相减不就是inuse状态的内存。采集过程可以参考这两个函数:
// Called by malloc to record a profiled block.
func mProf_Malloc(p unsafe.Pointer, size uintptr)
// Called when freeing a profiled block.
func mProf_Free(b *bucket, size uintptr)
第二个问题,什么情况下才开启内存采集?当然是引入net/http/pprof包了。不过,这一逻辑还是有些复杂,全局变量runtime.disableMemoryProfiling控制是否开启内存指标采集,默认为false,但是在Go编译阶段,连接器检测到代码中没有引入 runtime.MemProfile,则设置为true,也就是禁止内存指标采集;当我们引入net/http/pprof包时,代码中也就引入了runtime.MemProfile。
// disableMemoryProfiling is set by the linker if runtime.MemProfile
// is not used and the link type guarantees nobody else could use it
// elsewhere.
var disableMemoryProfiling bool
虽说通过heap或者allocs可以查看内存指标,甚至还能包含调用栈,但是这么多数据,如何能快速的定位到哪些代码在大量分配内存呢?Go语言还提供了pprof工具,可以帮助我们分析这些数据,使用也很简单:
go tool pprof http://127.0.0.1:8888/debug/pprof/heap?debug=1

//help查看支持命令;top命令显示内存申请最多的调用,默认top10
//flat 申请内存大小;flat% 申请内存占用的比例;sum% 当前行前面所有行总申请内存占用的比例
//cum 累计值,该函数以及调用栈所有函数总得申请内存;cum% 申请内存占用的比例
(pprof) top
     flat  flat%   sum%        cum   cum%
 3587.94kB 87.51% 87.51%  3587.94kB 87.51%  runtime.allocm
  512.06kB 12.49%   100%   512.06kB 12.49%  sync.(*poolChain).pushHead
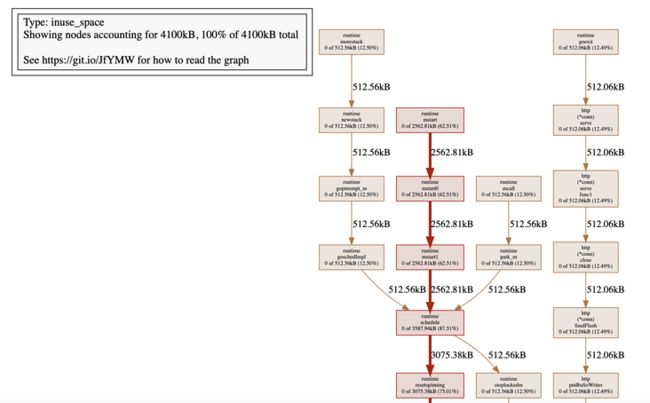
看到了吧,基于pprof工具可以很方便找出申请内存最多的调用。这是本地启动的一个测试服务,基本没有请求访问,所以申请内存最多的还是创建线程相关逻辑。另外,pprof工具也可以帮助我们将内存申请指标绘制成图片(svg、web、pdf命令都可以),图片包含函数调用链路每个节点申请的内存指标(线越粗说明该调用栈内存分配越多):
cpu pprofile
设想这么一个场景,某一天你突然收到报警,线上机器cpu利用率突然飙升且居高不下,简单定位发现是Go程序占用太多cpu。接下来怎么排查呢?可以使用
cpu profile分析,其可用来分析程序热点,比如发现程序中的死循环。
为什么cpu profile可以分析程序热点呢?因为开启之后,会定时记录当然程序执行点(就是程序正在执行哪一行代码)以及调用栈,采集一段时间之后(默认30秒),根据这些数据是不是就能分析出来热点代码了?
cpu profile的指标输出是一个文件,需要借助pprof工具分析,使用方式如下:
go tool pprof http://127.0.0.1:8888/debug/pprof/profile?debug=1
(pprof)
这里我们基于前面介绍的Go性能测试工具,说明如何分析cpu指标:
package demo

import (
    "strings"
    "testing"
)

func BenchmarkStringPlus(b *testing.B) {
    s := ""
    for i := 0; i < b.N; i++ {
        s += "abc"
    }
}

func BenchmarkStringBuilder(b *testing.B) {
    build := strings.Builder{}
    for i := 0; i < b.N; i++ {
        build.WriteString("abc")
    }
}

// -cpuprofile 采集cpu指标,并输出的文件
//go test -benchtime 100000x -cpuprofile cpu.out  -bench .
基于pprof分析cpu指标文件:
go tool pprof cpu.out

//查询耗费cpu top10的调用
//flat 耗费cpu时间;flat% 耗费cpu时间的比例;sum% 当前行前面耗费cpu时间的比例
//cum 累计值,该函数以及调用栈所有函数耗费cpu时间;cum% 耗费cpu时间的比例
(pprof) top
Showing nodes accounting for 2.72s, 88.03% of 3.09s total
Dropped 26 nodes (cum <= 0.02s)
Showing top 10 nodes out of 82
      flat  flat%   sum%        cum   cum%
     1.02s 33.01% 33.01%      1.07s 34.63%  runtime.kevent
     0.69s 22.33% 55.34%      0.76s 24.60%  runtime.pthread_cond_wait
     0.30s  9.71% 65.05%      0.30s  9.71%  runtime.pthread_kill
     0.18s  5.83% 70.87%      0.18s  5.83%  runtime.pthread_cond_signal
     0.15s  4.85% 75.73%      0.15s  4.85%  runtime.libcCall
     0.10s  3.24% 78.96%      0.10s  3.24%  runtime.memmove
     0.10s  3.24% 82.20%      0.15s  4.85%  runtime.scanobject
     0.08s  2.59% 84.79%      0.08s  2.59%  runtime.gcFlushBgCredit
     0.07s  2.27% 87.06%      0.12s  3.88%  runtime.scanblock
     0.03s  0.97% 88.03%      0.04s  1.29%  runtime.casgstatus
字符串的相加是需要分配大量的内存,所以可以看到这次的性能测试,垃圾回收占用了较多cpu时间。另外我们还可以基于其他命令,分析出某一个函数的代码具体是哪里耗费时间多(list命令),:
//list命令参数为匹配模式(函数调用模糊匹配)
(pprof) list scanobject

Total: 3.09s
ROUTINE ======================== runtime.scanobject in /go1.18/src/runtime/mgcmark.go
     100ms      150ms (flat, cum)  4.85% of Total

         .       10ms   1246:    hbits := heapBitsForAddr(b)

      70ms       80ms   1290:    for i = 0; i < n; i, hbits = i+goarch.PtrSize, hbits.next() {

                                  }
另外,pprof工具也可以帮助我们将cpu指标绘制成图片(svg、web、pdf命令都可以),图片包含函数调用链路每个节点的cpu耗时(线越粗说明该调用cpu耗时越多):

当然pprof还提供web访问,如top,list,耗时图片等在web界面查看也非常方便,web界面还能查看经典的火焰图:
// -http启动web服务
go tool pprof -http=:9999 cpu.out
Serving web UI on http://localhost:9999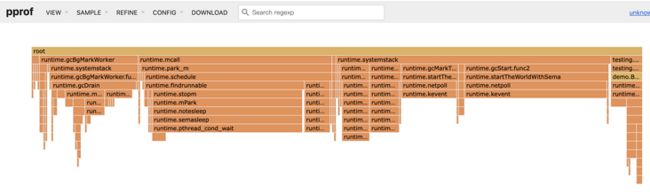
最后再简单说明一个问题:Go语言是如何定时采集cpu指标的,又是怎么采集cpu指标的呢?pprof.StartCPUProfile函数用来开启cpu指标的采集,"/debug/pprof/profile"接口也是通过这个函数实现的。定时底层其实也是通过定时器实现的(timer_create),定时器触发时(默认采集频率100hz,也就是1秒100次),会给创建定时器的线程发送SIGPROF信号,信号处理器(sighandler)记录当前程序执行点(pc寄存器)以及调用栈。
//创建线程级cpu profile:
-setThreadCPUProfiler(hz)
    -timer_create(_CLOCK_THREAD_CPUTIME_ID, &sevp, &timerid)

CLOCK_THREAD_CPUTIME_ID (since Linux 2.6.12) A clock that measures (user and system) CPU time consumed by the calling thread.
锁 & 阻塞
我们已经直到,block采集协程阻塞事件(包括调用栈桢),默认不开启,需要通过runtime.SetBlockProfileRate函数开启;mutex采集锁事件(包括调用栈桢),默认不开启,需要通过runtime.SetMutexProfileFraction函数开启。
以block指标为例,输出的数据如下:
//cycles取的是cputick,这里的值是平均每秒钟cputick递增多少;
cycles/second=1996821317

// 第一个值是协程阻塞的cputick数,第二个值是阻塞次数,根据cycles/second就可以计算平均阻塞时间了
161357271645546 364 @ 0x1048768 0x13a4014 0x1069921
#    0x1048767    runtime.selectgo+0x407                            /go1.18/src/runtime/select.go:509
#    0x13a4013    github.com/go-redis/redis/v8/internal/pool.(*ConnPool).reaper+0xd3    /xxx/vendor/github.com/go-redis/redis/v8/internal/pool/pool.go:485
注意block以及mutex输出的时间都是cputick,与时间有一个换算关系(cycles/second)。block含义是阻塞事件,协程抢锁或者管道的读写阻塞等,都会导致协程的阻塞,协程阻塞时会记录阻塞时间点cputick,解除阻塞时同样记录时间点cputick,以此计算出协程阻塞时间,同时在解除阻塞时记录调用栈。mutex含义是锁持有事件,在释放锁时记录时间以及调用栈。
同样的pprof工具可以帮助我们分析协程阻塞情况:
go tool pprof http://127.0.0.1:8888/debug/pprof/block?debug=1

(pprof) top
Dropped 102 nodes (cum <= 0.20hrs)
      flat  flat%   sum%        cum   cum%
  40.97hrs   100%   100%   40.97hrs   100%  runtime.selectgo
         0     0%   100%      23hrs 56.13%  github.com/go-redis/redis/v8/internal/pool.(*ConnPool).reaper
         0     0%   100%   17.97hrs 43.85%  github.com/go-sql-driver/mysql.(*mysqlConn).startWatcher.func1
         0     0%   100%   40.97hrs   100%  runtime.goexit
trace 概述
trace可跟踪Go程序多种类型事件,包括协程调度,系统调用,锁,垃圾回收等等,所以trace是一款Go程序性能问题利器。我们可以通过trace.Start开启trace追踪,"/debug/pprof/trace"接口就是基于该函数实现的。
//默认追踪1秒
go tool trace http://127.0.0.1:8888/debug/pprof/trace?seconds=1
Parsing trace...
Splitting trace...
Opening browser. Trace viewer is listening on http://127.0.0.1:64557
trace工具自动启动web服务,方便我们通过web界面查看,主要包含这几个方面的分析:
//展示每个逻辑处理器P每时刻在做什么
View trace
//协程分析
Goroutine analysis
//网络阻塞
Network blocking profile (⬇)
//同步阻塞,如锁之类的
Synchronization blocking profile (⬇)
//系统调用阻塞
Syscall blocking profile (⬇)
//调度延迟
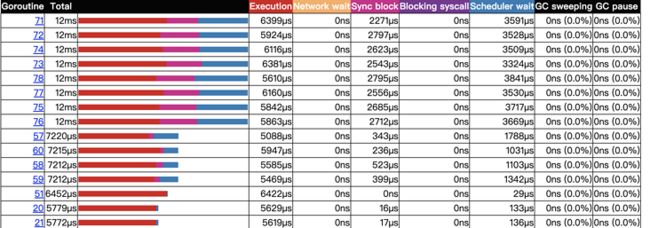
Scheduler latency profile (⬇)比如说协程分析,可以查看每一个协程的一些数据指标,包括执行时间,网络等待时间,同步阻塞时间,等待调度时间,GC暂停时间等等,列表如下(可以按照不通维度排序):
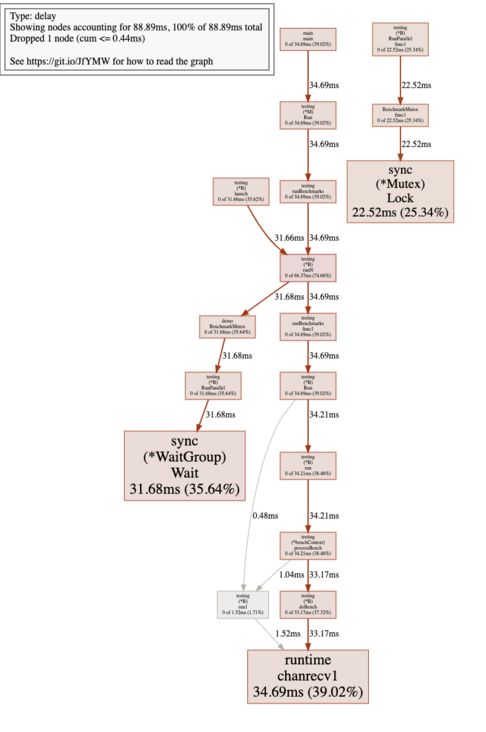
再比如同步阻塞分析,与上面类似,会生成一张图片,显示整个调用栈的阻塞时间:
总结
Go程序性能分析的基本手段还是需要掌握的,不然遇到性能问题你将束手无策。本篇文章主要介绍pprof以及trace的基本使用,以及主要数据指标分析,当然这里只介绍了一些理论,更多实践中的应用还需要你去探索。