Python实现线性回归和梯度下降算法
目录
线性回归基础
实战——波士顿房价的线性回归模型
实战——能源效能数据的相关分析与 线性回归模型
梯度下降法介绍
实战——梯度下降法在线性回归中的使用
实战——scikit-learn使用SGD实现线性回归
线性回归基础
什么是线性回归
举个例子,我们去市场买牛肉,一斤牛肉52块钱,两斤牛肉 104块钱,三斤牛肉156块钱,以此类推。也是说牛肉的价格随着牛 肉斤数的增加而有规律地增加,这种规律可以用下图表示:
可以看到上述规律可以用一条直线来表述,这就是一个线性模 型。用 x表示牛肉斤数, 用 y 表示价格,就得到方程: y=52x 这个方程就叫做回归方程,52叫做回归系数,求解回归系数的 过程叫做回归。
线性回归首先假设自变量和因变量是线性关系,然后通过对现有 样本进行回归,进而计算出回归系数以确定线性模型,最后使用这 个模型对未知样本进行预测
- 一元线性回归模型:f(x)=wx+b
- 多元线性回归模型:f(x)=w1 x1+w2 x2+…+wn xn+b
最小二乘法
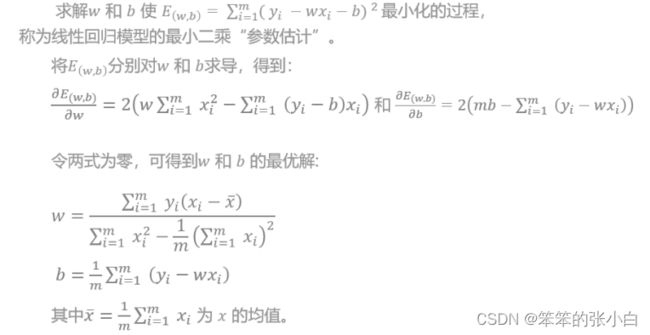
- 求解线性回归中的未知参数:最小二乘法
- 构造一个函数:理论值与观测值之差的平方和
- 目标:选择未知参数,使得观测值与理论值之差的平方和达到最小
以一元线性回归为例:
线性回归的衡量指标
- R 2 <= 1
- R 2越大越好。当预测模型没有任何错误时,R2等于1
- 引入R 2衡量指标的原因:可以对不同回归问题的模型准确度 进行统一衡量(例如:房价线性回归问题和学生成绩线性回归 问题)
实战——波士顿房价的线性回归模型
sklearn中实现线性回归使用 sklearn.linear_model.LinearRegression 根据波士顿历史房价数据建立回归模型,并检测模型准确率
import numpy as np
import matplotlib.pyplot as plt
from sklearn import datasets
# 加载波士顿房子数据集
boston = datasets.load_boston()
X = boston.data  # 样本特征
y = boston.target  # 样本标签
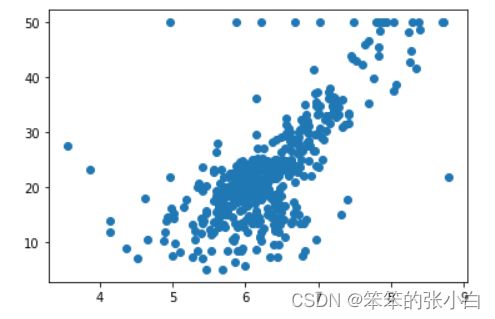
# 从图中发现,房价超过50万的样本可能有异常
plt.scatter(X[:,5],y)  # 这里我们选择房价数据集中的RM房屋大小来进行分析
plt.show()
X = X[y<50.0]  # 选择房价小于50万的样本特征
y = y[y<50.0]  # 选择房价小于50万的样本标签

from sklearn.model_selection import train_test_split

# 拆分数据集
X_train,X_test,y_train,y_test = train_test_split(X,y,random_state=666)

# 特征标准化处理
from sklearn.preprocessing import StandardScaler

std = StandardScaler()
# 对训练样本集进行特征标准化处理
X_train_standard = std.fit_transform(X_train)
# 对测试样本集进行特征标准化处理,要注意这里不能fit了!
X_test_standard = std.transform(X_test)

from sklearn.linear_model import LinearRegression
lin_reg = LinearRegression()
# 使用标准化后的训练样本集进行拟合学习(建立合适的线性回归模型)
lin_reg.fit(X_train_standard,y_train)
# 在测试集上测试模型的优劣,使用的是R^2标准
print(lin_reg.score(X_test_standard,y_test))
实战——能源效能数据的相关分析与 线性回归模型
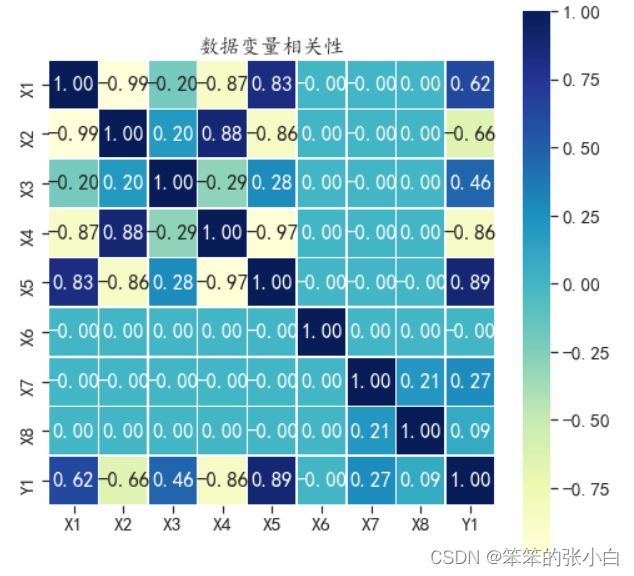
数据来自于UIC数据集中的能效数据集,该数据集用来分析建 筑的供热负荷能效和制冷负荷能效,其中自变量有8个,主要分析8 个自变量和供热负荷Y1之间的回归模型 根据效能数据绘制数据相关系数热力图,并建立回归模型,并检测 模型准确率。
import numpy as np
import matplotlib.pyplot as plt
import matplotlib
import seaborn as sns
from sklearn import datasets
import pandas as pd
# 解决绘图中文乱码问题
plt.rcParams['font.sans-serif'] = ['SimHei']
# 解决绘图负号问题
matplotlib.rcParams['axes.unicode_minus']=False
# 设置绘图字体
sns.set(font= "Kaiti",style="ticks",font_scale=1.4)
# 读取用于多元回归的数据
enbdf = pd.read_excel("ENB.xlsx")
# 对每个变量的取值进行标准化
enbdf_n = (enbdf - enbdf.mean()) / enbdf.std()
enbdf_n.head()
# 使用相关系数热力图可视化变量之间的相关性
datacor = enbdf_n.corr() # 默认计算pearson相关系数
# 热力图可视化相关系数
plt.figure(figsize=(8,8))
# annot参数:默认为False,为True的话,会在格子上显示数字
ax = sns.heatmap(datacor,square=True,annot=True,fmt=".2f",
linewidths=.5,cmap="YlGnBu")
ax.set_title("数据变量相关性")
plt.show()X = np.array(enbdf_n)[:,:-1] # 样本特征
y = np.array(enbdf_n)[:,-1] # 样本标签
from sklearn.model_selection import train_test_split
# 拆分数据集
X_train,X_test,y_train,y_test = train_test_split(X,y,random_state=666)
from sklearn.linear_model import LinearRegression
lin_reg = LinearRegression()
lin_reg.fit(X_train,y_train) # 使用训练集拟合模型
print(lin_reg.score(X_test,y_test)) # 使用测试集测试模型的优劣梯度下降法介绍
什么是梯度下降法
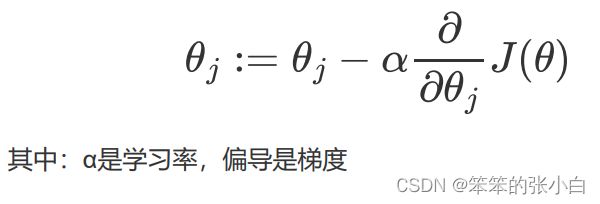
在机器学习中,对于很多监督学习模型,需要对原始的模型构 建损失函数 J,接下来便 是通过优化算法对损失函数J进行优化,最小化损失函数,以便寻找 到最优的参数theta. 于是,基于搜索的梯度下降法就产生了。 梯度下降法的含义是通过当前点的梯度(偏导数)的反方向寻找 到新的迭代点,并从当 前点移动到新的迭代点继续寻找新的迭代点,直到找到最优解。
梯度下降法参数更新
三种梯度下降法
两个小概念:
- 轮次:epoch,训练数据集学习的轮数
- 批次:batch,如果训练数据集较大,一轮要学习太多数据, 那就把一轮次要学习的 数据分成多个批次,一批一批数据 地学习
- 批量梯度下降法(Batch Gradient Descent,BGD):每次迭代时 (每次计算梯度)使用所有样本来进行梯度的更新。
- 随机梯度下降法(Stochastic Gradient Descent,SGD):每次迭代 的过程中,仅通过随机选择的一个样本计算梯度。
- 小批量梯度下降法(Mini-Batch Gradient Descent,MBGD):对 BGD和SGD进行了折中, 每次迭代时,抽取一部分(batch-size)训练样本,进行梯度的运算。
实战——梯度下降法在线性回归中的使用
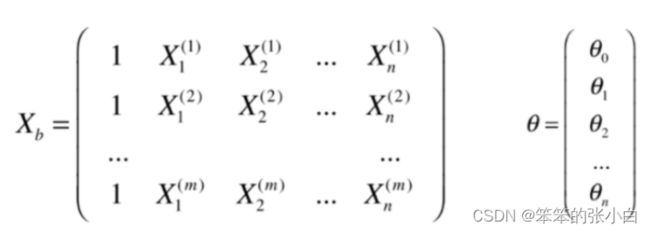
线性回归的梯度
其中:
import numpy as np
from sklearn import datasets
from sklearn.preprocessing import StandardScaler
from sklearn.model_selection import train_test_split
boston = datasets.load_boston()  # 波士顿房子数据集
X = boston.data   # 样本特征
y = boston.target  # 样本标签
X = X[y<50]
y = y[y<50]
# 拆分数据集
X_train,X_test,y_train,y_test = train_test_split(X,y,test_size=0.2,random_state=666)
# 标准化样本特征
std = StandardScaler()
std.fit(X_train)
X_train_std = std.transform(X_train)
X_test_std = std.transform(X_test)

# 计算损失函数值
def J(X_b,y,theta):
    try:
        return np.sum((X_b.dot(theta) - y) ** 2) / 2 * len(y)
    except:
        return float('inf')


# 计算梯度(针对一组theta参数的偏导数)
def dJ(X_b,y,theta):
    return X_b.T.dot(X_b.dot(theta) - y) / len(y)

# 以批量梯度下降法为例
def BGD(X_b,y,initial_theta,eta=0.01,iters=1e4,epsilon=1e-4):
    theta = initial_theta   # 将参数的初始值赋给theta变量
    curr_iter = 1
    while curr_iter < iters:   # 判断迭代次数
        gradient = dJ(X_b,y,theta)  # 计算当前theta对应的梯度
        last_theta = theta  # 先保存theta的旧值
        theta = theta - eta * gradient  # 更新theta
        cost_value = J(X_b,y,theta)  # 计算更新后的theta对应的损失函数值
        last_cost_value = J(X_b,y,last_theta)  # 计算更新前的theta对应的损失函数值
        # 如果两次损失函数的值相差的非常小,则认为损失函数已经最小了
        if abs(cost_value - last_cost_value) < epsilon:
            break
        curr_iter += 1  # 每次迭代完毕,迭代次数加1
    return theta,cost_value   # 返回最佳的theta和对应的损失函数值
# 拼接训练样本的X_b
X_b = np.hstack([np.ones((len(X_train_std),1)),X_train_std])
# 初始化theta
initial_theta = np.random.random(size=(X_b.shape[1]))
theta,cost_value = BGD(X_b,y_train,initial_theta,iters=1e5)
print("搜索的最佳参数是:",theta)
# 拼接测试样本的X_b
X_b_test = np.hstack([np.ones((len(X_test_std),1)),X_test_std])
# 在测试集上预测
y_predict = X_b_test.dot(theta)
from sklearn.metrics import mean_squared_error

r2 = 1 - mean_squared_error(y_test,y_predict) / np.var(y_test)
print("在测试集上的R方为:",r2)
实战——scikit-learn使用SGD实现线性回归
scikit-learn使用SGD实现线性回归使用了: sklearn.linear_model.SGDRegressor
from sklearn.linear_model import SGDRegressor

# 创建对象,该对象可以使用SGD搜索线性回归中的最佳参数
sgd = SGDRegressor()
sgd.fit(X_train_std,y_train)  # 在训练集上进行拟合
r2 = sgd.score(X_test_std,y_test)  # 在测试集上计算R方指标
print("在测试集上的R2指标为:",r2)

