第四章:目标检测YoloV3(下)
目录
-
- 多尺度检测
-
- 开启端到端训练
- 预测
-
- 模型效果及可视化展示
多尺度检测
目前我们计算损失函数是在特征图P0的基础上进行的,它的步幅stride=32。特征图的尺寸比较小,像素点数目比较少,每个像素点的感受野很大,具有非常丰富的高层级语义信息,可能比较容易检测到较大的目标。为了能够检测到尺寸较小的那些目标,需要在尺寸较大的特征图上面建立预测输出。如果我们在C2或者C1这种层级的特征图上直接产生预测输出,可能面临新的问题,它们没有经过充分的特征提取,像素点包含的语义信息不够丰富,有可能难以提取到有效的特征模式。在目标检测中,解决这一问题的方式是,将高层级的特征图尺寸放大之后跟低层级的特征图进行融合,得到的新特征图既能包含丰富的语义信息,又具有较多的像素点,能够描述更加精细的结构。
具体的网络实现方式如 图19 所示:
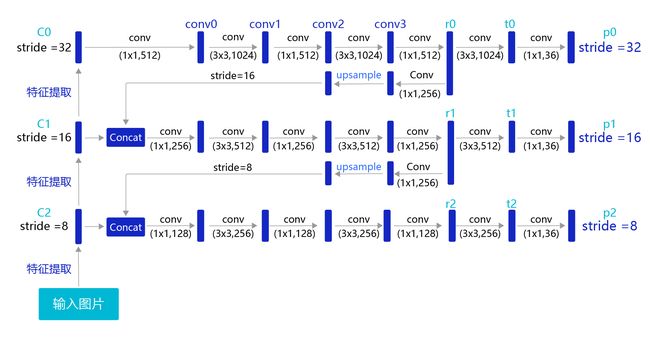
图19:生成多层级的输出特征图P0、P1、P2
YOLO-V3在每个区域的中心位置产生3个锚框,在3个层级的特征图上产生锚框的大小分别为P2 [(10×13),(16×30),(33×23)],P1 [(30×61),(62×45),(59× 119)],P0[(116 × 90), (156 × 198), (373 × 326]。越往后的特征图上用到的锚框尺寸也越大,能捕捉到大尺寸目标的信息;越往前的特征图上锚框尺寸越小,能捕捉到小尺寸目标的信息。
因为有多尺度的检测,所以需要对上面的代码进行较大的修改,而且实现过程也略显繁琐,所以推荐大家直接使用飞桨 fluid.layers.yolov3_loss API,关键参数说明如下:
paddle.fluid.layers.yolov3_loss(x, gt_box, gt_label, anchors, anchor_mask, class_num, ignore_thresh, downsample_ratio, gt_score=None, use_label_smooth=False, name=None)
- x: 输出特征图。
- gt_box: 真实框。
- gt_label: 真实框标签。
- ignore_thresh,预测框与真实框IoU阈值超过ignore_thresh时,不作为负样本,YOLO-V3模型里设置为0.7。
- downsample_ratio,特征图P0的下采样比例,使用Darknet53骨干网络时为32。
- gt_score,真实框的置信度,在使用了mixup技巧时用到。
- use_label_smooth,一种训练技巧,如不使用,设置为False。
- name,该层的名字,比如’yolov3_loss’,默认值为None,一般无需设置。
对于使用了多层级特征图产生预测框的方法,其具体实现代码如下:
# 定义上采样模块
class Upsample(fluid.dygraph.Layer):
    def __init__(self, scale=2):
        super(Upsample,self).__init__()
        self.scale = scale

    def forward(self, inputs):
        # get dynamic upsample output shape
        shape_nchw = fluid.layers.shape(inputs)
        shape_hw = fluid.layers.slice(shape_nchw, axes=[0], starts=[2], ends=[4])
        shape_hw.stop_gradient = True
        in_shape = fluid.layers.cast(shape_hw, dtype='int32')
        out_shape = in_shape * self.scale
        out_shape.stop_gradient = True

        # reisze by actual_shape
        out = fluid.layers.resize_nearest(
            input=inputs, scale=self.scale, actual_shape=out_shape)
        return out

# 定义YOLO-V3模型
class YOLOv3(fluid.dygraph.Layer):
    def __init__(self, num_classes=7, is_train=True):
        super(YOLOv3,self).__init__()

        self.is_train = is_train
        self.num_classes = num_classes
        # 提取图像特征的骨干代码
        self.block = DarkNet53_conv_body(
                                         is_test = not self.is_train)
        self.block_outputs = []
        self.yolo_blocks = []
        self.route_blocks_2 = []
        # 生成3个层级的特征图P0, P1, P2
        for i in range(3):
            # 添加从ci生成ri和ti的模块
            yolo_block = self.add_sublayer(
                "yolo_detecton_block_%d" % (i),
                YoloDetectionBlock(
                                   ch_in=512//(2**i)*2 if i==0 else 512//(2**i)*2 + 512//(2**i),
                                   ch_out = 512//(2**i),
                                   is_test = not self.is_train))
            self.yolo_blocks.append(yolo_block)

            num_filters = 3 * (self.num_classes + 5)

            # 添加从ti生成pi的模块,这是一个Conv2D操作,输出通道数为3 * (num_classes + 5)
            block_out = self.add_sublayer(
                "block_out_%d" % (i),
                Conv2D(num_channels=512//(2**i)*2,
                       num_filters=num_filters,
                       filter_size=1,
                       stride=1,
                       padding=0,
                       act=None,
                       param_attr=ParamAttr(
                           initializer=fluid.initializer.Normal(0., 0.02)),
                       bias_attr=ParamAttr(
                           initializer=fluid.initializer.Constant(0.0),
                           regularizer=L2Decay(0.))))
            self.block_outputs.append(block_out)
            if i < 2:
                # 对ri进行卷积
                route = self.add_sublayer("route2_%d"%i,
                                          ConvBNLayer(ch_in=512//(2**i),
                                                      ch_out=256//(2**i),
                                                      filter_size=1,
                                                      stride=1,
                                                      padding=0,
                                                      is_test=(not self.is_train)))
                self.route_blocks_2.append(route)
            # 将ri放大以便跟c_{i+1}保持同样的尺寸
            self.upsample = Upsample()

    def forward(self, inputs):
        outputs = []
        blocks = self.block(inputs)
        for i, block in enumerate(blocks):
            if i > 0:
                # 将r_{i-1}经过卷积和上采样之后得到特征图,与这一级的ci进行拼接
                block = fluid.layers.concat(input=[route, block], axis=1)
            # 从ci生成ti和ri
            route, tip = self.yolo_blocks[i](block)
            # 从ti生成pi
            block_out = self.block_outputs[i](tip)
            # 将pi放入列表
            outputs.append(block_out)

            if i < 2:
                # 对ri进行卷积调整通道数
                route = self.route_blocks_2[i](route)
                # 对ri进行放大,使其尺寸和c_{i+1}保持一致
                route = self.upsample(route)

        return outputs

    def get_loss(self, outputs, gtbox, gtlabel, gtscore=None,
                 anchors = [10, 13, 16, 30, 33, 23, 30, 61, 62, 45, 59, 119, 116, 90, 156, 198, 373, 326],
                 anchor_masks = [[6, 7, 8], [3, 4, 5], [0, 1, 2]],
                 ignore_thresh=0.7,
                 use_label_smooth=False):
        """
        使用fluid.layers.yolov3_loss,直接计算损失函数,过程更简洁,速度也更快
        """
        self.losses = []
        downsample = 32
        for i, out in enumerate(outputs): # 对三个层级分别求损失函数
            anchor_mask_i = anchor_masks[i]
            loss = fluid.layers.yolov3_loss(
                    x=out,  # out是P0, P1, P2中的一个
                    gt_box=gtbox,  # 真实框坐标
                    gt_label=gtlabel,  # 真实框类别
                    gt_score=gtscore,  # 真实框得分,使用mixup训练技巧时需要,不使用该技巧时直接设置为1,形状与gtlabel相同
                    anchors=anchors,   # 锚框尺寸,包含[w0, h0, w1, h1, ..., w8, h8]共9个锚框的尺寸
                    anchor_mask=anchor_mask_i, # 筛选锚框的mask,例如anchor_mask_i=[3, 4, 5],将anchors中第3、4、5个锚框挑选出来给该层级使用
                    class_num=self.num_classes, # 分类类别数
                    ignore_thresh=ignore_thresh, # 当预测框与真实框IoU > ignore_thresh,标注objectness = -1
                    downsample_ratio=downsample, # 特征图相对于原图缩小的倍数,例如P0是32, P1是16,P2是8
                    use_label_smooth=False)      # 使用label_smooth训练技巧时会用到,这里没用此技巧,直接设置为False
            self.losses.append(fluid.layers.reduce_mean(loss))  #reduce_mean对每张图片求和
            downsample = downsample // 2 # 下一级特征图的缩放倍数会减半
        return sum(self.losses) # 对每个层级求和
开启端到端训练
训练过程如 图20 所示,输入图片经过特征提取得到三个层级的输出特征图P0(stride=32)、P1(stride=16)和P2(stride=8),相应的分别使用不同大小的小方块区域去生成对应的锚框和预测框,并对这些锚框进行标注。
-
P0层级特征图,对应着使用 32 × 32 32\times32 32×32大小的小方块,在每个区域中心生成大小分别为 [ 116 , 90 ] [116, 90] [116,90], [ 156 , 198 ] [156, 198] [156,198], [ 373 , 326 ] [373, 326] [373,326]的三种锚框。
-
P1层级特征图,对应着使用 16 × 16 16\times16 16×16大小的小方块,在每个区域中心生成大小分别为 [ 30 , 61 ] [30, 61] [30,61], [ 62 , 45 ] [62, 45] [62,45], [ 59 , 119 ] [59, 119] [59,119]的三种锚框。
-
P2层级特征图,对应着使用 8 × 8 8\times8 8×8大小的小方块,在每个区域中心生成大小分别为 [ 10 , 13 ] [10, 13] [10,13], [ 16 , 30 ] [16, 30] [16,30], [ 33 , 23 ] [33, 23] [33,23]的三种锚框。
将三个层级的特征图与对应锚框之间的标签关联起来,并建立损失函数,总的损失函数等于三个层级的损失函数相加。通过极小化损失函数,可以开启端到端的训练过程。
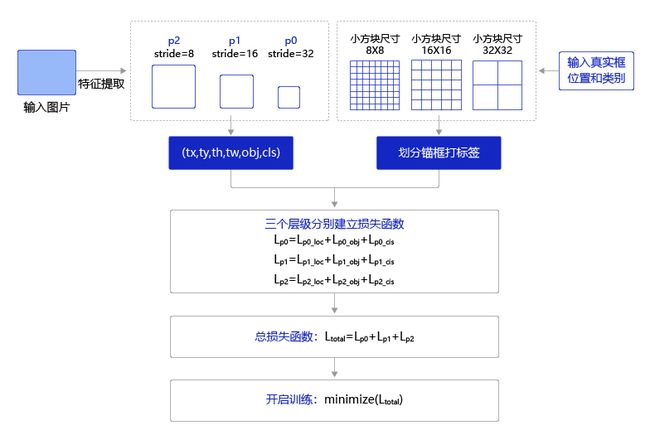
图20:端到端训练流程
训练过程的具体实现代码如下:
############# 这段代码在本地机器上运行请慎重,容易造成死机#######################

import time
import os
import paddle
import paddle.fluid as fluid

ANCHORS = [10, 13, 16, 30, 33, 23, 30, 61, 62, 45, 59, 119, 116, 90, 156, 198, 373, 326]

ANCHOR_MASKS = [[6, 7, 8], [3, 4, 5], [0, 1, 2]]

IGNORE_THRESH = .7
NUM_CLASSES = 7

def get_lr(base_lr = 0.0001, lr_decay = 0.1):
    bd = [10000, 20000]
    lr = [base_lr, base_lr * lr_decay, base_lr * lr_decay * lr_decay]
    learning_rate = fluid.layers.piecewise_decay(boundaries=bd, values=lr)
    return learning_rate

if __name__ == '__main__':

    TRAINDIR = '/home/aistudio/work/insects/train'
    TESTDIR = '/home/aistudio/work/insects/test'
    VALIDDIR = '/home/aistudio/work/insects/val'

    with fluid.dygraph.guard():
        model = YOLOv3(num_classes = NUM_CLASSES, is_train=True)  #创建模型
        learning_rate = get_lr()
        opt = fluid.optimizer.Momentum(
                     learning_rate=learning_rate,
                     momentum=0.9,
                     regularization=fluid.regularizer.L2Decay(0.0005),
                     parameter_list=model.parameters())  #创建优化器

        train_loader = multithread_loader(TRAINDIR, batch_size= 10, mode='train')  #创建训练数据读取器
        valid_loader = multithread_loader(VALIDDIR, batch_size= 10, mode='valid')  #创建验证数据读取器

        MAX_EPOCH = 200
        for epoch in range(MAX_EPOCH):
            for i, data in enumerate(train_loader()):
                img, gt_boxes, gt_labels, img_scale = data
                gt_scores = np.ones(gt_labels.shape).astype('float32')
                gt_scores = to_variable(gt_scores)
                img = to_variable(img)
                gt_boxes = to_variable(gt_boxes)
                gt_labels = to_variable(gt_labels)
                outputs = model(img)  #前向传播,输出[P0, P1, P2]
                loss = model.get_loss(outputs, gt_boxes, gt_labels, gtscore=gt_scores,
                                      anchors = ANCHORS,
                                      anchor_masks = ANCHOR_MASKS,
                                      ignore_thresh=IGNORE_THRESH,
                                      use_label_smooth=False)        # 计算损失函数

                loss.backward()     # 反向传播计算梯度
                opt.minimize(loss)  # 更新参数
                model.clear_gradients()
                if i % 1 == 0:
                    timestring = time.strftime("%Y-%m-%d %H:%M:%S",time.localtime(time.time()))
                    print('{}[TRAIN]epoch {}, iter {}, output loss: {}'.format(timestring, epoch, i, loss.numpy()))

            # save params of model
            if (epoch % 5 == 0) or (epoch == MAX_EPOCH -1):
                fluid.save_dygraph(model.state_dict(), 'yolo_epoch{}'.format(epoch))

            # 每个epoch结束之后在验证集上进行测试
            model.eval()
            for i, data in enumerate(valid_loader()):
                img, gt_boxes, gt_labels, img_scale = data
                gt_scores = np.ones(gt_labels.shape).astype('float32')
                gt_scores = to_variable(gt_scores)
                img = to_variable(img)
                gt_boxes = to_variable(gt_boxes)
                gt_labels = to_variable(gt_labels)
                outputs = model(img)
                loss = model.get_loss(outputs, gt_boxes, gt_labels, gtscore=gt_scores,
                                      anchors = ANCHORS,
                                      anchor_masks = ANCHOR_MASKS,
                                      ignore_thresh=IGNORE_THRESH,
                                      use_label_smooth=False)
                if i % 1 == 0:
                    timestring = time.strftime("%Y-%m-%d %H:%M:%S",time.localtime(time.time()))
                    print('{}[VALID]epoch {}, iter {}, output loss: {}'.format(timestring, epoch, i, loss.numpy()))
            model.train()
2020-08-29 10:20:49,564-INFO: If regularizer of a Parameter has been set by 'fluid.ParamAttr' or 'fluid.WeightNormParamAttr' already. The Regularization[L2Decay, regularization_coeff=0.000500] in Optimizer will not take effect, and it will only be applied to other Parameters!
/opt/conda/envs/python35-paddle120-env/lib/python3.7/site-packages/paddle/fluid/layers/nn.py:8658: UserWarning: actual_shape will be deprecated, it is recommended to use out_shape instead of actual_shape to specify output shape dynamically.
  "actual_shape will be deprecated, it is recommended to use "
2020-08-29 10:21:03[TRAIN]epoch 0, iter 0, output loss: [5333.0244]
2020-08-29 10:21:08[TRAIN]epoch 0, iter 1, output loss: [7005.173]
2020-08-29 10:21:11[TRAIN]epoch 0, iter 2, output loss: [3644.5017]
...
...
预测
预测过程流程 图21 如下所示:
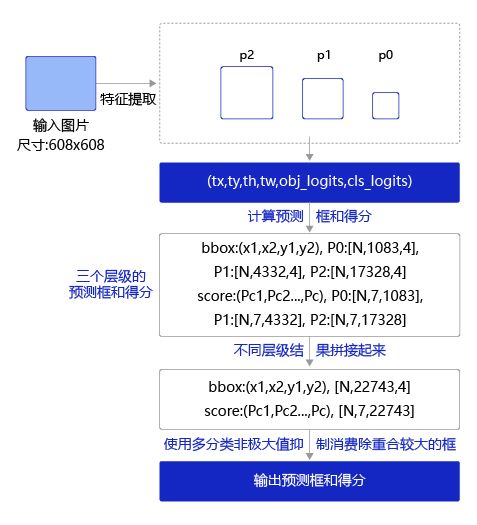
图21:端到端训练流程
预测过程可以分为两步:
- 通过网络输出计算出预测框位置和所属类别的得分。
- 使用非极大值抑制来消除重叠较大的预测框。
对于第1步,前面我们已经讲过如何通过网络输出值计算pred_objectness_probability, pred_boxes以及pred_classification_probability,这里推荐大家直接使用fluid.layers.yolo_box,关键参数含义如下:
paddle.fluid.layers.yolo_box(x, imgsize, anchors, classnum, confthresh, downsampleratio, clipbbox=True, name=None)
- x,网络输出特征图,例如上面提到的P0或者P1、P2。
- img_size,输入图片尺寸。
- anchors,使用到的anchor的尺寸,如[10, 13, 16, 30, 33, 23, 30, 61, 62, 45, 59, 119, 116, 90, 156, 198, 373, 326]
- anchor_mask: 每个层级上使用的anchor的掩码,[[6, 7, 8], [3, 4, 5], [0, 1, 2]]
- class_num,物体类别数。
- conf_thresh, 置信度阈值,得分低于该阈值的预测框位置数值不用计算直接设置为0.0。
- downsample_ratio, 特征图的下采样比例,例如P0是32,P1是16,P2是8。
- name=None,名字,例如’yolo_box’,一般无需设置,默认值为None。
返回值包括两项,boxes和scores,其中boxes是所有预测框的坐标值,scores是所有预测框的得分。
预测框得分的定义是所属类别的概率乘以其预测框是否包含目标物体的objectness概率,即
s c o r e = P o b j ⋅ P c l a s s i f i c a t i o n score = P_{obj} \cdot P_{classification} score=Pobj⋅Pclassification
在上面定义的类YOLO-V3下面添加函数,get_pred,通过调用fluid.layers.yolo_box获得P0、P1、P2三个层级的特征图对应的预测框和得分,并将他们拼接在一块,即可得到所有的预测框及其属于各个类别的得分。
# 定义YOLO-V3模型
class YOLOv3(fluid.dygraph.Layer):
    def __init__(self, num_classes=7, is_train=True):
        super(YOLOv3,self).__init__()

        self.is_train = is_train
        self.num_classes = num_classes
        # 提取图像特征的骨干代码
        self.block = DarkNet53_conv_body(
                                         is_test = not self.is_train)
        self.block_outputs = []
        self.yolo_blocks = []
        self.route_blocks_2 = []
        # 生成3个层级的特征图P0, P1, P2
        for i in range(3):
            # 添加从ci生成ri和ti的模块
            yolo_block = self.add_sublayer(
                "yolo_detecton_block_%d" % (i),
                YoloDetectionBlock(
                                   ch_in=512//(2**i)*2 if i==0 else 512//(2**i)*2 + 512//(2**i),
                                   ch_out = 512//(2**i),
                                   is_test = not self.is_train))
            self.yolo_blocks.append(yolo_block)

            num_filters = 3 * (self.num_classes + 5)

            # 添加从ti生成pi的模块,这是一个Conv2D操作,输出通道数为3 * (num_classes + 5)
            block_out = self.add_sublayer(
                "block_out_%d" % (i),
                Conv2D(num_channels=512//(2**i)*2,
                       num_filters=num_filters,
                       filter_size=1,
                       stride=1,
                       padding=0,
                       act=None,
                       param_attr=ParamAttr(
                           initializer=fluid.initializer.Normal(0., 0.02)),
                       bias_attr=ParamAttr(
                           initializer=fluid.initializer.Constant(0.0),
                           regularizer=L2Decay(0.))))
            self.block_outputs.append(block_out)
            if i < 2:
                # 对ri进行卷积
                route = self.add_sublayer("route2_%d"%i,
                                          ConvBNLayer(ch_in=512//(2**i),
                                                      ch_out=256//(2**i),
                                                      filter_size=1,
                                                      stride=1,
                                                      padding=0,
                                                      is_test=(not self.is_train)))
                self.route_blocks_2.append(route)
            # 将ri放大以便跟c_{i+1}保持同样的尺寸
            self.upsample = Upsample()

    def forward(self, inputs):
        outputs = []
        blocks = self.block(inputs)
        for i, block in enumerate(blocks):
            if i > 0:
                # 将r_{i-1}经过卷积和上采样之后得到特征图,与这一级的ci进行拼接
                block = fluid.layers.concat(input=[route, block], axis=1)
            # 从ci生成ti和ri
            route, tip = self.yolo_blocks[i](block)
            # 从ti生成pi
            block_out = self.block_outputs[i](tip)
            # 将pi放入列表
            outputs.append(block_out)

            if i < 2:
                # 对ri进行卷积调整通道数
                route = self.route_blocks_2[i](route)
                # 对ri进行放大,使其尺寸和c_{i+1}保持一致
                route = self.upsample(route)

        return outputs

    def get_loss(self, outputs, gtbox, gtlabel, gtscore=None,
                 anchors = [10, 13, 16, 30, 33, 23, 30, 61, 62, 45, 59, 119, 116, 90, 156, 198, 373, 326],
                 anchor_masks = [[6, 7, 8], [3, 4, 5], [0, 1, 2]],
                 ignore_thresh=0.7,
                 use_label_smooth=False):

        self.losses = []
        downsample = 32
        for i, out in enumerate(outputs):
            anchor_mask_i = anchor_masks[i]
            loss = fluid.layers.yolov3_loss(
                    x=out,
                    gt_box=gtbox,
                    gt_label=gtlabel,
                    gt_score=gtscore,
                    anchors=anchors,
                    anchor_mask=anchor_mask_i,
                    class_num=self.num_classes,
                    ignore_thresh=ignore_thresh,
                    downsample_ratio=downsample,
                    use_label_smooth=False)
            self.losses.append(fluid.layers.reduce_mean(loss))
            downsample = downsample // 2
        return sum(self.losses)

    def get_pred(self,
                 outputs,
                 im_shape=None,
                 anchors = [10, 13, 16, 30, 33, 23, 30, 61, 62, 45, 59, 119, 116, 90, 156, 198, 373, 326],
                 anchor_masks = [[6, 7, 8], [3, 4, 5], [0, 1, 2]],
                 valid_thresh = 0.01):
        downsample = 32
        total_boxes = []
        total_scores = []
        for i, out in enumerate(outputs):
            anchor_mask = anchor_masks[i]
            anchors_this_level = []
            for m in anchor_mask:
                anchors_this_level.append(anchors[2 * m])
                anchors_this_level.append(anchors[2 * m + 1])

            boxes, scores = fluid.layers.yolo_box(
                   x=out,
                   img_size=im_shape,
                   anchors=anchors_this_level,
                   class_num=self.num_classes,
                   conf_thresh=valid_thresh,
                   downsample_ratio=downsample,
                   name="yolo_box" + str(i))
            total_boxes.append(boxes)
            total_scores.append(
                        fluid.layers.transpose(
                        scores, perm=[0, 2, 1]))
            downsample = downsample // 2

        yolo_boxes = fluid.layers.concat(total_boxes, axis=1)
        yolo_scores = fluid.layers.concat(total_scores, axis=2)
        return yolo_boxes, yolo_scores
第1步的计算结果会在每个小方块区域都会产生多个预测框,输出预测框中会有很多重合度比较大,需要消除重叠较大的冗余预测框。
下面示例代码中的预测框是使用模型对图片预测之后输出的,这里一共选出了11个预测框,在图上画出预测框如下所示。在每个人像周围,都出现了多个预测框,需要消除冗余的预测框以得到最终的预测结果。
# 画图展示目标物体边界框
import numpy as np
import matplotlib.pyplot as plt
import matplotlib.patches as patches
from matplotlib.image import imread
import math

# 定义画矩形框的程序
def draw_rectangle(currentAxis, bbox, edgecolor = 'k', facecolor = 'y', fill=False, linestyle='-'):
    # currentAxis,坐标轴,通过plt.gca()获取
    # bbox,边界框,包含四个数值的list, [x1, y1, x2, y2]
    # edgecolor,边框线条颜色
    # facecolor,填充颜色
    # fill, 是否填充
    # linestype,边框线型
    # patches.Rectangle需要传入左上角坐标、矩形区域的宽度、高度等参数
    rect=patches.Rectangle((bbox[0], bbox[1]), bbox[2]-bbox[0]+1, bbox[3]-bbox[1]+1, linewidth=1,
                           edgecolor=edgecolor,facecolor=facecolor,fill=fill, linestyle=linestyle)
    currentAxis.add_patch(rect)


plt.figure(figsize=(10, 10))

filename = '/home/aistudio/work/images/section3/000000086956.jpg'
im = imread(filename)
plt.imshow(im)

currentAxis=plt.gca()

# 预测框位置
boxes = np.array([[4.21716537e+01, 1.28230896e+02, 2.26547668e+02, 6.00434631e+02],
       [3.18562988e+02, 1.23168472e+02, 4.79000000e+02, 6.05688416e+02],
       [2.62704697e+01, 1.39430557e+02, 2.20587097e+02, 6.38959656e+02],
       [4.24965363e+01, 1.42706665e+02, 2.25955185e+02, 6.35671204e+02],
       [2.37462646e+02, 1.35731537e+02, 4.79000000e+02, 6.31451294e+02],
       [3.19390472e+02, 1.29295090e+02, 4.79000000e+02, 6.33003845e+02],
       [3.28933838e+02, 1.22736115e+02, 4.79000000e+02, 6.39000000e+02],
       [4.44292603e+01, 1.70438187e+02, 2.26841858e+02, 6.39000000e+02],
       [2.17988785e+02, 3.02472412e+02, 4.06062927e+02, 6.29106628e+02],
       [2.00241089e+02, 3.23755096e+02, 3.96929321e+02, 6.36386108e+02],
       [2.14310303e+02, 3.23443665e+02, 4.06732849e+02, 6.35775269e+02]])

# 预测框得分
scores = np.array([0.5247661 , 0.51759845, 0.86075854, 0.9910175 , 0.39170712,
       0.9297706 , 0.5115228 , 0.270992  , 0.19087596, 0.64201415, 0.879036])

# 画出所有预测框
for box in boxes:
    draw_rectangle(currentAxis, box)
这里使用非极大值抑制(non-maximum suppression, nms)来消除冗余框。基本思想是,如果有多个预测框都对应同一个物体,则只选出得分最高的那个预测框,剩下的预测框被丢弃掉。
如何判断两个预测框对应的是同一个物体呢,标准该怎么设置?
如果两个预测框的类别一样,而且他们的位置重合度比较大,则可以认为他们是在预测同一个目标。非极大值抑制的做法是,选出某个类别得分最高的预测框,然后看哪些预测框跟它的IoU大于阈值,就把这些预测框给丢弃掉。这里IoU的阈值是超参数,需要提前设置,YOLO-V3模型里面设置的是0.5。
比如在上面的程序中,boxes里面一共对应11个预测框,scores给出了它们预测"人"这一类别的得分。
- Step0:创建选中列表,keep_list = []
- Step1:对得分进行排序,remain_list = [ 3, 5, 10, 2, 9, 0, 1, 6, 4, 7, 8],
- Step2:选出boxes[3],此时keep_list为空,不需要计算IoU,直接将其放入keep_list,keep_list = [3], remain_list=[5, 10, 2, 9, 0, 1, 6, 4, 7, 8]
- Step3:选出boxes[5],此时keep_list中已经存在boxes[3],计算出IoU(boxes[3], boxes[5]) = 0.0,显然小于阈值,则keep_list=[3, 5], remain_list = [10, 2, 9, 0, 1, 6, 4, 7, 8]
- Step4:选出boxes[10],此时keep_list=[3, 5],计算IoU(boxes[3], boxes[10])=0.0268,IoU(boxes[5], boxes[10])=0.0268 = 0.24,都小于阈值,则keep_list = [3, 5, 10],remain_list=[2, 9, 0, 1, 6, 4, 7, 8]
- Step5:选出boxes[2],此时keep_list = [3, 5, 10],计算IoU(boxes[3], boxes[2]) = 0.88,超过了阈值,直接将boxes[2]丢弃,keep_list=[3, 5, 10],remain_list=[9, 0, 1, 6, 4, 7, 8]
- Step6:选出boxes[9],此时keep_list = [3, 5, 10],计算IoU(boxes[3], boxes[9]) = 0.0577,IoU(boxes[5], boxes[9]) = 0.205,IoU(boxes[10], boxes[9]) = 0.88,超过了阈值,将boxes[9]丢弃掉。keep_list=[3, 5, 10],remain_list=[0, 1, 6, 4, 7, 8]
- Step7:重复上述Step6直到remain_list为空。
最终得到keep_list=[3, 5, 10],也就是预测框3、5、10被最终挑选出来了,如下图所示。
# 画图展示目标物体边界框
import numpy as np
import matplotlib.pyplot as plt
import matplotlib.patches as patches
from matplotlib.image import imread
import math

# 定义画矩形框的程序
def draw_rectangle(currentAxis, bbox, edgecolor = 'k', facecolor = 'y', fill=False, linestyle='-'):
    # currentAxis,坐标轴,通过plt.gca()获取
    # bbox,边界框,包含四个数值的list, [x1, y1, x2, y2]
    # edgecolor,边框线条颜色
    # facecolor,填充颜色
    # fill, 是否填充
    # linestype,边框线型
    # patches.Rectangle需要传入左上角坐标、矩形区域的宽度、高度等参数
    rect=patches.Rectangle((bbox[0], bbox[1]), bbox[2]-bbox[0]+1, bbox[3]-bbox[1]+1, linewidth=1,
                           edgecolor=edgecolor,facecolor=facecolor,fill=fill, linestyle=linestyle)
    currentAxis.add_patch(rect)


plt.figure(figsize=(10, 10))

filename = '/home/aistudio/work/images/section3/000000086956.jpg'
im = imread(filename)
plt.imshow(im)

currentAxis=plt.gca()

boxes = np.array([[4.21716537e+01, 1.28230896e+02, 2.26547668e+02, 6.00434631e+02],
       [3.18562988e+02, 1.23168472e+02, 4.79000000e+02, 6.05688416e+02],
       [2.62704697e+01, 1.39430557e+02, 2.20587097e+02, 6.38959656e+02],
       [4.24965363e+01, 1.42706665e+02, 2.25955185e+02, 6.35671204e+02],
       [2.37462646e+02, 1.35731537e+02, 4.79000000e+02, 6.31451294e+02],
       [3.19390472e+02, 1.29295090e+02, 4.79000000e+02, 6.33003845e+02],
       [3.28933838e+02, 1.22736115e+02, 4.79000000e+02, 6.39000000e+02],
       [4.44292603e+01, 1.70438187e+02, 2.26841858e+02, 6.39000000e+02],
       [2.17988785e+02, 3.02472412e+02, 4.06062927e+02, 6.29106628e+02],
       [2.00241089e+02, 3.23755096e+02, 3.96929321e+02, 6.36386108e+02],
       [2.14310303e+02, 3.23443665e+02, 4.06732849e+02, 6.35775269e+02]])

scores = np.array([0.5247661 , 0.51759845, 0.86075854, 0.9910175 , 0.39170712,
       0.9297706 , 0.5115228 , 0.270992  , 0.19087596, 0.64201415, 0.879036])

left_ind = np.where((boxes[:, 0]<60) * (boxes[:, 0]>20))
left_boxes = boxes[left_ind]
left_scores = scores[left_ind]

colors = ['r', 'g', 'b', 'k']

# 画出最终保留的预测框
inds = [3, 5, 10]
for i in range(3):
    box = boxes[inds[i]]
    draw_rectangle(currentAxis, box, edgecolor=colors[i])
非极大值抑制的具体实现代码如下面的nms函数的定义,需要说明的是数据集中含有多个类别的物体,所以这里需要做多分类非极大值抑制,其实现原理与非极大值抑制相同,区别在于需要对每个类别都做非极大值抑制,实现代码如下面的multiclass_nms所示。
# 非极大值抑制
def nms(bboxes, scores, score_thresh, nms_thresh, pre_nms_topk, i=0, c=0):
    """
    nms
    """
    inds = np.argsort(scores)
    inds = inds[::-1]
    keep_inds = []
    while(len(inds) > 0):
        cur_ind = inds[0]
        cur_score = scores[cur_ind]
        # if score of the box is less than score_thresh, just drop it
        if cur_score < score_thresh:
            break

        keep = True
        for ind in keep_inds:
            current_box = bboxes[cur_ind]
            remain_box = bboxes[ind]
            iou = box_iou_xyxy(current_box, remain_box)
            if iou > nms_thresh:
                keep = False
                break
        if i == 0 and c == 4 and cur_ind == 951:
            print('suppressed, ', keep, i, c, cur_ind, ind, iou)
        if keep:
            keep_inds.append(cur_ind)
        inds = inds[1:]

    return np.array(keep_inds)

# 多分类非极大值抑制
def multiclass_nms(bboxes, scores, score_thresh=0.01, nms_thresh=0.45, pre_nms_topk=1000, pos_nms_topk=100):
    """
    This is for multiclass_nms
    """
    batch_size = bboxes.shape[0]
    class_num = scores.shape[1]
    rets = []
    for i in range(batch_size):
        bboxes_i = bboxes[i]
        scores_i = scores[i]
        ret = []
        for c in range(class_num):
            scores_i_c = scores_i[c]
            keep_inds = nms(bboxes_i, scores_i_c, score_thresh, nms_thresh, pre_nms_topk, i=i, c=c)
            if len(keep_inds) < 1:
                continue
            keep_bboxes = bboxes_i[keep_inds]
            keep_scores = scores_i_c[keep_inds]
            keep_results = np.zeros([keep_scores.shape[0], 6])
            keep_results[:, 0] = c
            keep_results[:, 1] = keep_scores[:]
            keep_results[:, 2:6] = keep_bboxes[:, :]
            ret.append(keep_results)
        if len(ret) < 1:
            rets.append(ret)
            continue
        ret_i = np.concatenate(ret, axis=0)
        scores_i = ret_i[:, 1]
        if len(scores_i) > pos_nms_topk:
            inds = np.argsort(scores_i)[::-1]
            inds = inds[:pos_nms_topk]
            ret_i = ret_i[inds]

        rets.append(ret_i)

    return rets
下面是完整的测试程序,在测试数据集上的输出结果将会被保存在pred_results.json文件中。
import json
import os
ANCHORS = [10, 13, 16, 30, 33, 23, 30, 61, 62, 45, 59, 119, 116, 90, 156, 198, 373, 326]
ANCHOR_MASKS = [[6, 7, 8], [3, 4, 5], [0, 1, 2]]
VALID_THRESH = 0.01
NMS_TOPK = 400
NMS_POSK = 100
NMS_THRESH = 0.45

NUM_CLASSES = 7
if __name__ == '__main__':
    TRAINDIR = '/home/aistudio/work/insects/train/images'
    TESTDIR = '/home/aistudio/work/insects/test/images'
    VALIDDIR = '/home/aistudio/work/insects/val'
    with fluid.dygraph.guard():
        model = YOLOv3(num_classes=NUM_CLASSES, is_train=False)
        params_file_path = '/home/aistudio/work/yolo_epoch50'
        model_state_dict, _ = fluid.load_dygraph(params_file_path)
        model.load_dict(model_state_dict)
        model.eval()

        total_results = []
        test_loader = test_data_loader(TESTDIR, batch_size= 1, mode='test')
        for i, data in enumerate(test_loader()):
            img_name, img_data, img_scale_data = data
            img = to_variable(img_data)
            img_scale = to_variable(img_scale_data)

            outputs = model.forward(img)
            bboxes, scores = model.get_pred(outputs,
                                     im_shape=img_scale,
                                     anchors=ANCHORS,
                                     anchor_masks=ANCHOR_MASKS,
                                     valid_thresh = VALID_THRESH)

            bboxes_data = bboxes.numpy()
            scores_data = scores.numpy()
            result = multiclass_nms(bboxes_data, scores_data,
                          score_thresh=VALID_THRESH,
                          nms_thresh=NMS_THRESH,
                          pre_nms_topk=NMS_TOPK,
                          pos_nms_topk=NMS_POSK)
            for j in range(len(result)):
                result_j = result[j]
                img_name_j = img_name[j]
                total_results.append([img_name_j, result_j.tolist()])
            print('processed {} pictures'.format(len(total_results)))

        print('')
        json.dump(total_results, open('pred_results.json', 'w'))
json文件中保存着测试结果,是包含所有图片预测结果的list,其构成如下:
[[img_name, [[label, score, x1, x2, y1, y2], ..., [label, score, x1, x2, y1, y2]]],
 [img_name, [[label, score, x1, x2, y1, y2], ..., [label, score, x1, x2, y1, y2]]],
  ...
 [img_name, [[label, score, x1, x2, y1, y2],..., [label, score, x1, x2, y1, y2]]]]
list中的每一个元素是一张图片的预测结果,list的总长度等于图片的数目,每张图片预测结果的格式是:
[img_name, [[label, score, x1, x2, y1, y2],..., [label, score, x1, x2, y1, y2]]]
其中第一个元素是图片名称image_name,第二个元素是包含该图片所有预测框的list, 预测框列表:
[[label, score, x1, x2, y1, y2],..., [label, score, x1, x2, y1, y2]]
预测框列表中每个元素[label, score, x1, x2, y1, y2]描述了一个预测框,label是预测框所属类别标签,score是预测框的得分;x1, x2, y1, y2对应预测框左上角坐标(x1, y1),右下角坐标(x2, y2)。每张图片可能有很多个预测框,则将其全部放在预测框列表中。
模型效果及可视化展示
上面的程序展示了如何读取测试数据集的读片,并将最终结果保存在json格式的文件中。为了更直观的给读者展示模型效果,下面的程序添加了如何读取单张图片,并画出其产生的预测框。
- 创建数据读取器以读取单张图片的数据
# 读取单张测试图片
def single_image_data_loader(filename, test_image_size=608, mode='test'):
    """
    加载测试用的图片,测试数据没有groundtruth标签
    """
    batch_size= 1
    def reader():
        batch_data = []
        img_size = test_image_size
        file_path = os.path.join(filename)
        img = cv2.imread(file_path)
        img = cv2.cvtColor(img, cv2.COLOR_BGR2RGB)
        H = img.shape[0]
        W = img.shape[1]
        img = cv2.resize(img, (img_size, img_size))

        mean = [0.485, 0.456, 0.406]
        std = [0.229, 0.224, 0.225]
        mean = np.array(mean).reshape((1, 1, -1))
        std = np.array(std).reshape((1, 1, -1))
        out_img = (img / 255.0 - mean) / std
        out_img = out_img.astype('float32').transpose((2, 0, 1))
        img = out_img #np.transpose(out_img, (2,0,1))
        im_shape = [H, W]

        batch_data.append((image_name.split('.')[0], img, im_shape))
        if len(batch_data) == batch_size:
            yield make_test_array(batch_data)
            batch_data = []

    return reader
- 定义绘制预测框的画图函数,代码如下。
# 定义画图函数


INSECT_NAMES = ['Boerner', 'Leconte', 'Linnaeus',
                'acuminatus', 'armandi', 'coleoptera', 'linnaeus']

# 定义画矩形框的函数
def draw_rectangle(currentAxis, bbox, edgecolor = 'k', facecolor = 'y', fill=False, linestyle='-'):
    # currentAxis,坐标轴,通过plt.gca()获取
    # bbox,边界框,包含四个数值的list, [x1, y1, x2, y2]
    # edgecolor,边框线条颜色
    # facecolor,填充颜色
    # fill, 是否填充
    # linestype,边框线型
    # patches.Rectangle需要传入左上角坐标、矩形区域的宽度、高度等参数
    rect=patches.Rectangle((bbox[0], bbox[1]), bbox[2]-bbox[0]+1, bbox[3]-bbox[1]+1, linewidth=1,
                           edgecolor=edgecolor,facecolor=facecolor,fill=fill, linestyle=linestyle)
    currentAxis.add_patch(rect)

# 定义绘制预测结果的函数
def draw_results(result, filename, draw_thresh=0.5):
    plt.figure(figsize=(10, 10))
    im = imread(filename)
    plt.imshow(im)
    currentAxis=plt.gca()
    colors = ['r', 'g', 'b', 'k', 'y', 'c', 'purple']
    for item in result:
        box = item[2:6]
        label = int(item[0])
        name = INSECT_NAMES[label]
        if item[1] > draw_thresh:
            draw_rectangle(currentAxis, box, edgecolor = colors[label])
            plt.text(box[0], box[1], name, fontsize=12, color=colors[label])
- 使用上面定义的single_image_data_loader函数读取指定的图片,输入网络并计算出预测框和得分,然后使用多分类非极大值抑制消除冗余的框。将最终结果画图展示出来。
import json

import paddle
import paddle.fluid as fluid

ANCHORS = [10, 13, 16, 30, 33, 23, 30, 61, 62, 45, 59, 119, 116, 90, 156, 198, 373, 326]
ANCHOR_MASKS = [[6, 7, 8], [3, 4, 5], [0, 1, 2]]
VALID_THRESH = 0.01
NMS_TOPK = 400
NMS_POSK = 100
NMS_THRESH = 0.45

NUM_CLASSES = 7
if __name__ == '__main__':
    image_name = '/home/aistudio/work/insects/test/images/2599.jpeg'
    params_file_path = '/home/aistudio/work/yolo_epoch50'
    with fluid.dygraph.guard():
        model = YOLOv3(num_classes=NUM_CLASSES, is_train=False)
        model_state_dict, _ = fluid.load_dygraph(params_file_path)
        model.load_dict(model_state_dict)
        model.eval()

        total_results = []
        test_loader = single_image_data_loader(image_name, mode='test')
        for i, data in enumerate(test_loader()):
            img_name, img_data, img_scale_data = data
            img = to_variable(img_data)
            img_scale = to_variable(img_scale_data)

            outputs = model.forward(img)
            bboxes, scores = model.get_pred(outputs,
                                     im_shape=img_scale,
                                     anchors=ANCHORS,
                                     anchor_masks=ANCHOR_MASKS,
                                     valid_thresh = VALID_THRESH)

            bboxes_data = bboxes.numpy()
            scores_data = scores.numpy()
            results = multiclass_nms(bboxes_data, scores_data,
                          score_thresh=VALID_THRESH,
                          nms_thresh=NMS_THRESH,
                          pre_nms_topk=NMS_TOPK,
                          pos_nms_topk=NMS_POSK)

result = results[0]
draw_results(result, image_name, draw_thresh=0.5)
通过上面的程序,清晰的给读者展示了如何使用训练好的权重,对图片进行预测并将结果可视化。最终输出的图片上,检测出了每个昆虫,标出了它们的边界框和具体类别。