容器部署Prometheus+Grafana
容器部署Prometheus+Grafana
配置docker-ce 源
[root@master ~]# cd /etc/yum.repos.d/
[root@master yum.repos.d]# curl -o docker-ce.repo https://mirrors.tuna.tsinghua.edu.cn/docker-ce/linux/centos/docker-ce.repo
安装 docker-ce 以及依赖包和工具
[root@master ~]# dnf -y install yum-utils device-mapper-persistent-data lvm2
[root@master ~]# yum -y install docker-ce --allowerasing
安装完成后,使用 docker version 命令查看docker的版本信息
[root@master ~]# docker version
Client: Docker Engine - Community
 Version:           20.10.12
 API version:       1.41
 Go version:        go1.16.12
 Git commit:        e91ed57
 Built:             Mon Dec 13 11:45:22 2021
 OS/Arch:           linux/amd64
 Context:           default
 Experimental:      true
配置docker镜像 加速
[root@master ~]# mkdir -p /etc/docker
[root@master ~]# vi /etc/docker/daemon.json
{
    "registry-mirrors": ["https://7z2g0ixw.mirror.aliyuncs.com"]
}

[root@master ~]# systemctl enable --now docker
Created symlink /etc/systemd/system/multi-user.target.wants/docker.service → /usr/lib/systemd/system/docker.service
配置完成后拉取prom/Prometheus官方镜像
[root@master ~]# docker pull prom/prometheus
Using default tag: latest
latest: Pulling from prom/prometheus
3cb635b06aa2: Pull complete
34f699df6fe0: Pull complete
33d6c9635e0f: Pull complete
f2af7323bed8: Pull complete
c16675a6a294: Pull complete
827843f6afe6: Pull complete
3d272942eeaf: Pull complete
7e785cfa34da: Pull complete
05e324559e3b: Pull complete
170620261a59: Pull complete
ec35f5996032: Pull complete
5509173eb708: Pull complete
Digest: sha256:cb9817249c346d6cfadebe383ed3b3cd4c540f623db40c4ca00da2ada45259bb
Status: Downloaded newer image for prom/prometheus:latest
docker.io/prom/prometheus:latest

[root@master ~]# docker images
REPOSITORY        TAG       IMAGE ID       CREATED       SIZE
prom/prometheus   latest    a3d385fc29f9   11 days ago   201MB
在client上获取prometheus.yml配置文件
# 将prometheus的安装包上传至主机中,解压,将prometheus.yaml配置文件传输到master主机的/opt目录中
[root@client ~]# ls
anaconda-ks.cfg   prometheus-2.31.1.linux-amd64.tar.gz
[root@client ~]# tar xf prometheus-2.31.1.linux-amd64.tar.gz
[root@client ~]# cd prometheus-2.31.1
[root@client prometheus-2.31.1]# scp /root/prometheus-2.31.1/prometheus.yml 192.168.200.144:/opt/prometheus.yml
[email protected]'s password:
prometheus.yml                                                                                                          100%  934    29.3KB/s   00:00
使用官方镜像运行prometheus 容器,并进行端口和目录文件映
// 查看配置文件
[root@master ~]# cat /opt/prometheus.yml
# my global config
global:
  scrape_interval: 15s # Set the scrape interval to every 15 seconds. Default is every 1 minute.
  evaluation_interval: 15s # Evaluate rules every 15 seconds. The default is every 1 minute.
  # scrape_timeout is set to the global default (10s).

# Alertmanager configuration
alerting:
  alertmanagers:
    - static_configs:
        - targets:
          # - alertmanager:9093

# Load rules once and periodically evaluate them according to the global 'evaluation_interval'.
rule_files:
  # - "first_rules.yml"
  # - "second_rules.yml"

# A scrape configuration containing exactly one endpoint to scrape:
# Here it's Prometheus itself.
scrape_configs:
  # The job name is added as a label `job=` to any timeseries scraped from this config.
  - job_name: "prometheus"

    # metrics_path defaults to '/metrics'
    # scheme defaults to 'http'.

    static_configs:
      - targets: ["localhost:9090"]


// 查看镜像
[root@master ~]# docker images
REPOSITORY        TAG       IMAGE ID       CREATED       SIZE
prom/prometheus   latest    a3d385fc29f9   11 days ago   201MB

// 映射端口和配置文件到主机上且设置随docker启动而启动容器
[root@master ~]# docker run -d --name prometheus --restart always -p 9090:9090 -v /opt/prometheus.yml:/etc/prometheus/prometheus.yml prom/prometheus
626fd25c3be083655decb7f78103edbf9c7f82be0c97fbff27ea361c7acc1b3c

// 查看容器运行状态
[root@master ~]# docker ps |grep prometheus
626fd25c3be0   prom/prometheus   "/bin/prometheus --c…"   25 seconds ago   Up 22 seconds   0.0.0.0:9090->9090/tcp, :::9090->9090/tcp   prometheus
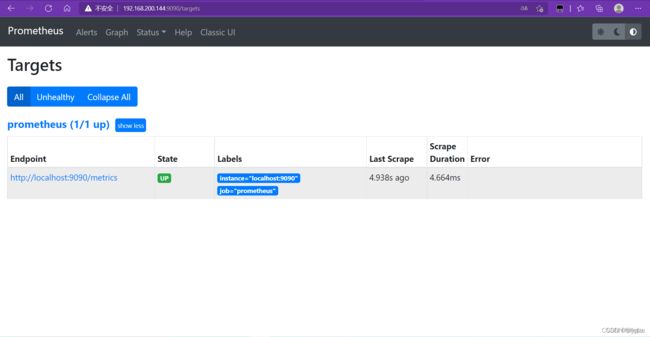
网页访问(ip+prot)
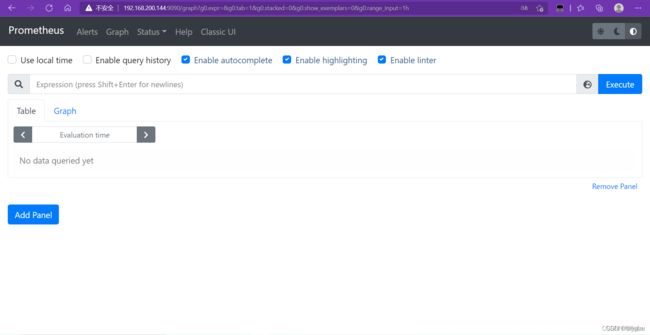
查看此时prometheus 监控的对象
监控其他主机(节点)
Prometheus可以从Kubernetes集群的各个组件中采集数据,比如kubelet中自带的cadvisor,api-server等,而node-export就是其中一种来源
Exporter是Prometheus的一类数据采集组件的总称。它负责从目标处搜集数据,并将其转化为Prometheus支持的格式。与传统的数据采集组件不同的是,它并不向中央服务器发送数据,而是等待中央服务器主动前来抓取,默认的抓取地址为http://CURRENT_IP:9100/metrics
node-exporter用于采集服务器层面的运行指标,包括机器的loadavg、filesystem、meminfo等基础监控,类似于传统主机监控维度的zabbix-agent
使用node-exporter去采集信息,最后再将信息传给Prometheus,从而实现不同节点监控。
在client主机上部署 node-exporter
将安装包传入client主机中,解压后,重命名
[root@client ~]# ls
anaconda-ks.cfg  node_exporter-1.3.0.linux-amd64.tar.gz
[root@client ~]# tar xf node_exporter-1.3.0.linux-amd64.tar.gz -C /usr/local/
[root@client ~]# cd /usr/local/

[root@client local]# ls
bin  etc  games  include  lib  lib64  libexec  node_exporter-1.3.0.linux-amd64  prometheus  sbin  share  src
[root@client local]# mv node_exporter-1.3.0.linux-amd64/ node_exporter
[root@client local]# ls
bin  etc  games  include  lib  lib64  libexec  node_exporter  prometheus  sbin  share  src
配置service文件
[root@client ~]# vi /usr/lib/systemd/system/node_exporter.service
[unit]
Description=The node_exporter Server
After=network.target

[Service]
ExecStart=/usr/local/node_exporter/node_exporter
Restart=on-failure
RestartSec=15s
SyslogIdentifier=node_exporter

[Install]
WantedBy=multi-user.target

[root@client ~]# systemctl daemon-reload
[root@client ~]# systemctl enable --now  node_exporter
Created symlink /etc/systemd/system/multi-user.target.wants/node_exporter.service → /usr/lib/systemd/system/node_exporter.service.
查看端口(默认9100端口)
[root@client ~]# ss -anlt
State               Recv-Q               Send-Q                             Local Address:Port                             Peer Address:Port
LISTEN              0                    128                                      0.0.0.0:22                                    0.0.0.0:*
LISTEN              0                    128                                         [::]:22                                       [::]:*
LISTEN              0                    128                                            *:9100                                        *:*
在master 主机上修改prometheus.yaml配置文件,添加节点
[root@master ~]# vi /opt/prometheus.yml
# my global config
global:
  scrape_interval: 15s # Set the scrape interval to every 15 seconds. Default is every 1 minute.
  evaluation_interval: 15s # Evaluate rules every 15 seconds. The default is every 1 minute.
  # scrape_timeout is set to the global default (10s).

# Alertmanager configuration
alerting:
  alertmanagers:
    - static_configs:
        - targets:
          # - alertmanager:9093

# Load rules once and periodically evaluate them according to the global 'evaluation_interval'.
rule_files:
  # - "first_rules.yml"
  # - "second_rules.yml"

# A scrape configuration containing exactly one endpoint to scrape:
# Here it's Prometheus itself.
scrape_configs:
  # The job name is added as a label `job=` to any timeseries scraped from this config.
  - job_name: "prometheus"

    # metrics_path defaults to '/metrics'
    # scheme defaults to 'http'.

    static_configs:
      - targets: ["localhost:9090"]
  - job_name: "Linux Server"
    static_configs:
      - targets: ["192.168.200.145:9100"]
重启容器
[root@master ~]# systemctl restart docker
[root@master ~]# docker ps | grep prometheus
626fd25c3be0   prom/prometheus   "/bin/prometheus --c…"   20 minutes ago   Up 5 seconds   0.0.0.0:9090->9090/tcp, :::9090->9090/tcp   prometheus
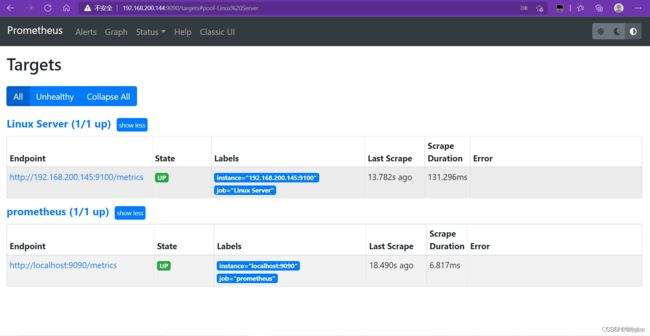
再次访问,发现新的节点信息
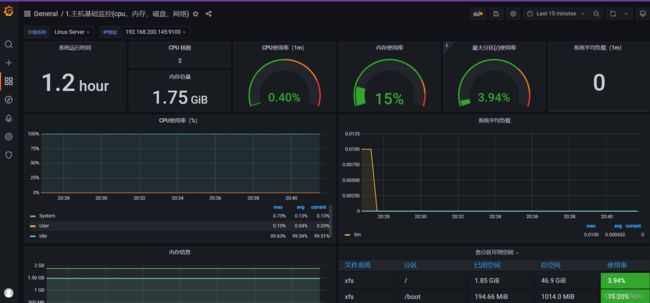
使用Grafan对监控的节点信息进行可视化
Grafan 容器部署
拉取grafan/grafan官方镜像
[root@master ~]# docker pull grafana/grafana
Using default tag: latest
latest: Pulling from grafana/grafana
97518928ae5f: Pull complete
5b58818b7f48: Pull complete
d9a64d9fd162: Pull complete
4e368e1b924c: Pull complete
867f7fdd92d9: Pull complete
387c55415012: Pull complete
07f94c8f51cd: Pull complete
ce8cf00ff6aa: Pull complete
e44858b5f948: Pull complete
4000fdbdd2a3: Pull complete
Digest: sha256:18d94ae734accd66bccf22daed7bdb20c6b99aa0f2c687eea3ce4275fe275062
Status: Downloaded newer image for grafana/grafana:latest
docker.io/grafana/grafana:latest
使用镜像运行grafan容器,并映射端口提供服务
[root@master ~]# docker images
REPOSITORY        TAG       IMAGE ID       CREATED       SIZE
prom/prometheus   latest    a3d385fc29f9   11 days ago   201MB
grafana/grafana   latest    9b957e098315   2 weeks ago   275MB
[root@master ~]# docker run -dit --name grafan -p 3000:3000 grafana/grafana
f536096b51e7ae13229e02c918bef9fc92d1ef1b1072c91934b9454ab2e555a3
[root@master ~]# docker ps | grep grafan
f536096b51e7   grafana/grafana   "/run.sh"                9 seconds ago    Up 7 seconds   0.0.0.0:3000->3000/tcp, :::3000->3000/tcp   grafan
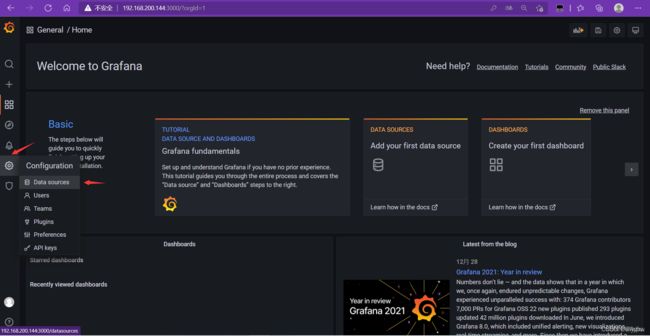
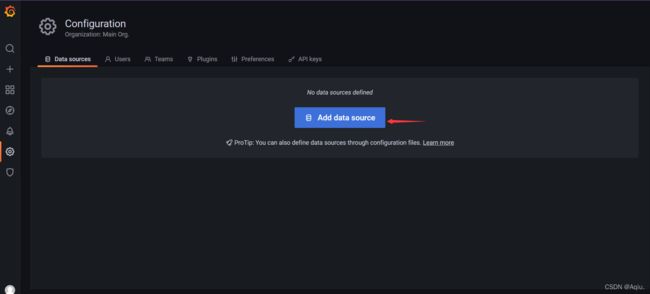
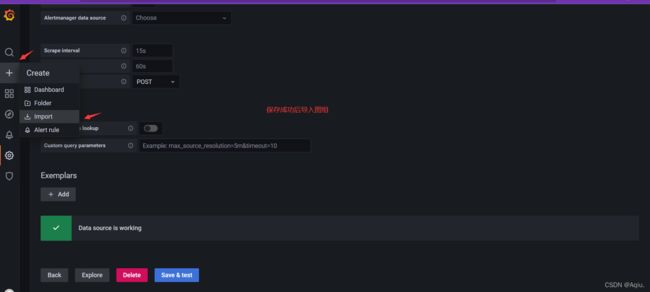
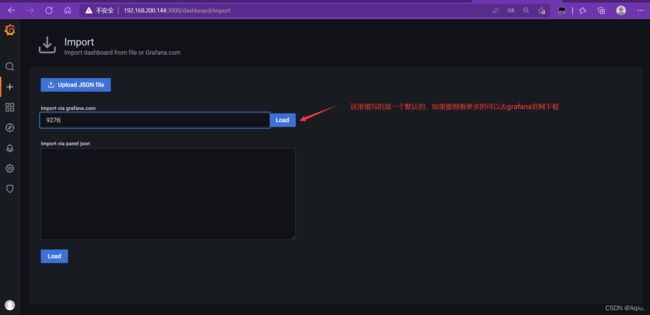
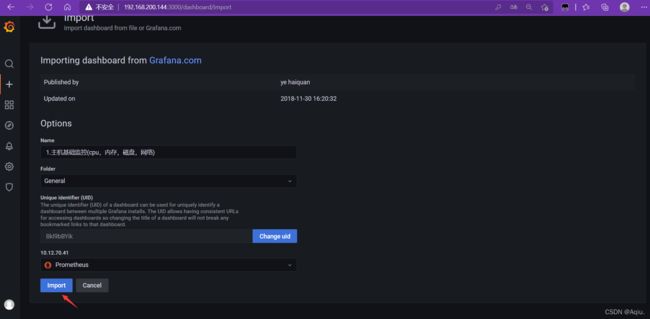
访问

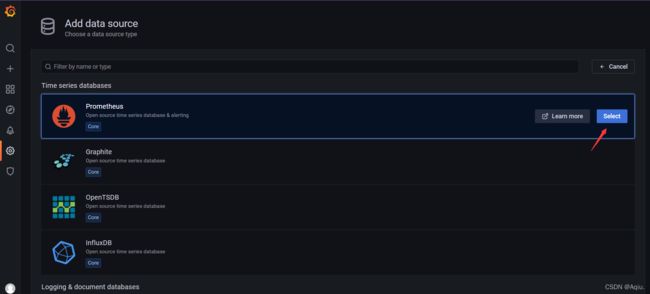
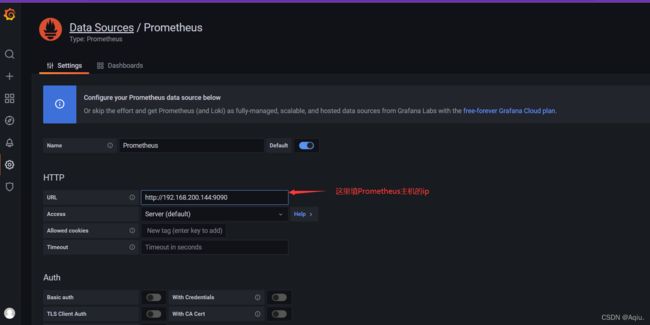
添加prometheus 数据源