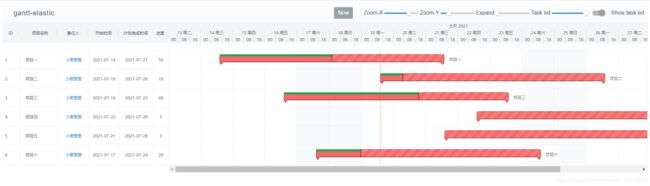
Vue整合甘特图(横道图、Gantt)实例
Vue整合甘特图(横道图、Gantt)实例
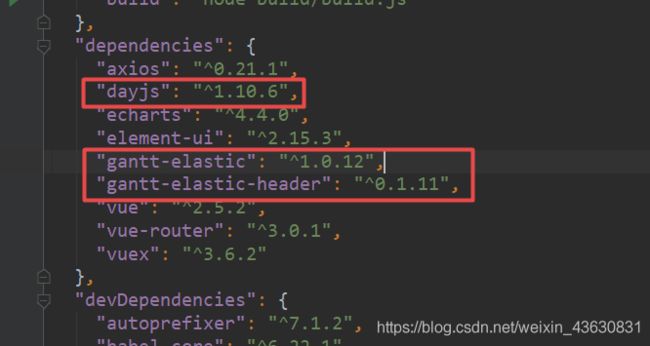
引入相应的模块:
cnpm install gantt-elastic --save
cnpm install gantt-elastic-header --save
cnpm install dayjs --save
Vue代码部分:
<template>
<div>
<!--
横道图(甘特图)的相关参数说明:
(1):options:相关配置信息
(2):tasks:想要展示的数据信息
(3)@tasks-changed:甘特图中的数据发生变化时调用的方法
(4)@options-changed:opinions中的配置改变时的调用的
(5)@dynamic-style-changed:样式发生改变时调用的
-->
<!-- tasksUpdate 方法和 optionsUpdate 方法 在从后端接口中获取数据,赋值调用的同时,会出现死循环。所以要加上一个条件进行判断 -->
<gantt-elastic :options="options" :tasks="dataShow" @tasks-changed="tasksUpdate" @options-changed="optionsUpdate"
@dynamic-style-changed="styleUpdate">
<gantt-header slot="header"/>
</gantt-elastic>
</div>
</template>
<style>
</style>
<script>
// 横道图(甘特图)需要的三个组件
import GanttElastic from 'gantt-elastic';
import GanttHeader from 'gantt-elastic-header';
import dayjs from 'dayjs';
export default {
name: 'GanttChart',
// 调用两个组件
components: {
GanttElastic, GanttHeader
},
props: {
value: {
default: ''
}
},
data() {
return {
dataShow: [
{
id: 1,
label: '项目一',
user: "小辰哥哥",
start: this.getDate(-24 * 5), // 计划开始时间(-24 * 5 代表5天前)
duration: 7 * 24 * 60 * 60 * 1000, // 周期(天、时、分、秒 ==== 7天)
end: this.getDate(-24 * 5 + 24 * 7), // 计划完成时间(计划开始时间 + 周期)
percent: 71, // 工作完成百分比(完成时间/周期)
type: 'project',
style: {
base: {
fill: '#FF6666', // 甘特图填充颜色
stroke: '#000000' // 甘特图边框颜色
}
}
collapsed: true, // 实现折叠(当有子模块时)
},
{
id: 2,
label: '项目二',
user: "小辰哥哥",
start: this.getDate(0), // 计划开始时间(0 代表从今天开始)
duration: 7 * 24 * 60 * 60 * 1000, // 周期(天、时、分、秒 ==== 7天)
end: this.getDate(24 * 7), // 计划完成时间(计划开始时间 + 周期)
percent: 0, // 工作完成百分比(完成时间/周期)
type: 'project',
style: {
base: {
fill: '#FF6666', // 甘特图填充颜色
stroke: '#000000' // 甘特图边框颜色
}
}
},
{
id: 3,
label: '项目三',
user: '<a target="_blank" style="color:#0077c0;">小辰哥哥</a>',
start: this.getDate(-24 * 3), // 计划开始时间(-24 * 3 代表3天前)
duration: 7 * 24 * 60 * 60 * 1000, // 周期(天、时、分、秒 ==== 7天)
end: this.getDate(-24 * 3 + 24 * 7), // 计划完成时间(计划开始时间 + 周期)
percent: 43, // 工作完成百分比(完成时间/周期)
type: 'project',
style: {
base: {
fill: '#FF6666', // 甘特图填充颜色
stroke: '#000000' // 甘特图边框颜色
}
}
},
{
id: 4,
label: '项目四',
user: '<a target="_blank" style="color:#0077c0;">小辰哥哥</a>',
start: this.getDate(24 * 3), // 计划开始时间(24 * 3 代表3天后)
duration: 7 * 24 * 60 * 60 * 1000, // 周期(天、时、分、秒 ==== 7天)
end: this.getDate(24 * 3 + 24 * 7), // 计划完成时间(计划开始时间 + 周期)
percent: 0, // 工作完成百分比(完成时间/周期)
type: 'project',
style: {
base: {
fill: '#FF6666', // 甘特图填充颜色
stroke: '#000000' // 甘特图边框颜色
}
}
},
{
id: 5,
label: '项目五',
user: '<a target="_blank" style="color:#0077c0;">小辰哥哥</a>',
start: this.getDate(24 * 2), // 计划开始时间(24 * 2 代表2天后)
duration: 7 * 24 * 60 * 60 * 1000, // 周期(天、时、分、秒 ==== 7天)
end: this.getDate(24 * 2 + 24 * 7), // 计划完成时间(计划开始时间 + 周期)
percent: 0, // 工作完成百分比(完成时间/周期)
type: 'project',
style: {
base: {
fill: '#FF6666', // 甘特图填充颜色
stroke: '#000000' // 甘特图边框颜色
}
}
},
{
id: 6,
label: '项目六',
user: '<a target="_blank" style="color:#0077c0;">小辰哥哥</a>',
start: this.getDate(-24 * 2), // 计划开始时间(-24 * 2 代表2天前)
duration: 7 * 24 * 60 * 60 * 1000, // 周期(天、时、分、秒 ==== 7天)
end: this.getDate(-24 * 2 + 24 * 7), // 计划完成时间(计划开始时间 + 周期)
percent: 29, // 工作完成百分比(完成时间/周期)
type: 'project',
style: {
base: {
fill: '#FF6666', // 甘特图填充颜色
stroke: '#000000' // 甘特图边框颜色
}
}
}
],
options: {
taskMapping: {
progress: 'percent'
},
maxRows: 10, // 设置最大行距
maxHeight: 700, // 设置最大高度(超出高度,出现滚动条)
times: {
timeScale: 60 * 1000, // 设置时间尺度
timeZoom: 18 // 设置甘特图进度的列宽
},
row: {
height: 30 // 设置行的样式(甘特图的高度)
},
calendar: {
workingDays: [1, 2, 3, 4, 5], // 设置每周的工作时间(周一、周二、周三、周四、周五)
gap: 20, // 距离上方的距离(设置右侧甘特图的时、天、月)、外边距
strokeWidth: 5, // 距离下方的距离(设置右侧甘特图的时、天、月)、外边距
hour: {
display: true // 设置小时是否出现
}
},
chart: {
grid: {
horizontal: {
gap: 13 // 甘特图在表格中,上下内边距
}
},
text: {
offset: 4,
xPadding: 10,
display: true // 甘特图右侧的文字是否显示
},
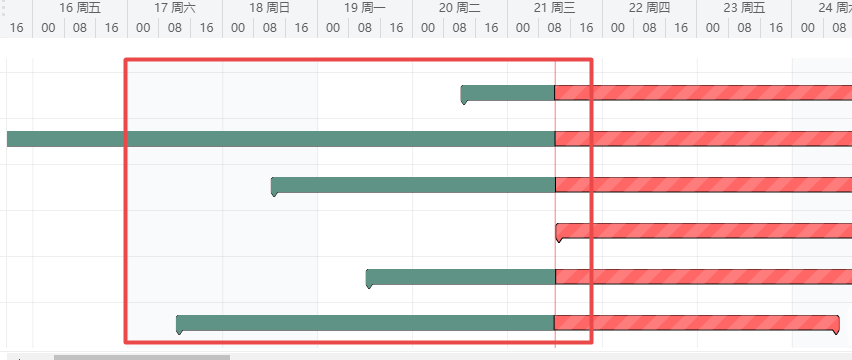
progress: {
bar: true // 特殊标记甘特图已完成区域(绿颜色区域)、样式可以通过CSS样式修改(附件1)
},
expander: { // expander设置收缩icon的样式属性
type: 'chart',
display: true,
displayIfTaskListHidden: true,
offset: 4,
size: 18
}
},
taskList: { // 设置甘特图的左侧的每一列的名称等,设置图左侧要显示的那些固定内容
expander: {
straight: false
},
columns: [
{
id: 1,
label: 'ID',
value: 'id', // 要与dataShow里面的属性名相对应
width: 50, // width为0时,可以实现整列消失
},
{
id: 2,
label: '项目名称',
value: 'label', // 要与dataShow里面的属性名相对应
width: 120, // width为0时,可以实现整列消失
expander: true, // 当存在嵌套关系时,显示“+”号进行展开
html: true,
events: {
click({data}) {
alert('description clicked!\n' + data.label); // 触发点击事件
}
}
},
{
id: 3,
label: '责任人',
value: 'user', // 要与dataShow里面的属性名相对应
width: 90, // width为0时,可以实现整列消失
html: true,
style: {
'task-list-header-label': {
'text-align': 'center',
width: '100%' // 表头水平居中
},
'task-list-item-value-container': {
'text-align': 'center',
width: '100%' // 表内数据水平居中
}
}
},
{
id: 4,
label: '开始时间',
value: task => dayjs(task.start).format('YYYY-MM-DD'), // 要与dataShow里面的属性名相对应
width: 90, // width为0时,可以实现整列消失
style: {
'task-list-header-label': {
'text-align': 'center',
width: '100%' // 表头水平居中
},
'task-list-item-value-container': {
'text-align': 'center',
width: '100%' // 表内数据水平居中
}
}
},
{
id: 4,
label: '计划完成时间',
value: task => dayjs(task.end).format('YYYY-MM-DD'), // 要与dataShow里面的属性名相对应
width: 100, // width为0时,可以实现整列消失
style: {
'task-list-header-label': {
'text-align': 'center',
width: '100%' // 表头水平居中
},
'task-list-item-value-container': {
'text-align': 'center',
width: '100%' // 表内数据水平居中
}
}
},
{
id: 5,
label: '进度',
value: 'progress', // 要与dataShow里面的属性名相对应
width: 45, // width为0时,可以实现整列消失
style: {
'task-list-header-label': {
'text-align': 'center',
width: '100%' // 表头水平居中
},
'task-list-item-value-container': {
'text-align': 'center',
width: '100%' // 表内数据水平居中
}
}
}
]
},
locale: { // 把表头设置成中文
name: 'ch',
Now: '配置',
'X-Scale': '时间',
'Y-Scale': '间隔',
'Task list width': 'Task list',
'Before/After': 'Expand',
'Display task list': 'Task list',
weekdays: ['周日', '周一', '周二', '周三', '周四', '周五', '周六'],
months: ['一月', '二月', '三月', '四月', '五月', '六月', '七月', '八月', '九月', '十月', '十一月', '十二月']
}
},
task: '',
dynamicStyle: {},
}
},
mounted() {
this.getListData();
},
methods: {
/**
* 计算从什么时间开始
*
* 返回值:当前时间 + 参数(额外的天数 * 24)、时间戳
*
* @param hours
* @returns {number}
* @author 小辰哥哥
*/
getDate(hours) {
// 获取当前时间
const currentDate = new Date();
// 年、月、日、时、分、秒
const currentYear = currentDate.getFullYear();
const currentMonth = currentDate.getMonth();
const currentDay = currentDate.getDate();
const currentHour = currentDate.getHours();
const currentMinute = currentDate.getMinutes();
const currentMillisecond = currentDate.getMilliseconds();
const timeStamp = new Date(currentYear, currentMonth, currentDay, currentHour, currentMinute, currentMillisecond).getTime();
return new Date(timeStamp + hours * 60 * 60 * 1000).getTime();
},
tasksUpdate(task) {
// tasksUpdate方法中要判断下,如果不进行判断会形成死循环
// this.tasks = task
},
optionsUpdate(options) {
this.options = options;
},
styleUpdate(style) {
this.dynamicStyle = style;
},
async getListData() {
for (let i = 0; i < this.value.length; i++) {
this.value[i].duration = this.value[i].duration * 24 * 60 * 60 * 1000;
this.value[i].end = this.value[i].start + this.value[i].duration;
}
this.tasksUpdate(this.value);
}
}
}
</script>
附件1(修改甘特图已完成部分样式):
<style scoped>
  /deep/ rect.gantt-elastic__chart-row-progress-bar-solid{
    height: 100% !important;
    fill: #5E9386 !important;
  }
</style>
总结
每天一个提升小技巧!!!